
 Performance Management Warehouse Overview
This chapter provides an overview of the Performance Management Warehouse and discusses:
The four functional warehouses.
Performance Management Warehouse architecture and data flow.
Performance Management Warehouse components.
Prerequisites for creating data marts.
The use of extract, transform, and load (ETL) to load data into the Multidimensional Warehouse (MDW).
Performance Management Warehouse OverviewPeopleSoft Performance Management Warehouse is made up of four functional warehouses. These functional warehouses provide you with the tools and technology to manage your company’s information that is used for analytic reporting and analysis. Each of the functional warehouses includes:
An ETL engine and predefined ETL jobs.
You use these jobs to move data from operational systems to the Operational Warehouse Staging (OWS) layer and from the OWS to the Operational Warehouse Enriched (OWE) layer and the MDW layer, which consolidates reporting of transaction-level data.
A data warehouse for housing and managing historical information and supporting planning and strategic applications.
Data mart definitions for multidimensional reporting and analysis.
Each of the four functional warehouses is divided into four or six subject areas, or marts. Each mart is aligned with a business process, which enables you to answer strategic questions essential to your company’s bottom line.
The Four Functional Warehouses
This section discusses the four functional warehouses:
Customer Relationship Management (CRM) warehouse
Financials warehouse
Human Capital Management (HCM) warehouse
Supply Chain warehouse
CRM WarehouseThe CRM warehouse enables you to create reports related to these business processes.
Marketing
Support
Sales
The CRM Warehouse consists of these marts:
Sales
Service
Marketing
Customer Segment
See Understanding the CRM Warehouse.
Financials WarehouseThe Financials Warehouse enables you to create reports related to these business processes:
Order Fulfillment
Procurement
Financial Control and Reporting
Project Management
Asset Lifecycle Management
Financial Control and Reporting
The Financials Warehouse consists of these marts:
Receivables
Payables
General Ledger and Profitability
Real Estate
Advanced Cost Accounting
Enterprise Services Automation (ESA)
See Understanding the Financials Warehouse.
HCM Warehouse
The HCM Warehouse enables you to create reports related to these business processes:
Deployment
Reward
Development
Recruiting
The HCM Warehouse consists of these marts:
Workforce Profile
Compensation
Learning and Development
Recruiting
See Understanding the HCM Warehouse.
Supply Chain Warehouse
The Supply Chain Warehouse enables you to create reports related to these business processes:
Order Fulfillment
Procurement
Production
The Supply Chain Warehouse consists of these marts:
Fulfillment and Billing
Procurement
Spend
Inventory
Manufacturing
Supply Chain Planning
See Understanding the Supply Chain Warehouse.
Performance Management Warehouse Architecture and Data FlowPeopleSoft Performance Management Warehouse enables your organization to store data extracted from multiple transactional systems. The data is transformed into a common format, integrated, and summarized to enable fast data retrieval for reporting. Data warehouses bring together the data from systems that may be spread across many different platforms and make it possible to access and analyze the data at a variety of levels.
PeopleSoft reporting and analysis solution sets feature fully processed data marts (both fact and dimension tables) that are optimized for reporting and include data mart row-level security To build data marts, you first use ETL to load your source data into the OWS. Then, you use ETL to move the data from the OWS to the MDW. Your selected business intelligence tool uses the tables in the MDW to create multidimensional reports.
This graphic shows the flow of data from the source through creating marts:
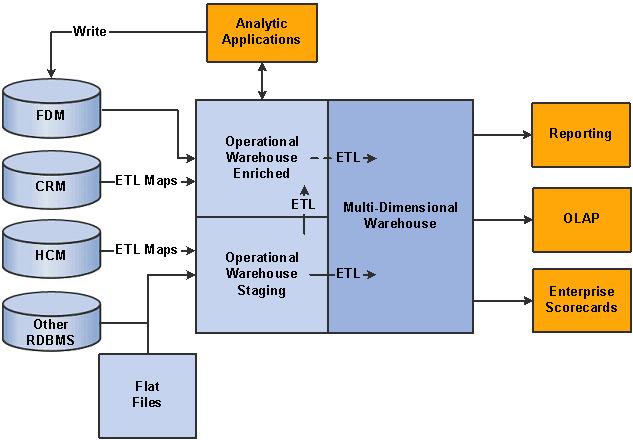
Performance Management Warehouse Data Flow
This section discusses:
Data marts versus marts.
OWS layer.
OWE layer.
MDW layer.
Data Mart Versus MartData mart is a generic term for a business intelligence content repository that is derived from operational data. Data mart content is usually limited to a specific subject area. Data marts support multidimensional reporting within a PeopleSoft analytic reporting solution.
Mart refers to a PeopleSoft product that contains specific subject areas related to one of the four delivered PeopleSoft functional warehouses. Marts are derived from the MDW and are modeled to support analytic requirements.
OWS LayerTo create reports, you first bring data from the source into the OWS layer. You use ETL jobs provided by PeopleSoft to extract and load the data into the OWS. In this step, for Enterprise, the ETL process does not transform the source data brought into the OWS; all table and field names and key structures are the same in the OWS as in the corresponding source table. For EnterpriseOne, only those columns that are required in downstream analytics are populated in the OWS; similar to Enterprise, table and field names are the same as in the corresponding source table. The ETL process brings control records, such as data for business units, calendars, and related language tables, from the source system, as well. The process adds an additional key to all staging tables. This key, SRC_SYS_ID, facilitates loading data from multiple sources into the staging area.
See Operational Warehouse - Staging (OWS).
OWE LayerFor PeopleSoft analytic applications, as well as PeopleSoft Financials Warehouse Profitability and Global Consolidations tables and Workforce external survey data, you use ETL move data from the OWS into the OWE area. The ETL process transforms data that is loaded into the OWE into D00 (for dimensions) and F00 (for facts) tables. The analytic applications use these D00 and F00 tables as a source to their applications and to create reports. With the exception of profitability, Global Consolidations, and external survey data, functional warehouse reporting data is not brought into the OWE, but is loaded from the OWS layer directly into the MDW.
See Operational Warehouse - Enriched (OWE).
MDW LayerAfter you use ETL to move your source data into the OWS, you use ETL to move your data into the MDW. The MDW enables analytical capabilities across subject areas—that is, the ability to report on data from various subject areas. For example, a CRM report can extract customer data from a Supply Chain Management application. This is possible by using conformed dimensions (dimensions that mean the same thing in every possible fact table to which they can be joined—and therefore the same thing in every functional warehouse) and shared dimensions (dimensions that are identical between two or more functional warehouses or two or more marts within a functional warehouse).
See Shared Dimensions.
The MDW is built on the principles of dimensional modeling—that is, logically modeling data for query performance starting from a set of base measurement events. Data in the MDW is grouped as it is related to one or more business processes. Data is in a star schema format—a fact table surrounded by one or more dimension tables. Generally, the star schema is in a denormalized form, which enables more efficient query processing.
In general, the MDW contains data at the most granular level—that is, the lowest level—found in the source system. This provides the most flexible choice regarding how report data is rolled up. The MDW data is based on surrogate keys rather than business keys, as this provides more efficient joining of tables. Values of surrogate keys contain no semantic content and are used specifically to join structures.
Note. Although the typical data flow is from the OWS to the MDW, there are exceptions to this rule. The number of CRM Online Marketing records can be voluminous; therefore, you do not bring online marketing data into the OWS layer. Rather, you use ETL to move the data directly from the source to the MDW.
MDW Data From OWE
The three exceptions to MDW data being sourced from the OWS are:
Profitability data is performance business unit based and is generated in the OWE.
You use ETL to move the data from the OWE to the MDW reporting. The source for the Profitability subject area is OWE table PS_PF_LEDGER_F00.
The Global Consolidation subject area is primarily sourced from the OWE table GC_CLED_MGT_F00, which is the final output table of the Global Consolidation application.
You move HCM Warehouse external survey data to the OWE before moving it to the MDW.
Performance Management Warehouse Components
This section discusses:
Dimension sources.
Delivered warehouse dimensions.
Delivered warehouse facts.
Delivered warehouse metrics.
Design of the data mart.
Reporting tools.
PeopleSoft reporting partnerships.
PeopleSoft sample metadata.
Dimension SourcesPeopleSoft defines dimensions from one or more source systems in the Data Warehouse. Dimensions can vary widely in complexity, ranging from simply turning translate values into a dimension to something complex, such as taking a PeopleSoft dimension like Customer dimension and optimizing it so that the hierarchy information can be used effectively in reporting. Some dimensions derive their source from one table, while others are derived from many tables, as determined by reporting requirements.
You build table-based dimensions using one or more PeopleSoft relational tables. These dimensions are often used only to gather data from one or several tables; however, they can also be much more complex. For example, a complex table might store all of the information needed to determine its hierarchy in a recursive format—that is, the table contains the parent in one field of the table and the child in another field in the same table. However, at any given time, a particular value could be a parent in one row and a child in another row. This type of format requires additional processing by using PeopleSoft Tree and Recursive Hierarchy process to denormalize the data into a dimension table.
Although all dimensions are table-based, in Enterprise source systems, some dimensions have hierarchy definitions that are represented as PeopleSoft trees. In the MDW, they are stored in additional hierarchy relation tables on top of the dimension.
See Processing Trees and Recursive Hierarchies.
Delivered Warehouse DimensionsDimensions are sets of related attributes that you use to group or constrain detailed information that you measure in your data mart. Dimensions are usually text (in character data type), relatively static, non-additive (that is, they cannot be used for arithmetic computations), and often hierarchical. In terms of data analysis, dimensions can be thought of as criteria, such as time, product, and location, used to locate a particular piece of data. For example, in the retail industry, a set of dimensions could be geography, product, time, customer, and vendor. The geography dimension might include company, chain, region, district, and some store attributes. The dimensional data for data marts is derived from the data imported into the Multidimensional Warehouse. This data can originate from a PeopleSoft source system, a third-party enterprise resource planning (ERP) system, or a flat file.
Business intelligence reporting typically makes use of dimensional values to filter criteria. For example, a product manager might filter the data so that a report only displays information relating to a specific product line.
Common dimensions contain a set of dimensional attributes that can be shared by all subject areas or marts. By definition, common dimensions are conformed dimensions. Fact tables can use common dimensions, shared dimensions (dimensions used by one or more functional warehouses or marts within a warehouse), and subject area dimensions (dimensions used by only one subject area, or mart). The PeopleSoft functional warehouses share these seven common dimensions:
Calendar
Time
Business Unit
Time Zone
Currency
Unit of Measure (UOM)
Language
The Calendar dimension stores date-related attributes that are associated with a measure on a specific date. The Calendar dimension has a granularity of one day. In the MDW, the Calendar dimension accommodates storage of one regular, or Gregorian, calendar, plus any number of standard or custom calendars, such as fiscal, manufacturing, and sales calendars.
In addition to having a granularity of day, the Gregorian calendar also provides hierarchies of week, month, quarter, and year. Because the application cannot consolidate calendar dates and fiscal patterns in the same hierarchy, the Calendar dimension is in the form of a snowflake dimensional structure. This is necessary because weeks do not roll up into the same hierarchy as months, and therefore require a separate hierarchy.
For user-defined calendars, the lowest granularity is also a day, which can be rolled up into a user-defined period, such as fiscal period. User-defined calendars support the concept of detail and summary periods. A detail period consists of one or more days. A summary period consists of one or more detail periods. The user-defined calendar also supports fiscal calendars, which are limited to a specific fiscal year, as well as budget calendars, which can span multiple fiscal years.
Before you load the Calendar dimension, you must configure the required input parameters. These parameters are:
Calendar Start Date.
Calendar End Date.
Day 0 value for DAY_NUM attribute.
Weekend Days
You enter these parameters on the calendar setup pages.
See Setting Up the Gregorian Calendar for the Performance Management Warehouse.
The Time dimension enables you to properly define a time of day attribute outside of the context of a specific date. This supports situations in which the time-only portion of a calendar is captured—as opposed to date and time. The granularity of the Time dimension is one minute.
The Time dimension includes a textural Time Period attribute. This attribute refers to specific periods of time, such as AM or PM.
Business units are generally defined as distinct operational or organizational entities that maintain their own sets of books or transactional data. You can associate one source system with various types of business units, such as a general ledger business unit, an inventory business unit, and a manufacturing business unit. To facilitate EPM application and EPM foundation processing, a performance business unit (PFBU) is associated with each source business unit. PFBU is used for analytical and reporting purposes and has no equivalent in the source system. Each business unit must belong to one and only one PFBU. All business units that are members of the same PFBU must have the same fiscal calendar and default currency.
A business unit can be associated with one or more business functions, as defined by its Business Unit Type attribute. Examples of Business Unit Type are Inventory business unit and General Ledger business unit. The multifunctional business unit can be associated with more than one business function. For example, business units with either Inventory Business Unit Type or Multifunctional Business Unit Type can be associated with the Inventory business function.
In EnterpriseOne, you can define a single business unit to perform a number of different tasks; thus a task might belong to more than one type of business unit. The various business units are grouped together under the Company entity. Each business unit belongs to one and only one company.
In Enterprise applications, you can relate one or more business units to a general ledger business unit. If a general ledger business unit has one or more business units associated to it, in the MDW that general ledger business unit is captured as a composite business unit, in additional to being a regular business unit in the Business Unit dimension table.
In EnterpriseOne applications, a company has multiple business units. Each EnterpriseOne company is mapped to a PF business unit.
Note. Business units that come from different source systems are different business units, even if they have the same name and the same BUSINESS_UNIT value.
The Time Zone dimension component of date and time is required if your company tracks events in different geographical locations situated in different time zones. In this situation, recording the time zone component of date and time is crucial.
Because transactional data can exist in any currency in which a company does business, companies transacting business in multiple countries often must deal with data in multiple currencies. The Currency dimension enables you to present a unified view of your enterprise data.
Companies that do business in different geographic areas often process data in different languages. The Language dimension contains a language ID, a two-letter language code, a three-letter language code, and a description. The two and three-letter language codes are based on International Organization for Standardization (ISO) codes. These ISO two and three-letter language codes are not abbreviations for the language, but they do identify a given language or group of languages.
Measurements, particularly those that relate to the supply chain, can be complicated. For example, manufacturing might measure product in carload lots or pallets. Distribution might want to see everything in shipment cases, while retail can only process items in individual scan units. To satisfy reporting requirements for the various entities that use unit of measure (UOM), the PeopleSoft application presents the measured facts in a single, standard unit of measure, with conversion factors to all of the other possible units of measure in a separate conversion table.
Because some units of measure are different when used for different products or items, a unit of measure relationship table used to facilitate a multi-tier hierarchy exists for the Unit of Measure dimension. This multi-tier system helps categorize a unit of measure and its conversion rate by role and conversion type, both of which are attributes of the Unit of Measure relationship table.
Some conversions of UOM are standard and are independent from the subject of measurement, such as from meters to feet. However, some conversions depend on a set of attributes, such as shipping vendor, business unit, a particular item, and so on. The Unit of Measure table facilitates this conversion process.
Note. You must populate this relationship table according to your particular requirements.
Certain dimensions, such as Customer, Department, and Item dimensions, are used across functional warehouses or by more than one mart within a functional warehouse. Conformity of dimension data in the data warehouse environment is essential to provide a consistent view of data and to easily integrate business measurements between functional warehouses. Therefore, these dimensions must be identical in structure and content.
To accomplish this, PeopleSoft has combined the components from various functional warehouses into one dimension for each subject area that is used by more than one functional warehouse. For example, Customer dimension uses attributes from CRM, Financials, and Supply Chain to form one shared Customer dimension that is available for use by all functional areas.
Although a shared dimension has attributes from various functional warehouses, and any functional warehouse can use this dimension, one warehouse is the owner of each dimension (for example, in the case of Customer dimension, CRM is the owner).
Note. For details of shared dimensions, see the PDF file that is published on CD-ROM with your documentation.
Function-Specific Dimensions
Many dimensions are used by only one mart within a functional warehouse. For example, dimensions such as Billing Type and Alternate Account are relevant only to the General Ledger and Profitability Mart in the Financial subject area.
Note. For details of function-specific dimensions, see the PDF file that is published on CD-ROM with your documentation.
Delivered Warehouse Facts
Facts are typically numerical values in a data mart, such as quantity, sales, and revenue, that are related to elements of your business. Facts help to quantify a company's activities. A fact is a typically an additive business performance measurement. That is, you can usually perform arithmetic functions on facts. EPM MDW fact tables contain numeric performance measurement information that is used to build data marts, which are then used in multidimensional reports that categorize your business. In a star schema, a fact table is the central table, each element of which is a foreign key derived from a dimension table.
Note. For details of facts, see the PDF file that is published on CD-ROM with your documentation, as well as the chapter specific to your warehouse.
PeopleSoft defines data mart facts from multiple sources. Each of these sources has a corresponding structure type that defines how the data is stored in the MDW. Within the MDW, fact tables are grouped with dimension tables. Although these groupings can be identified as a mart, they are available for cross-mart reporting, and thus are not actually separated into individual marts.
The most common source structure type for facts is a relational warehouse table. Table-based structure involves building fact tables using one or more PeopleSoft relational tables. These fact tables are populated using ETL jobs that gather data from these tables.
Within some of the marts, PeopleSoft delivers factless fact tables. A factless fact table has no measurement metrics; it merely captures the relationship between the associated keys.
In addition to a fact having a specific source structure type, the data within the source can be either transactional or snapshot. All PeopleSoft fact data associated with a date belongs to one of these two categories. You must identify the type of dated fact data that you are using to determine how the data is processed.
A transaction-dated fact source stores data by tracking individual events and when they occurred. To select the data for a particular date range, you retrieve all rows of data that have transaction dates between the start and end date in the desired range. For example, assume that you are measuring the number of units sold and you track the information using a transaction-dated structure. A row of data exists for each time a unit is sold, and each row has a date, or timestamp. To measure how many units sold in a week, you add all of the transactions—that is, the number of units sold—each day in that week.
In some situations, the application adds these events together over time to calculate an aggregated value.
An as of dated fact source stores the data based as a snapshot of the data at a given point in time. This snapshot often represents events across multiple time periods. It reduces the amount of data stored on a system, because each individual transaction is not stored. For example, to track company head count by month, you can determine how many employees you have on the last day of every month. You store that information instead of storing every new hire transaction and attempting to aggregate each one to the month.
Because this information is typically aggregated, this type of data is usually not additive across multiple as of dated snapshots. To aggregate this type of data, you typically use the last snapshot taken for the specific time period that you want to aggregate.
Delivered Warehouse Metrics
Base metric, or simply metric, is similar to fact, as the only difference between a fact and a metric is the application of an aggregate operator or function. For example, SALES is a fact without an aggregate operator, whereas SUM (SALES) is an example of a base metric where SUM() is the aggregate operator or function.
A derived metric includes a fact and an arithmetic operator. Arithmetic operators are add, subtract, multiply, and divide. An example of a derived metric is SUM(SALES*QTY) where SALES and QTY are each separate facts and * signifies the arithmetic operator multiply.
See Customer Connection website for detailed information about EPM metrics.
Design of the Data MartPeopleSoft provides a solution that contains conformed dimensions across all pillars within the Enterprise ERP system and various product areas in the EnterpriseOne ERP system. You may need to modify individual mart content within the MDW to fit your specific business and reporting requirements.
Any modifications that you make to the overall solution, including data mart content, will affect the reporting results. Consider the following questions when modifying the data mart design and developing reports.
Before modifying the data mart design, determine:
What business intelligence reporting tool you will use— relational online analytic processing (ROLAP) or multidimensional online analytic processing (MOLAP).
Whether you must build aggregate fact tables (if using ROLAP).
If so, determine what aggregate levels of each dimension to use for this fact table.
The typical profile of your end-users.
Evaluate Dimension Requirements
To ensure that the dimensions meet the needs of your business, determine:
The dimensions in the delivered data mart that you want to keep and the ones that you can eliminate.
The dimensions that you must create that are not part of the delivered data mart.
The changes that you must make to delivered dimensions.
If you alter an existing dimension or add a new dimension, determine:
Whether this is a dimension or merely an attribute of an existing dimension.
The hierarchies in this dimension.
The hierarchy levels in each hierarchy of this dimension.
The attributes of this dimension.
Whether you are altering the lowest level of an existing dimension.
Whether you have facts at this level.
Whether your multidimensional analysis will still work.
To ensure that the metrics you use meet the needs of your business, determine:
The metrics in the delivered data mart to keep and those to eliminate.
The metrics that you must create that are not part of the delivered data mart.
What changes you must make to delivered metrics, such as changing calculations or populating required fields.
If you alter an existing metric or add a new metric, determine:
Whether they are base metrics that you can store on a row by row basis, or are runtime calculations that you must define in the reporting tool.
What dimensions qualify this metric.
Whether this metric is an addition to an existing fact table, or must be part of a new fact table.
Whether you will use this metric along with other metrics on the same report.
Reporting ToolsAlthough the PeopleSoft application does not deliver data marts with an embedded reporting tool, and you must license a supported reporting tool separately, the data marts are designed to provide an open reporting environment. This enables you to select your desired reporting tool. Because the PeopleSoft open reporting solution stores the data mart data in relational tables, virtually any reporting tool that has connectivity to the database is able to use them.
The PeopleSoft application delivers prepackaged sample content for Business Objects, and for existing EnterpriseOne customers, PeopleSoft also delivers MicroStrategy sample content. The PeopleSoft application provides sample report templates with these tools to demonstrate how you use your reporting tool to deliver EPM analytic content over the Web. If you license a different tool to create your business intelligence reports, you must develop the metadata and build the reports.
PeopleSoft Reporting PartnershipsPeopleSoft has developed partnerships with many of the leading business intelligence reporting vendors to support an open reporting environment. Each vendor has demonstrated the basic functionality needed to effectively deliver the PeopleSoft data mart content. The partnerships include vendors of both MOLAP and ROLAP reporting architectures. This section discusses:
ROLAP
MOLAP
PeopleSoft defines a ROLAP vendor as having a reporting tool that can connect directly to the data mart for all analytical reporting. These vendors' reporting tools can connect to the database and read the relational data mart tables as a source for each report.
PeopleSoft defines a MOLAP vendor as having a reporting tool that must create a proprietary structure—that is, a multidimensional cube—from the data mart for analytical reporting. MOLAP vendors are able to connect to your database, build these structures, and then read them with their reporting tools; these structures are built using their tool set.
PeopleSoft Delivered Sample MetadataTo help provide an “out of the box” solution, PeopleSoft delivers mart metadata content for Business Objects reporting partner. To minimize your work, you can license that vendor's product. However, there are additional factors to consider when selecting your reporting tool.
The sample metadata contains all of the objects that you need to set up a preview of the predefined content delivered in the MDW. The predefined delivered content includes base metrics and attributes. PeopleSoft also provides limited content for derived metrics, filters, and prompts that are required by the delivered sample reports. The delivered objects depend on the reporting partner that PeopleSoft has selected.
The sample report metadata provides an example for you to use when building reporting metadata. You must identify how to set up the metadata for the desired type of analysis. For example, you must determine what dimensions or metrics to include on each report template, or what formulas to use for each desired ratio. Review the examples provided to help you determine this information.
The sample metadata is strategic in nature and is based on common lines of analysis through industry research carried out by PeopleSoft. Together with the data mart content, the sample metadata provides an example for your company to use when trying to meet strategic initiatives.
Prerequisites for Creating Data MartsThis section lists the prerequisites for creating a data mart. Creating data marts includes several steps, many of which depend on other steps.
Before creating a data mart:
Complete setup of the PeopleSoft Performance Management Warehouse.
Use the ETL process to load your source data into the OWS.
Use the ETL utility to move data from the OWS to the MDW.
Review the chapters that describe the specific data marts that you are licensed to use and complete any additional setup that is necessary. Each mart might have additional setup or processing steps that you must perform before creating the data mart. Review these steps in the chapter for that mart in this PeopleBook.
The Use of ETL to Load Data into the MDWRegardless of the source, you use ETL to move data into the MDW. PeopleSoft delivers data mapping jobs that you run using the Ascential tool. PeopleSoft has packaged these jobs according to functional warehouse and mart. Ascential job information specific to your mart is posted on the Customer Connection website.
See Customer Connection website for Ascential job information specific to your mart.
See Loading Data Into EPM Foundation.