
 Financials Warehouse Overview
This chapter provides an overview of the Financials Warehouse, the Financials Warehouse structure, and the Financials Warehouse components.
Financials Warehouse OverviewPeopleSoft Financials Warehouse is a comprehensive reporting and analysis platform. It includes a multidimensional warehouse (MDW) infrastructure for operational and near real-time reporting. It also contains packaged marts that provide a key multidimensional analysis and reporting environment. These marts help you understand the profitability trends and issues that your organization is facing.
With PeopleSoft Financials Warehouse, you can review data against organizational metrics and perform strategic analyses to identify and track the multiple dimensions that affect profitability, and identify key performance drivers, trends and opportunities, and so on. You are able to organize information into several easy-to-manipulate dimensions, including: Business Unit, Account, Time, Department, and Transaction Party, as well as take action on those issues that will most directly optimize business performance and influence profitability with measures and derived metrics such as debt-to-equity ratio, quick asset turnover, working capital-to-assets ratio, and receivables and payables turnover.
PeopleSoft delivers the PeopleSoft Financials Warehouse complete with extract, transform, and load (ETL) maps, data models, data marts, and a library of key profitability metrics. PeopleSoft Financials Warehouse combines the various dimensions, measures, and limited derived metrics into prepackaged financial-specific analysis and sample reports. PeopleSoft Financials Warehouse also includes the tools that enable modifying or adding to the predefined reporting content
Note. For details of dimensions, see the PDF file that is published on CD-ROM with your documentation.
Financials Warehouse StructurePeopleSoft marts are subsets of PeopleSoft Financials Warehouse and are the foundation for the reporting applications. Marts are subject-specific relational schemas created for a particular group of users for multidimensional analysis and reporting. Each core functional area of the warehouse has predefined marts. PeopleSoft Financials Warehouse includes the General Ledger and Profitability Mart, Receivables Mart, Payables Mart, Enterprise Service Automation (ESA) Mart, Real Estate Mart, and Advanced Cost Accounting Mart.
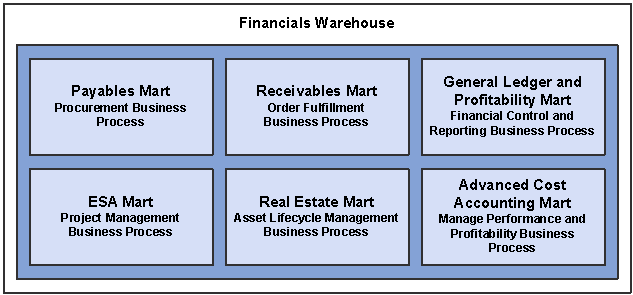
Financials Warehouse marts and business processes
Each mart is associated with a business process that helps you to answer the questions you need to keep your organization robust and ahead of its competition. With each mart, we present the fact tables that will help you answer your critical business questions.
Note. Although we list only the actual fact name, all facts that represent dollar amounts have three facts in the fact table, one
for each possible selected reporting currency. Populating the facts for alternate currencies is optional.
For additional details of facts, see the PDF file that is published on CD-ROM with your documentation.
This section discusses:
Receivables Mart
Payables Mart
General Ledger and Profitability Mart
Enterprise Service Automation (ESA) Mart
Real Estate Mart
Advanced Cost Accounting Mart
Receivables MartAccounts receivable are often the largest asset on a company’s balance sheet and are critical to its financial health. While extending credit to the customers helps boost sales, it also increases the cost of working capital and financial risk, especially in challenging economic times.
You use the Receivables Mart to analyze your company’s receivables. With it you can perform multidimensional analysis against your receivables activities and receivables information to see how much is due from customers, view accounts receivable transactional activities, analyze customer credit worthiness and risk, and conduct account receivable account level analysis.
Receivables Mart helps you identify areas within your organization contributing to higher days sales outstanding, increased credit risk, poor collection performance, or more bad debt write-offs. In essence, it helps you better understand your receivables asset and identify areas for improvement within your organization that will enable you to improve the quality of your accounts receivable and reduce the cost of working capital.
Order Fulfillment Business Process
Receivables Mart is related to PeopleSoft’s Order Fulfillment business process, which is also known as Order to Cash. The Order Fulfillment business process fulfills an organization's requirements for capturing, fulfilling, and settling goods sold. With the Order Fulfillment business process, you capture, confirm, and manage sales orders and contracts, deliver goods or services, and then invoice, collect, and resolve payment. The Order Fulfillment business process also helps you to manage returns and inventory, process customer payments, and maintain profitable customer relationships. The information captured within the Order Fulfillment business process helps you determine answers to questions such as “What are my cost per sales?”, “What is my ending receivables balance?” and “What is my bad debt compared to sales?”
Process Customer Payments is the business sub-process related to the Receivables Mart, where you receive and apply customer payments, maintain customer balances, manage past due accounts, and resolve payment discrepancies.
Receivables Delivered Fact TablesWith Receivables Mart PeopleSoft provides the following fact tables:
AR Aging
AR Transactions
Days Sales Outstanding
Credit Limit Analysis
AP-AR Netting Analysis
AR Account Line Analysis
The AR Aging fact table describes aging information by aging category and customer. With this fact group, you can answer questions such as “What money is owed in this period?” and “What percentage is past due?”, as well as determine the aging schedule of customer payments.
This is a destructively loaded fact table.
The data is extracted from the AR transactions.
Data is aggregated and aged to populate this fact table.
This table describes the AR Aging fact table facts:
|
Fact Name |
Fact Description |
|
Balance Amount |
Amount that is outstanding for that aging category. Use this fact to answer questions such as “What is the highest balance for a customer?”, “What is the highest past due for a customer?” and “What are the aging trends of my accounts receivable?” |
The Transactions fact table presents the summary of transactional information at a transaction header level. This fact group helps you determine factors such as the AR Transactions Performance metrics, for example transaction amounts, discount amounts, and so on. With this fact group, you can answer questions such as “What are the total number of AR invoices and AR payments?”, “What is the total AR invoice amount and total AR payment amount by customer?” and “What is the current status of the AR transactions?”
This is an incrementally loaded fact table.
This table both inserts and updates existing records based on the underlying AR transactions.
This table describes the AR Aging fact table facts:
|
Fact Name |
Fact Description |
|
Transaction Amount (For AR, this is the item amount) |
Total transaction amount. With this fact, you can answer questions such as “What is the transaction activity for a customer for a specific period of time?” and “What is the invoice, adjustment and payment history for a customer?” |
|
Discount Eligible 1 (Different discounts may apply based on the date payment was received.) |
Discount eligible as per payment terms. With this fact, you can answer questions such as “What is the discount eligibility for a customer?” |
|
Discount Eligible 2 (Different discounts may apply based on the date payment was received.) |
Discount eligible as per payment terms. With this fact, you can answer questions such as “What is the discount eligibility for a customer?” |
|
Discount Taken Amount |
Discount taken by the customer during payment. With this fact, you can answer questions such as “What is the discount usage for a customer?” |
|
Adjustment Amount |
Adjustment transaction amount. With this fact, you can answer questions such as “What is the total adjustment amount for a customer?” |
|
Dispute Amount |
Amount in dispute. With this fact, you can answer questions such as “What is the dispute amount for a specified customer in a given time period?” |
|
Earned Discount Amount |
Discount earned by the customer. With this fact, you can answer questions such as “What is the earned discount amount for a specified customer in a given time period?” |
|
Amount Taken as Discount |
Discount taken by the customer during payment. With this fact, you can answer questions such as “What is the amount deducted as discount by a customer when payment is made?” |
|
Unearned Discount Amount |
Unearned discount by the customer during payment. With this fact, you can answer questions such as “What is the unearned discount amount for a specified customer in a given time period?” |
|
Balance Amount |
Amount outstanding from the customer. With this fact, you can answer questions such as “What is the remaining balance amount for a particular AR invoice transaction for a specified customer?” |
|
Payment Amount |
Payment amount towards this AR item. With this fact, you can answer questions such as “What is the payment amount made by a customer in a given time period?” |
|
Discount Amount |
Total discount amount applied towards this AR item. With this fact, you can answer questions such as “What is the discount amount for that payment transaction for a specified customer in a given time period?” |
|
Discount Available Amount |
Total discount available amount available towards this AR item. With this fact, you can answer questions such as “What is the available discount amount for that payment transaction as per the payment terms for a specified customer in a given time period?” |
|
Original Discount Amount |
Original discount amount in the AR item. With this fact, you can answer questions such as “What is the original discount amount for that payment transaction as per the payment terms for a specified customer in a given time period?” |
Days Sales Outstanding Fact Table
The Days Sales Outstanding (DSO) fact table contains information about DSO data for the accounting period selected. With this fact group, you can answer questions such as “What is the days of sales outstanding?” and “How has this changed over time?”
This is a destructively loaded fact table.
Data is extracted from the AR transactions.
Data is aggregated as defined by the AR DSO process specification of the AR source system.
This table describes the fact in the Days Sales Outstanding fact table:
|
Fact Name |
Fact Description |
|
DSO Amount |
The days sales outstanding is an important financial indicator showing both the age, in terms of days, of a company's accounts receivable and the average time it takes to turn the receivables into cash. With this fact, you can answer questions such as “What is my DSO by customer?” |
Credit Limit Analysis Fact Table
The Credit Limit Analysis fact table contains information about the credit worthiness and credit allocated to a customer based on the customer’s credit rating. This fact group helps you answer questions such as “What is my available credit and credit limit by customer?”
This is a destructively loaded fact table.
The data is extracted from the AR Aging Analysis fact table and the credit attributes of a customer.
The currency conversion is based on the currency code for Credit Limit Amount, rather than the transaction currency.
This table describes the facts in the Credit Limit Analysis fact table:
|
Fact Name |
Fact Description |
|
Customer Credit Percentage Over Limit |
Percentage by which customers are allowed to exceed their credit limits before hold processing takes effect. With this fact, you can answer questions such as “What is the customer credit limit percentage over limit and how much has the customer actually exceeded this credit limit range?” |
|
Corporate Credit Percent Over Limit |
Percentage by which corporate customers are allowed to exceed their credit limits before hold processing takes effect. With this fact, you can answer questions such as “What is the customer credit limit percentage over limit and how much has the customer actually exceeded this credit limit range?” |
|
Customer Credit Limit Range |
Percentage to represent a comfort level that is relative to the customer’s credit limit. With this fact, you can answer questions such as “What is the customer credit limit range and does the pending AR outstanding credit fall within this range?” |
|
Corporate Credit Limit Range |
Percentage that represents a comfort level that is relative to the corporate customer’s credit limit. With this fact, you can answer questions such as “What is the customer credit limit range and does the pending AR Outstanding Credit fall within this range?” |
|
Actual Customer Credit Limit Range |
Actual customer credit limit range. With this fact, you can answer questions such as “What is the actual customer credit limit?” and “What is the outstanding AR amount and by what percentage is the AR outstanding above or below the credit limit?” |
|
Actual Corporate Credit Limit Range |
Actual corporate credit limit range. With this fact, you can answer questions such as “What is the actual customer credit limit?” and “What is the outstanding AR amount and by what percentage is the AR outstanding above or below the credit limit?” |
AR-AP Netting Analysis Fact Table
The AR-AP Netting Analysis fact table contains information about the AR amounts outstanding of a customer and the AP amount outstanding from the company to that customer (if that customer is also a supplier to the company). This provides a net total for the customer or supplier. With this fact group, you can answer questions such as “What is net balance for a customer or supplier?”
This is a destructively loaded fact table.
Data is extracted from the AR Aging fact table and the AP Aging fact table for that customer or supplier.
This table describes the facts in the AR-AP Netting Analysis fact table:
|
Fact Name |
Fact Description |
|
AP Outstanding Amount |
Amount that is outstanding to suppliers for that aging category. Use this fact to answer questions such as “What is the highest balance for a supplier?”, “What is the highest past due for a supplier?” and “What are the aging trends of my accounts payable?” |
|
AR Outstanding Amount |
Amount that is outstanding and to be paid by the customer. Use this fact to answer questions such as “What is the outstanding balance for a customer with respect to the customer’s credit limit?” |
|
Available Credit Limit |
Difference between the AP Outstanding Amount and AR Outstanding Amount. With this fact, you can answer questions such as “What is the AR-AP Netting Balance Amount for customers who are also suppliers?” and “What is the AP and AR Balance for a customer who is also a supplier?” |
AR Account Line Analysis Fact Table
The AR Account Line Analysis fact table contains all AR accounting entries posted by the AR module.
This table describes the fact in the AR Account Line Analysis fact table:
|
Fact Name |
Fact Description |
|
Journal Amount |
Journal monetary amount. With this fact, you can answer questions such as “What is the Journal Amount posted to the general ledger for the selected AR account by AR Transactions?” |
Payables MartYou use Payables Mart to report and analyze the performance of your suppliers and your payables department. Payables Mart includes information about suppliers, vouchers, match exceptions, and payments. This mart helps you to assess your supplier relationships by answering questions such as "Which suppliers have billing errors?" and "How long does it take us to pay suppliers?" With this information, you can ask suppliers for better service or negotiate with them for better terms. To measure performance of your payables department, this mart helps answer questions such as "What are my accounts payable aging balances?", “Does my organization take advantage of supplier discounts?” and "How many vouchers are entered per day?" You can analyze results across many dimensions, enabling you to compare performance of multiple payables departments or even individual employees. After you understand current performance levels, you can set targets and monitor results.
Payables Mart includes data needed to calculate standard metrics such as Days Payable Outstanding, Accounts Payable Turnover, and Sales to Accounts Payable Ratio. With this information, you can measure your organization against external benchmarks. You can baseline your own results and then work towards improving payables performance over time, as specified by your overall corporate strategy.
Payables Mart is tied to PeopleSoft’s Procurement business process, which is also known as the Source to Settle business process. The Procurement business process fulfills an organization's requirements for sourcing, engaging, procuring, and settling payment for goods, services, or both. The Procurement business process enables you to determine profitability sourcing strategies, collaborate with suppliers, and drive efficient procurement and settlement for all goods and services.
Pay Supplier is the business sub-process related to Payables Mart, which aides you in areas such as creating and matching vouchers, resolving disputes with suppliers, and creating payment.
Payables Mart Delivered Facts
With the Payables Mart, PeopleSoft provides the following fact tables:
Aging Analysis
AP Transactions
AP Account Line
Voucher Match Exception
The Aging Analysis fact table contains the aging information by aging category and supplier. With this fact group, you can answer questions such as “What money is owed in this period?” and “What percentage is past due?” and also determine the aging schedule for supplier payments.
This is a destructively loaded fact table.
Data is extracted from the AP Transactions.
Data is aggregated and aged to populate this fact table.
This table describes the facts in the Aging Analysis fact table:
|
Fact Name |
Fact Description |
|
Gross Amount |
Amount that is outstanding to suppliers for that aging category. Use this fact to answer questions such as “What is the highest balance for a supplier?”, “What is the highest past due for a supplier?” and “What are the aging trends of my accounts payable?” |
|
Discount Amount |
Amount that is available as discount as per the terms of the voucher. Use this fact to answer questions such as “What is the total discount amount available in AP Vouchers?” |
|
Prepaid Amount |
Amount that was prepaid against this AP Voucher. Use this fact to answer questions such as “What is the total prepaid amount to a specified supplier?” |
|
Total Amount |
The result of Gross Amount − Discount Amount − Prepaid Amount. Use this fact to answer questions such as “What is the total AP outstanding amount to be paid to a specified supplier?” |
The AP Transactions fact table contains the summary of transactional information at a transaction header level. With this fact group, you can answer questions such as “What are the total number of AP vouchers and AP payments?”, “What is the total AP voucher amount and total AP payment amount by supplier?” and “What is the current status of the AP transactions?”
This is an incrementally loaded fact table.
This table both inserts and updates existing records based on the underlying AP Transactions.
This table describes the facts in the AP Transactions fact table:
|
Fact Name |
Fact Description |
|
Transaction Amount (for AP, this is the payment amount). |
Total transaction amount. With this fact, you can answer questions such as “What is the transaction activity for a supplier for a specific period of time?” and “What is the voucher, adjustment and payment history for a supplier?” |
|
Discount Eligible |
Discount eligible as per payment terms. With this fact, you can answer questions such as “What is the discount eligible to be deducted if AP vouchers are to be paid as per due date?” |
|
Adjustment Amount |
Adjustment amount to the original AP voucher amount. Use this fact to answer questions such as “What is the adjustment amount in the AP Transactions?” and “How efficient is the AP process?” |
|
Paid Amount |
Amount paid to the supplier in the AP payment transaction. With this fact, you can answer questions such as “What is the total amount paid in AP payment transactions?” and “What is the AP amount paid to a specified supplier during a period of time?” |
|
Open Amount |
Amount pending payment to the supplier for an AP voucher transaction. With this fact, you can answer questions such as “What is the total pending AP amount for a particular supplier?” |
|
Gross Paid Amount |
Gross amount paid to the supplier in the AP payment transaction, including items such as tax. With this fact, you can answer questions such as “What is the AP gross paid amount to suppliers during a specified time period?” |
|
Discount on Paid Amount |
Deducted discount amount applied to the paid amount in the AP payment transaction. Use this fact to answer questions such as “What is the total amount claimed as discount during a specified time period?” and “What is the amount saved as discount over time?” |
|
Discount Lost on Paid Amount |
Amount that could have been deducted if the AP voucher were paid on time. Use this fact to answer questions such as “What is AP amount lost as discount over time?” |
|
Late Charge Amount |
Amount identified as late charge to the supplier in the AP payment transaction. Use this fact to answer questions such as “What is the total late charge amount to a particular supplier over time?” |
|
Late Charge Denied Amount |
Amount that is not considered as late charge in the AP payment transaction. Use this fact to answer questions such as “What is the late change denied amount to a particular supplier?” |
|
Late Charge Paid Amount |
Amount paid as late charge to the supplier in the AP payment transaction. Use this fact to answer questions such as “What is the total late change paid amount to a particular supplier over time?” |
The AP Account Line fact table contains all of the AP accounting entries posted by the AP module. With this fact group, you can answer questions such as “What are the posting details of the AP transactions to GL in a specified time period?”
This is an incrementally loaded fact table.
Because it is extremely granular, this table may contain millions records.
This table describes the fact in the AP Account Line fact table:
|
Fact Name |
Fact Description |
|
Journal Amount |
Journal amount in the accounting entry in base and transaction currency. With this fact, you can answer questions such as “What is the journal amount posted to the GL for the selected AP account by AP transactions?” |
Voucher Match Exception Fact Table
The Voucher Match Exception fact table contains information about all failed transactions of the AP matching process. With this fact group, you can answer questions such as “What is the number of exceptions generated by the AP voucher matching process by supplier and AP operator ID?”
This is a destructively loaded fact table.
The data is extracted from the AP Matching Process Exception table and is aggregated by Matching Rule.
This table describes the fact in the Voucher Match Exception fact table:
|
Fact Name |
Fact Description |
|
Match Exception Count |
Total number of match exceptions occurrences during the AP processing. With this fact, you can answer questions such as “What is the count of voucher matching exceptions generated for a supplier by an AP operator ID?” |
General Ledger and Profitability MartGeneral Ledger and Profitability Mart helps you analyze things such as the condition of assets, liabilities, and equity of an organization, as well as the profit and loss position of an organization. This mart also enables your organization to compare results for a period across fiscal years. Additionally, it helps you determine which customers, products, and channels are most profitable and why. With it, you are able to rank customers based on revenue, gross margin, net income, or total expenses. You can identify changes in product mix, analyze profitability trends over time, and learn how each factor impacts costs, profit, and ultimately, the value of your organization. If you have purchased PeopleSoft Global Consolidations, you can access this information through the Profitability Mart.
Global Consolidations introduces consolidation by using flows that enable you to track and reconcile the gross variation of an account. Gross variation is the difference between the opening and closing balances of an account. For example, the gross variation of a fixed asset account can be distinguished by additions, disposals, deprecation, asset impairment, current translation, and reclasses. Data flow of specific accounts is required as part of regulatory reporting, such as Security and Exchange Commission, International Accounting Standards, and so on. This feature enables you to identify and document the change in account activity, meet certain regulatory requirements, and provide financial statement footnotes.
Note. The Global Consolidation subject area is primarily sourced from the Operational Warehouse Enriched (OWE) tables GC_CLED_MGT_F00 and GC_FLOW_MGT_F00, which are the final output tables of the Global Consolidation application. The Profitability subject area is sourced from the OWE table PF_LEDGER_F00.
Financial Control and Reporting Business Process
PeopleSoft Financial Control and Reporting business process fulfills an organization's requirements for recording, settling, consolidating, and reporting enterprise financial transactions. Using the Financial Control and Reporting business process, you capture and record financial transactions, transform financial information, allocate costs and adjust currencies, and close your books. You can use this information to report your results and to analyze your financial information, as well as to adjust your budgets, business events, and strategic plans. The Financial Control and Reporting business process helps you answer questions such as “How is my company performing against budget?”, “How is my company performing against previous years?”, What is my company’s cash flow position?” and “How strong is my company’s liquidity and solvency?”
Analyze Financial Information is the business sub-process tied to the General Ledger and Profitability Mart, which aids you in analysis of areas such as creating allocations, revaluing balances, performing eliminations, recording period end adjustments, and consolidating data.
General Ledger and Profitability Mart Delivered Fact TablesWith General Ledger and Profitability Mart PeopleSoft provides the following fact tables:
Profitability
GC Ledger
Ledger
Journal
GL Beginning Balance
GC Flows
The Profitability fact table contains ledger level facts sourced from PF_LEDGER_F00, which is created by various processes such as PeopleSoft Allocation Manager and PeopleSoft Activity Based Management. This fact table helps you answer questions such as “What is the activity level for specific business activities, business units or entities?”, “ What is the relative activity for the business activities, business units or entities across time, within or across fiscal years?”, “ What is the trend of spending for specific expense line items across specific organizational units?” and “ What is the revenue trend for specific products or services within a region or across organizational units?”
This table describes the facts in the Profitability fact table:
|
Fact Name |
Fact Description |
|
Beginning Period Amount |
The amount for the beginning of the accounting period. Use this fact to answer questions such as “What was the balance at the beginning of the accounting period?” |
|
Ending Period Amount |
The amount for the end of the accounting period. Use this fact to answer questions such as “What was the balance at the end of the accounting period?” |
|
Net Period Amount |
The Posted Base Amount field from PF_LEDGER_F00. This fact represents the net change amount for an accounting period. Use this fact to answer questions such as “How much did the balance grow during the accounting period?” |
Note. The Net Period Amount is the amount provided on the ledger. The Beginning Period Amount and Ending Period Amount are provided to facilitate reporting. For example, assume the net amount for January is 10. This number is of limited use for reporting, as it must be considered in relation to the beginning amount. Assuming the beginning amount is 100, you add 10 (the net amount) to get 110 (the end amount). With these three amounts, you can create a wide variety of reports, although they all help to answer the same business questions. Also, be aware that the end amount of a period becomes the beginning amount for the next period.
The GC Ledger fact table contains the consolidated results from all of your sources. With this fact group, you can answer questions such as “What are my aggregate assets for all of my source ledgers?”
This table describes the facts in the GC Ledger fact table:
|
Fact Name |
Fact Description |
|
Posted Transactional Amount |
Posted transaction amount. With this fact, you can answer questions such as “What is the actual transactional amount I posted to Global Consolidations from my sources?” |
|
Posted Base Amount |
Posted base amount. With this fact, you can answer questions such as “What is the actual amount in base currency that I posted to Global Consolidations from my sources?” |
The Ledger fact table contains posted journals aggregated to the period level. Period beginning, ending, net, and three-month rolling ending average amounts are provided. This fact group helps you answer questions such as “ How much revenue was recognized this period?”
This table describes the facts in the Ledger fact table:
|
Fact Name |
Fact Description |
|
Beginning Period Amount |
The amount for the beginning of the accounting period. Use this fact to answer questions such as “What was the balance at the beginning of the accounting period?” |
|
Ending Period Amount |
Ending period amount. Use this fact to answer questions such as “What was the value of our inventory at the end of the period?” |
|
Net Period Amount |
The Posted Base Amount field from the ledger. This fact represents the net change amount for an accounting period. Use this fact to answer questions such as “How much did the balance grow during the accounting period?” |
|
Rolling average amount |
Three- month ending period rolling average transaction amount. Use this fact to answer questions such as “What was the average amount for this account over the past six months?” |
The Journal fact table contains the lowest level of detail. All journals that are posted are available for analysis at the journal line level. The Journal fact table helps provide an audit trail for activity affecting the ledger.
This table describes the fact in the Journal fact table:
|
Fact Name |
Fact Description |
|
Journal amount |
Journal monetary amount. With this fact, you can answer questions such as “Which journal entries drove the change in my ledger balance?” |
GL Beginning Balance Fact Table
The GL Beginning Balance fact table contains facts at the fiscal year level. Period beginning, ending, and net amounts are available. Requested budget, approved budget, and final budget amounts are also available. The GL Beginning Balance fact table helps answer questions such as “What is the variance between prior year actuals and current year budget proposals and final data?” You can use this information to provide financial facts for the budget preparation process.
This table describes the facts in the GL Beginning Balance fact table:
|
Fact Name |
Fact Description |
|
Ending Fiscal Year Amount |
Ending fiscal year amount. With this fact, you can answer questions such as “What was the balance of this account at the end of last year?” |
|
Net Fiscal Year Amount |
Net fiscal year amount. With this fact, you can answer questions such as “How much did this account grow over the past year?” |
|
Requested Budget Amount |
Requested budget amount. With this fact, you can answer questions such as “What was the budget amount that we requested?” |
|
Approved Budget Amount |
Approved budget amount. With this fact, you can answer questions such as “How much of my requested budget amount was approved?” |
|
Final Budget Amount |
Final budget amount. With this fact, you can answer questions such as “What is the final budget amount after all adjustments have been applied?” |
The GC Flows fact table contains all the flows activities entered. With this fact group, you can answer questions such as “What is the breakdown of a fixed asset account by additions?”
This table describes the facts in the GC Flows fact table:
|
Fact Name |
Fact Description |
|
Posted Transaction Amount |
Amount in transaction currency. With this fact, you can answer questions such as “How much of an impact are fluctuations in currency conversion rates having on my cash flow?” |
|
Posted Base Amount |
Amount in base currency. With this fact, you can answer questions such as “What was the largest contributor to increase in my cash flow?” |
Analyzing projects and contracts is an increasingly important, yet difficult task in the growing services economy. Whether you are part of a professional services organization, an internal IT department, a research organization, or a capital project accounting department, Enterprise Service Automation (ESA) Mart helps you analyze project performance; contract profitability; resource utilization; and time and expense compliance.
ESA Mart includes data that you need to calculate standard metrics such as Proposal Pipeline, Project Profitability, Contract Revenue Recognized, Estimate to Complete, Resource Utilization, and Earned Value. With this information, you can measure your organization against external benchmarks. You can create a baseline for your own results, and then work towards improving project performance over time, as specified by your overall corporate strategy.
Project Management Business Process
ESA Mart is tied to PeopleSoft’s Project Management business process. The Project Management business process fulfills an organization's requirements for the delivery of professional or internal services, such as planning, prioritizing, and managing resources and projects. If customer focused, this business process includes managing contracts, as well as contract changes, billing, and revenue information. Both the customer and internally focused process includes capturing project costs, adjusting projects, and settling expenses, and so on.
The information captured within the Project Management business process helps you determine answers to questions such as “How is my project performing?”, “Is this contract profitable?”, “What is the organization’s resource utilization?” and “How much of the corporate expenses are compliant with policy?”
Create Project, Execute Project, and Assign Resources to Project are business sub-processes related to ESA Mart. These business sub-processes aid you in areas such as creating projects and tasks, defining budget and resource requirements, tracking projects, and adjusting transactions, resources, scope and schedules, as well as creating service orders and assigning resources.
ESA Delivered Fact TablesESA Mart is divided into the following subject areas and the following fact tables:
Project
Project Transaction
Project Activity (Current and Periodic)
Project (Current and Periodic)
Project Deliverable
Project Issue
Project Change
Proposal and Grant — Proposal and Grant Transaction Detail
Resources
Assignment
Employee Forecast
Resource Rate
Service Order
Expense
Time Report Daily Detail
Expense Distribution Transaction Detail
Expense Report Approval
Contracts
Contract Transaction Detail
Contract Distribution Transaction Detail
Contract Revenue Recognition
Contract Amendment
Contract Forecast (Current and Periodic)
Contract Renewal
Project − Project Transaction Fact Table
The Project Transaction fact table maintains project financial transactions data. With the exception of programs (summary projects), at the most basic level, each project is composed of transactions. These transactions contain the quantity and amounts associated with each transaction and all of the identifying information that accompanied those costs.
With this fact group, you can answer questions such as “What is the total cost of the project?”, “What is the total revenue of the project?”, “What is the total cost of the activity?”, “What is the total revenue of the activity?”, “How many hours were billed against this project?” and “What is the budget versus actual for this project?”
This table describes the facts in the Project Transaction fact table.
|
Fact |
Fact Description |
|
Resource Amount |
Resource amount associated with the project transaction. Use this fact to identify how much a specific resource costs compared to other resources. This enables a business to determine their highest and lowest resource costs and may help on future projects to determine the best allocation of resources. |
|
Resource Quantity |
Resource quantity associated with the project transaction. Use this fact to determine the quantity of a particular resource that is being utilized on a project. This enables a business to determine, in conjunction with the resource amount, the total cost of a resource over a specified period of time. |
|
Conversion Rate |
Unit of measure conversion rate is used for subsequent hour calculations. This rate ensures that all time related metrics are presented in hours. This fact enables a business to compare all resources using the same yardstick of measurement to determine costs when comparing resources for the most cost-effective solution. |
Project − Project Activity (Current and Periodic) Fact Table
The Project Activity (Current and Periodic) fact table maintains information about a project activity (tasks) measures.
With this fact group, you can answer questions such as “What is the actual cost of work performed (ACWP) for this activity?”, “What is the budgeted cost of worked scheduled (BCWS) for this activity?” and “What is the budgeted cost of work performed (BCWP) for this activity?”
See PeopleSoft Setting Up Procurement Options PeopleBook: Using Voucher and Order Contracts
This table describes the facts in the Project Activity (Current and Periodic) fact table:
|
Fact |
Fact Description |
|
Complete Percent |
Activity’s percent complete. Use this fact to answer questions such as “What is the percent complete for a particular activity?” |
|
Duration Days |
Activity's duration, in days. Duration does not equal work hours. For example, the expected duration of a given activity can be 5 days, but the work assigned to the activity may be 80 hours with two resources working on the activity. Use this fact to answer questions such as “How many days will an activity take to complete?” |
|
Duration Hours |
Activity's duration, in hours. This fact refers to the number of hours an activity will take, regardless of the number of resources and which days are worked. For example, if the duration is 80 hours and there are two resources working 40 hours a week, then the duration days would be 14. Use this fact to answer questions such as “How many hours before an activity will complete?” |
|
Assigned Work Hours |
Total number of hours spent or to be spent by a resource on an activity. Work does not equal duration. For example, the expected duration of a given activity can be 5 days but the work assigned to the activity may be 80 hours with two resources working on the activity. Use this fact to answer questions such as “How many work hours are required to complete an activity?” |
|
Budget Hours |
Number of hours budgeted for the activity. Use this fact to answer questions such as “What is the comparison of budget to actual work hours?” |
|
Baseline Work Hours |
Baseline work hours for an activity. Use this fact to answer questions such as “What is the comparison of baseline to actual hours for an activity?” |
|
Actual Work Hours |
Actual number of hours spent by a resource on an activity. It is captured in PROJ_RESOURCE at the project activity resource detail from many different sources including PeopleSoft Expense, and PeopleSoft Time and Labor. Actual work at the activity level is calculated by rolling up the detailed actual rows. Use this fact to answer questions such as “How many hours did it actually take to complete an activity?” |
|
Unbilled Labor Hours |
Number of unbilled labor hours. This fact enables estimates of the remaining cost for an activity, if and when all billable hours are charged. Use this fact to answer questions such as “How many unbilled labor hours are associated with an activity?” |
|
Billed Hours |
Number of billed hours. Use this fact to answer questions such as “How many billed hours are associated with an activity?” |
|
Revenue Not Recognized Amount |
Revenue not recognized amount. Use this fact to answer questions such as “How much revenue has not yet been booked to GL and has not yet been collected?” This is an important measure for Sarbanes Oxley compliance. |
|
Budget Amount |
Activity’s budgeted amount. Use this fact to answer questions such as “What is the comparison of actual to budget amounts for an activity?” |
|
Revenue Amount |
Revenue to date. Use this fact to answer questions such as “What is the comparison of actual to budgeted amounts for an activity?” |
|
Revenue Billed Not Recognized Amount |
Revenue billed not recognized. Use this fact to answer questions such as “How much revenue is billed but not recognized for an activity?” This is an important measure for Sarbanes Oxley compliance because the amount of revenue billed may not always be recognized as revenue until payment is received. |
|
Services Revenue Amount |
Services revenue amount. Use this fact to answer questions such as “How much services revenue is associated with an activity?” |
|
Revenue Recognized Amount |
Revenue recognized amount. Use this fact to answer questions such as “How much revenue is recognized for an activity?” This fact helps you determine how much revenue has been booked to GL, but not yet collected. This is an important measure for Sarbanes Oxley compliance. |
|
Priced Amount |
Priced amount. Use this fact to answer questions such as “What is the current priced amount for a resource item?” This is related to the billing status for a resource item. |
|
Not Priced Amount |
Not priced amount. Use this fact to answer questions such as “Which cost rows in the PROJ_RESOURCE table have not been previously associated to a contract line or rate template?” |
|
Costed Amount |
Costed amount. Use this fact to answer questions such as “What is the cost of an item prior to determining the markup or margin, for example Cost = Pay Rate + Fixed Cost + Workers Compensation Cost?” |
|
Priced Not Recognized Amount |
Priced not recognized amount. Use this fact to answer questions such as “What priced amount has not yet been booked to GL and has not yet been collected?” |
|
Remain To Bill Amount |
Remain-to-bill amount. Use this fact to answer questions such as “What is the total amount to bill minus the amount already billed (billed amount)?” |
|
Unbilled Costs Amount |
Unbilled costs amount. Use this fact to answer questions such as “Which costs have currently not been billed in the billing or accounts receivable system?” |
|
Billed Amount |
Billed amount. Use this fact to answer questions such as “Which costs have currently been billed in the billing or accounts receivable system?” |
|
Retained Amount |
Retained amount. Use this fact to answer questions such as “What is the retained amount for an activity that has a voucher contract with retention rules defined?” |
|
AP Expense Received Not Transmitted Amount |
An expense that has been received from AP into Expense, but not transmitted from a third-party electronic funds transfer vendor, such as VISA or American Express. |
|
Actual Cost of Work Performed Amount |
Actual Cost of Work Performed (ACWP) is the actual cost of the activity as of the current date. Use this fact to answer questions such as “What is the actual cost for an activity?” |
|
Budget Cost of Work Scheduled Amount |
Budgeted Cost of Work Scheduled (BCWS) is the planned cost of the activity that should have been completed to date. Use this fact to answer questions such as “What is the planned cost for an activity that should have been completed to date?” |
|
Budgeted Cost of Work Performed (earned value) Amount |
Budgeted Cost of Work Performed (BCWP) is the budgeted cost of the activity. If the activity is complete, then this amount is the total amount budgeted for the activity. If this activity is not complete, then it is the total amount budgeted for the activity multiplied by the percent complete. Use this fact to answer questions such as “What is the current budgeted cost for the work completed on an activity?” |
|
Cost Variance Amount |
Difference between planned and actuals costs for completed work (BCWP − ACWP). Use this fact to answer questions such as “By what amount is my activity overrunning or under running its estimated cost?” |
|
Schedule Variance Amount |
Difference between the value of the work that was planned for completion and the value of the work that was actually completed. It uses cost values to measure schedule performance (BCWP − BCWS). Use this fact to answer questions such as “What is the difference in the amount of work that should have been completed in a period versus the work actually completed for a given activity?” |
Project − Project (Current and Periodic) Fact Table
The Project (Current and Periodic) fact table maintains project measures.
With this fact group, you can answer questions such as “What is the actual cost of work performed for this project?”, “What is the budgeted cost of worked scheduled for this project?” and “What is the budgeted cost of work performed for this project?”
See PeopleSoft Setting Up Procurement Options PeopleBook: Using Voucher and Order Contracts
This table describes the facts in the Project (Current and Periodic) fact table:
|
Fact |
Fact Description |
|
Complete Percent |
Project's percent complete. Use this fact to answer questions such as “What is the percent complete for a particular project?” |
|
Duration Hours |
Project's duration in hours. Use this fact to answer questions such as “How many days will a project take to complete?” |
|
Budget Hours |
Number of hours budgeted for the activity. Use this fact to answer questions such as “What is the comparison of budget to actual work hours?” |
|
Actual Hours |
Number of actual hours. Use this fact to answer questions such as “How many hours did it actually take to complete an project?” |
|
Unbilled Labor Hours |
Number of unbilled labor hours. Use this fact to answer questions such as “How many unbilled labor hours are associated with a project?” |
|
Billed Hours |
Number of billed hours. Use this fact to answer questions such as “How many billed hours are associated with project?” |
|
Actuals Amount |
Activity actuals to date. Use this fact to answer questions such as “What is the comparison of actual to budget amounts for an activity?” |
|
Budget Amount |
Project’s budgeted amount. Use this fact to answer questions such as “What is the comparison of actual to budget amounts for an activity?” |
|
Revenue Amount |
Revenue to date. Use this fact to answer questions such as “What is the comparison of actual to budgeted amounts for a project?” |
|
Revenue Billed Not Recognized Amount |
Revenue billed not recognized amount. Use this fact to answer questions such as “How much revenue is billed but not recognized for a project?” |
|
Services Revenue Amount |
Services revenue amount. Use this fact to answer questions such as “How much services revenue is associated with a project?” |
|
Revenue Recognized Amount |
Revenue recognized amount. Use this fact to answer questions such as “How much revenue is recognized for a project?” |
|
Priced Amount |
Priced amount. Use this fact to answer questions such as “What is the current priced amount for a resource item?” This is related to the billing status for a resource item. Possible status codes include: D (done), I (ignore), N (not distributed), P (priced), U (unbillable or non-billable), and W (billing worksheet). |
|
Not Priced Amount |
Not priced amount. Use this fact to answer questions such as “Which cost rows in the PROJ_RESOURCE table have not been previously associated to a contract line or rate template?” |
|
Costed Amount |
Costed amount. Use this fact to answer questions such as “What is the cost of an item prior to determining the markup or margin, for example, Cost = Pay Rate + Fixed Cost + Workers Compensation Cost?” |
|
Priced Not Recognized Amount |
Priced not recognized amount. Use this fact to answer questions such as “What priced amount has not yet been booked to GL and has not yet been collected?” |
|
Remain To Bill Amount |
Remain-to-bill amount. Use this fact to answer questions such as “What is the total amount to bill minus the amount already billed?” |
|
Unbilled Costs |
Unbilled costs amount. Use this fact to answer questions such as “Which costs have currently not been billed in the billing or accounts receivable system?” |
|
Billed Amount |
Billed amount. Use this fact to answer questions such as “Which costs have currently been billed in the billing or accounts receivable system?” |
|
Retained Amount |
Retained amount. Use this fact to answer questions such as “What is the retained amount for an activity that has a voucher contract with retention rules defined?” |
|
AP Expense Received Not Transmitted Amount |
An expense that has been received from AP into Expense, but not transmitted from a third-party electronic funds transfer vendor, such as VISA or American Express. |
|
Budget Cost of Work Scheduled Amount |
Planned cost of the project activities that should have been completed to date. Use this fact to answer questions such as “What is the planned cost for a project that should have been completed to date?” |
|
Budgeted Cost of Work Performed (earned value) Amount |
Budgeted cost of the completed project activities. Use this fact to answer questions such as “What is the current budgeted cost for the work completed on an activity?” |
|
Cost Variance Amount |
Difference between planned and actuals costs for completed work (BCWP − Actuals Amount). Use this fact to answer questions such as “By what amount is my activity overrunning or under running its estimated cost?” |
|
Schedule Variance Amount |
Difference between the value of the work that was planned for completion and the value of the work that was actually completed. It uses cost values to measure schedule performance (BCWP − BCWS). Use this fact to answer questions such as “What is the difference in the amount of work that should have been completed in a period versus the work actually completed for a given activity?” |
|
Project Estimate At Completion Amount |
Project Estimate at Completion (EAC) is a reestimate of the total project budget. EAC = original budget X (Actuals Amount /BCWP). Use this fact to answer questions such as “Taking into account actual costs to date, work completed, and the budgeted costs of work outstanding, what is the latest estimate for the final cost of an ongoing project?” |
Project − Project Deliverable Fact Table
The Project Deliverable fact table maintains project deliverable information.
With this fact group, you can answer questions such as “What is the average number of deliverables per project?”
This table describes the fact in the Project Deliverable fact table:
|
Fact |
Fact Description |
|
Deliverable Count |
Number of project deliverables. Use this fact to answer questions such as “What is the deliverables count by project, project activity, deliverable status, or employee?” |
Project − Project Issue Fact Table
The Project Issue fact table maintains information about project issues. Project issues may be optionally related to a project activity.
With this fact group, you can answer questions such as “What is the average number of issues per project?”
This table describes the fact in the Project Issue fact table:
|
Fact |
Fact Description |
|
Issue Count |
Number of project issues. Use this fact to answer questions such as “What is the issue count by project, project activity, issue type, issue status, issue priority, or employee?” |
Project − Project Change Fact Table
The Project Change fact table maintains project change control information.
With this fact group, you can answer questions such as “What is the average number of changes per project?”
This table describes the fact in the Project Change fact table:
|
Fact |
Fact Description |
|
Change Count |
Number of project changes. Use this fact to answer questions such as “What is the change count by project, project activity, change type, change reason, user, or employee?” |
Proposal and Grant − Proposal and Grant Transaction Detail Fact Table
The Proposal and Grant Transaction Detail fact table captures the information relating to proposals and grants. For proposals it captures the different versions of project proposals created for business opportunities.
For grants it captures information relating to proposals, budgets, administrative, personnel, and submission information required by funding agencies.
With this fact group, you can answer questions such as “What is the average estimated margin percentage for all proposals?”, “What percentage of proposals were won?” and “What is the proposal pipeline?”
This table describes the facts in the Proposal and Grant Transaction Detail fact table:
|
Fact |
Fact Description |
|
Conversion Confidence Percent |
Indicator of the level of confidence that the proposal will be approved. It is a number between 1 and 100. Use this fact to answer questions such as “What is the probability that a proposal will be approved?” |
|
Expense Margin Percent |
Difference between the proposed amount and the cost amount for expense (proposed amount - cost amount/proposed amount). It is a profitability indicator for the expense spent on a particular project task. |
|
Labor Margin Percent |
Difference between the proposed amount and the cost amount for time (proposed amount - cost amount/proposed amount). It is a profitability indicator for the time/labor spent on a particular project task. |
|
Number of Hours |
Total number of hours that the people assigned to a project role are expected to work. Use this fact to answer questions such as “For a given project role, how many work hours are required?” |
|
Number of Weeks |
Total number of weeks that the people assigned to a project role are expected to work. Use this fact to answer questions such as “For a given project role, how many work weeks are required?” |
|
Number of Days |
Total number of days that the people assigned to a project role are expected to work. Use this fact to answer questions such as “For a given project role, how many work days are required?” |
|
Number of People |
Number of people who will work on an activity in a particular project role. Use this fact to answer questions such as “For a given project role, how many people are required?” |
|
Revenue Forecast Amount |
Total bill amount to be charged for the time/labor and expense spent on a particular project role of a proposal version. Use this fact to answer questions such as “For a given project role, how much revenue is anticipated?” |
|
Labor Forecast Amount |
The total labor cost expected to be incurred on a particular project role of a proposal version. Use this fact to answer questions such as “For a given project role, what are the anticipated labor costs?” |
|
Expense Forecast Amount |
The total expenses cost expected to be incurred on a particular project role of a proposal version. Use this fact to answer questions such as “For a given project role, what are the anticipated total expenses?” |
Resources − Assignment Fact Table
The Assignment fact table represents information about assignments. Assignments pair a resource with a unit of work.
With this fact group, you can answer questions such as “What is the average length of an assignment?” and “What is the average billing rate for an assignment?”
This table describes the facts in the Assignment fact table:
|
Fact |
Fact Description |
|
Scheduled Hours |
Scheduled hours for the assignment detail. Use this fact to answer questions such as “How many hours are scheduled against a particular assignment?” |
|
Employee Bill Rate |
Assigned employee bill rate. Use this fact to answer questions such as “What is the bill rate for an employee associated with an assignment?” |
|
Employee Cost Rate |
Assigned employee cost rate. Use this fact to answer questions such as “What is the cost rate for an employee associated with an assignment?” |
|
Project Role Bill Rate |
Project role bill rate. Use this fact to answer questions such as “What is the bill rate for the project role associated with an assignment?” |
|
Project Role Cost Rate |
Project role cost rate. Use this fact to answer questions such as “What is the cost rate for the project role associated with an assignment?” |
Resources − Employee Forecast Fact Table
The Employee Forecast fact table presents information about employee forecasts.
With this fact group, you can answer questions such as “What is the revenue forecast for my organization in this period?” and “What is the forecast utilization for my organization in this period?”
This table describes the facts in the Employee Forecast fact table:
|
Fact |
Fact Description |
|
Forecast Rate |
Forecast rate. This rate is the jobcode, project role, or employee rate, depending on the project's forecast rate method. Use this fact to answer questions such as “What is the total forecast amount?” |
|
Total Hours |
Total hours that a person is expected to work. Use this fact to answer questions such as “How many hours is an employee forecasted to work on a given project?” |
Resources − Resource Rate Fact Table
The Resource Rate fact table maintains resource actuals, employee, and job code rates. It enables analysis across different rates.
With this fact group, you can answer questions such as “What is a resource’s actual rate versus bill rate?”
This table describes the facts in the Resource Rate fact table:
|
Fact |
Fact Description |
|
Actual Hours |
Actual number of hours spent by a resource on an activity. It is captured in PROJ_RESOURCE at the project activity resource detail from various sources including PeopleSoft Expenses and PeopleSoft Time and Labor. Actual work at the activity level is calculated by rolling up the detailed actual rows. Use this fact to answer questions such as “How many hours did it actually take to complete an activity?” |
|
Actual Amount |
Actual cost of work performed by a resource on an activity. Use this fact to answer questions such as “What was the cost of a resource? |
|
Actual Rate |
Actual hourly bill rate, calculated as actual amount/actual hours. Use this fact to answer questions such as “For a given project, how does the actual rate paid to an employee compare to the employee’s standard bill rate, job code rate, and project role rate?” |
|
Employee Bill Rate |
Standard employee bill rate. Use this fact to answer questions such as “How does the employee standard bill rate compare to the actual rate, job code rate, and project role rate for a given project activity?” |
|
Employee Cost Rate |
Standard employee cost rate. Use this fact to answer questions such as “For a particular customer, how does the employee standard cost rate compare to the actual bill rate?” |
|
Job Code Bill Rate |
Job code bill rate. Use this fact to answer questions such as “For a particular project, how does the actual bill rate compare to the job code bill rate?” |
|
Job Code Cost Rate |
Job code cost rate. Use this fact to answer questions such as “For a particular project, how does the employee cost rate compare to the job code cost rate?” |
|
Project Role Bill Rate |
Project role bill rate. Use this fact to answer questions such as “For a particular project, how does the actual bill rate compare to the project role bill rate?” |
|
Project Role Cost Rate |
Project role cost rate. Use this fact to answer questions such as “For a particular project activity, how does the project role cost rate compare to the job code cost rate?” |
Resources − Service Order Fact Table
The Service Order fact table maintains information about service orders (SOs). SOs submit, track, and fulfill requests for services from external or internal customers. A SO defines the required services for a project and specifies the criteria that the application uses to locate the appropriate resources.
With this fact group, you can answer questions such as “What is the average number of days requested on a service order?” and “What is the total number of resource requests in days?”
This table describes the facts in the Service Order fact table:
|
Fact |
Fact Description |
|
Resource Quantity |
Resource quantity for the service order line. Use this fact to answer questions such as “How many resources are required?” |
|
Estimated Days |
Estimated number of days for the service order line. Use this fact to answer questions such as “How many days are estimated for all service orders associated with a contract?” |
|
Period Days |
Period day number for the service order line. Use this fact to answer questions such as “How many period days are associated with a service order?” |
|
Project Role Bill Rate |
Project role bill rate. Use this fact to answer questions such as “What is the average project role bill rate for all service orders related to a project?” |
|
Project Role Cost Rate |
Project role cost rate. Use this fact to answer questions such as “What is the average project role cost for service orders associated with a particular contract?” |
Expense − Time Report Daily Detail Fact Table
The Time Report Daily Detail fact table stores information relating to a person’s time report entry. It captures the related accounting information and associated hours. The details are captured at a day level.
With this fact group, you can answer questions such as “What is the average number of billable hours entered in a period?” and ”What is the resource utilization of my organization in a period?”
This table describes the fact in the Time Report Daily Detail fact table:
|
Fact |
Fact Description |
|
Time Report Hours |
The number of hours that a person entered for a given day. Use this fact to answer questions such as “What is the ratio of policy to billable hours for an employee during a given period? |
Expense − Expense Distribution Transaction Detail Fact Table
The Expense Distribution Transaction Detail fact table stores information relating to expense transactions and captures the related accounting information and associated amounts.
With this fact group, you can answer questions such as “What is the average cost of an expense type, such as a hotel stay?”, “What is the maximum amount spent on an expense type?”, “What is the average number of nights spent in a hotel?” and “What is the total number of passengers for an expense type in a period?”
This table describes the facts in the Expense Distribution Transaction Detail fact table:
|
Fact |
Fact Description |
|
Expense Transaction Amount |
The amount of expense incurred by employee. Use this fact to answer questions such as “What is the average hotel expense amount for employees on a project?” |
|
Number of Nights |
Number of nights pertaining to a particular expense line allocated to a distribution level based on expense transaction amount. Use this fact to answer questions such as “What is the number of nights associated with an expense distribution level?” |
|
Number of Passengers |
Number of passengers pertaining to a particular expense line allocated to a distribution level based on expense transaction amount. Use this fact to answer questions such as “What is the number of passengers associated with an expense distribution level?” |
Expense − Expense Report Approval Fact Table
The Expense Report Approval fact table contains information relating to an expense report’s approval and captures information relating to approvers, types, and approval dates.
With this fact group, you can answer questions such as “How long on average does it take for an expense report to be approved?”, “Which approvers are taking the most time to approve expense reports?” and “How many expense approvals are being done in a period?”
This table describes the fact in the Expense Report Approval fact table:
|
Fact |
Fact Description |
|
Expense Report Approval Count |
Number of expense report approvals. Use this fact to answer questions such as “How many expense reports are associated with a particular employee by status?” |
Contracts − Contract Transaction Detail Fact Table
The Contract Transaction Detail fact table stores information relating to a contract line and captures the contract terms and revenue metrics. The metrics are at the contract line level of detail.
With this fact group, you can answer questions such as “What is the average discount given on a contract line?”, “What is the largest or smallest discount given on a contract?” and “What is the total discount given on all contract lines?”
This table describes the facts in the Contract Transaction Detail fact table:
|
Fact |
Fact Description |
|
Contract Line Gross Amount |
Amount at which the contract line is offered. It is defaulted from the list price, but you can override it at the contract line level. It is also known as the negotiated amount. Use this fact to answer questions such as “What is the minimum contract line gross amount for a particular contract, customer, or product?” |
|
Contract Line Net Amount |
Represents the current gross/negotiated amount minus any discounts and plus all non-inclusive prepaids of a contract line. Use this fact to answer questions such as “What is the maximum contract line net amount for a particular contract, customer, or product?” |
|
Contract Line List Price |
Represents the current gross/negotiated amount minus any discounts and plus all non-inclusive prepaids of a contract line. Use this fact to answer questions such as “What is the average contract line list amount for a particular contract, customer, or product?” |
Contracts − Contract Distribution Transaction Detail Fact Table
The Contract Distribution Transaction Detail fact table stores information relating to accounting distributions of a contract line.
With this fact group, you can answer questions such as “What is the average amount allocated to a given combination of PeopleSoft General Ledger ChartFields?” and “What is the total amount allocated to a given combination of PeopleSoft General Ledger ChartFields?”
This table describes the fact in the Contract Distribution Transaction Detail fact table:
|
Fact |
Fact Description |
|
Contract Distributed Amount |
Depending on the distribution use, this amount represents the allocated gross amount to a combination of PeopleSoft General Ledger ChartField values, or the discount amount allocated to the different distribution codes in the financial system, or the deferred revenue post to general ledger revenue that can be realized in a future accounting period (that amount across the distribution sets). Use this fact to answer questions such as “What is the average amount allocated to a given combination of PeopleSoft General Ledger ChartFields?” |
Contracts − Contract Revenue Recognition Fact Table
The Contract Revenue Recognition fact table contains revenue recognized and reversed accounting entries for a contract line.
With this fact group, you can answer questions such as “What is the total revenue amount recognized during a period?”
This table describes the facts in the Contract Revenue Recognition fact table:
|
Fact |
Fact Description |
|
Contract Revenue Amount |
Depending on the distribution use, this amount represents the booked amount in the general ledger as revenue earned, or the discount given, or the deferred revenue on a contract for a particular accounting period and distribution set. Use this fact to answer questions such as “What is the revenue earned from a given customer?” |
|
Deferred Revenue Age in Days |
Number of accounting days between the current deferred accounting entry date and the first accounting entry date for a particular contract line. Use this fact to answer questions such as “What is the average deferred revenue age for a given customer?” |
Contracts − Contract Amendment Fact Table
The Contract Amendment fact table contains the change in the obligations and entitlements of a contract. The negotiated and discount amount changes are at the contract level.
With this fact group, you can answer questions such as “What is the total amount attributed to contract amendments in a period?” and “What is the average percent increase due to contract amendments?”
This table describes the facts in the Contract Amendment fact table:
|
Fact |
Fact Description |
|
Contract Amendment Gross Change Amount |
Change in the gross/negotiated amount of a contract due to an amendment. Use this fact to answer questions such as “What is the average gross amendment change for a given contract or customer?” |
|
Contract Amendment Discount/Surcharge Change Amount |
Change in the discount and surcharge applicable to a contract because of an amendment. Use this fact to answer questions such as “What is the maximum discount and surcharge amendment change for a given contract or customer?” |
|
Contract Amendment Absolute Gross Change Amount |
Total change in gross/negotiated amount. This fact ignores the sign of the amount. Use this fact to answer questions such as “What is the total gross/negotiated change for a given contract or customer?” |
|
Contract Amendment Absolute Discount/Surcharge Change Amount |
Total change in discount and surcharge amount. This fact ignores the sign of the amount. Use this fact to answer questions such as “What is the total discount and surcharge for a given contract or customer?” |
Contracts − Contract Forecast (Current and Periodic) Fact Table
The Contract Forecast (Current and Periodic) fact table captures the current and trend of revenue backlog for both fixed-fee and rate-based contract lines and the probability percentage of the revenue forecast.
With this fact group, you can answer questions such as “What is the percentage change over time for a contract revenue forecast?” and “What is the current total contract revenue forecast for a period?”
This table describes the facts in the Contract Forecast (Current and Periodic) fact table:
|
Fact |
Fact Description |
|
Contract Forecast Amount |
Projected revenue of a contract line for future accounting periods. Use this fact to answer questions such as “What is the total forecast revenue for a given contract, customer, product, or period?” |
|
Contract Forecast Probability |
Captures the confidence level of the revenue forecast. Use this fact to answer questions such as “What is the probability associated with our forecasted contract revenue?” |
|
Contract Forecast Amount |
Projected revenue of a contract line for future accounting periods. Use this fact to answer questions such as “What is the total forecast revenue for a given contract, customer, product, period?” |
|
Contract Forecast Probability |
Confidence level of the revenue forecast. Use this fact to answer questions such as “What is the total discount and surcharge for a given contract or customer?” |
Contracts − Contract Renewal Fact Table
The Contract Renewal fact table contains the contract renew amount and percentage increase over the different contracts for different renewal cycles.
With this fact group, you can answer questions such as “What is the average percentage increase in contract renewals?” and “What is the total amount attributed to contract renewals for a period?”
This table describes the facts in the Contract Renewal fact table:
|
Fact |
Fact Description |
|
Contract Gross Renewal Amount |
Gross/negotiated amount at which the contract will be renewed in a particular period. Use this fact to answer questions such as “What is the total contract renewal amount for a given contract, customer, product?” |
|
Contract Renewal Percentage Increase |
Percentage increase in gross/negotiated amount between the old and the renewed contract. Use this fact to answer questions such as “What is the renewal percentage increase or decrease for a given contract, customer, product?” |
Real Estate MartReal Estate Mart enables real estate managers to monitor the operating expenses and operations of their real estate portfolio, understand rental rates by property, and optimize occupancy costs, space usage, and rental rates. With Real Estate Mart you can track work orders by originators, order type, or tenant; understand property and billing space usage; and identify trends in leasing operations. The analytics included in Real Estate Mart will help you to track occupancy costs and compare to plan or other properties, understand and compare property book values, monitor rental income streams, including subleases, and uncover average rental rates by building, property type, or business unit.
Asset Lifecycle Management Business Process
Real Estate Mart is related to PeopleSoft’s Asset Lifecycle Management business process.
The Asset Lifecycle Management business process fulfills your real estate organization's requirements for property acquisition and disposal, portfolio management, commercial management, and building management. With the Asset Lifecycle Management business process, you plan capital asset requirements, acquire assets through buying, building or leasing, prepare and deploy assets, utilize and maintain assets, retire assets, and evaluate asset performance. The Asset Lifecycle Management business process also helps with real estate development project management; contract management; lease management, billing and payments; property management; and building and space management. With this business process, you can analyze the profitability of your space, as well as manage customer financial relationships. The lease management and asset maintenance business processes help you determine answers to questions such as “What are my sales per square foot?”, “What are my nonrecoverable costs per square foot?” and “What is my portfolio exposure for a specific tenant?”
Property Management is the business sub-process related to Real Estate Mart; this business sub-process includes the activities required to create and maintain leases, manage lease changes, and manage lease billing and payments. Creating and maintaining leases fulfills your organization's requirements for capturing leasing terms and conditions. Managing lease changes involves checking for lease expirations, verifying occupancy, and monitoring billing changes. Managing billing includes capturing sales, billing rent and other charges, collecting payments, handling escalations, expense participation, sales overage rent, and security deposits. Managing payments includes monitoring, verifying and approving your organization’s outbound lease payments. Managing billing and payments helps you capture and confirm rental revenue, sales history, recoveries, escalated rent and percentage rent. The information captured as the result of billing activities helps you determine answers to questions such as “What are my sales per square foot for my anchor tenants?”, “What is my monthly rental revenue?” and “What are my collected recoverable expenses?”
Real Estate Delivered Fact TablesWith Real Estate Mart, PeopleSoft provides the following fact tables:
Area Master
Billing
Market Potential Renewal Rent
Tenant Sales History
Lease
The Area Master fact table contains all of the information about area of the property, building, floor, unit, and lease. With this fact group, you can answer questions such as “What is the total occupied square footage in my portfolio?” and “What is the total vacant square footage in a particular building?”
This table describes the fact in the Area Master fact table:
|
Fact Name |
Fact Description |
|
Area Square Footage |
The square footage of property, building, floor, or unit based on its area type defined in the Area Master. This fact helps you answer questions such as “How much square footage is in my portfolio, property, building, floor, or unit?” |
The Billing fact table contains all of the real estate management billing information. With this fact group, you can answer questions such as “ What is the average annual rent per square foot on a specific property?”
This table describes the facts in the Billing fact table:
|
Fact Name |
Fact Description |
|
Annual Rate Per Square Foot |
The annual billing amount divided by the square footage of the unit. With this fact, you can answer questions such as “What is my average annual rate per square foot on this property?” |
|
Units Rentable Area |
The tenant's gross occupied area on an entire floor in a building. This includes structural elements of a building such as columns, but does not include elements that penetrate the floor and ceiling such as elevators. This fact helps you answer questions such as “What amount of my rentable area is being billed?” |
|
Monthly Amount |
The total amount to be billed for a lease per month. This is an extract, transform, and load (ETL) calculated value . With this fact, you can answer questions such as “What is the billed revenue for my building in a specific month?” |
|
Expense Participation Adjust Class Exposure |
Total Expense Class Amount after adjusting for the class ceiling limitation prior to calculating the tenant’s prorated share. With this fact, you can answer questions such as “ What is a particular tenant’s adjusted class exposure for common area maintenance?” |
Market Potential Renewal Rent Fact Table
The Market Potential Renewal (MPR) Rent fact table contains information about market, potential and renewal rental rates. With this fact group, you can answer questions such as “What are my market rental rates for space used in retail, industrial or office?”
This table describes the fact in the MPR Rent fact table:
|
Fact Name |
Fact Description |
|
Rent Amount |
The actual rental amount. This can be potential, renewal, or market rent based on the Rent Type. With this fact, you can answer questions such as “What is the gross potential rent for my property?” |
Tenant Sales History Fact Table
The Tenant Sales History fact table contains all of the sales reporting information posted to the Sales History file. With this fact group, you can answer questions such as “Which sales categories are growing?”
This table describes the fact in the Tenant Sales History fact table:
|
Fact Name |
Fact Description |
|
Tenant Sales Amount |
Sales amounts are used to generate sales analysis reporting and to calculate sales overage billing. (Sales report history information is retained for 13 reporting periods per year.) This fact helps you answer questions such as “How do the sales of a specific tenant in a particular mall compare to that tenant’s sales in a different mall?” and “Are the sales of a particular tenant in line with the sales of a different tenant for the same product code?” |
The Lease fact table contains information on leases from the Real Estate Management application. With this fact group, you can answer questions such as “What percentage of my leases are rolling over?” and “What is the number of leases expiring in the next three months?”
This table describes the facts in the Lease fact table:
|
Fact Name |
Fact Description |
|
Area |
The square footage of space based on its Area Type from the Lease Master Detail. This fact answers questions such as “What is my total leased area for this building?” |
|
Term of Lease |
The length of lease in calendar months. This fact answers questions such as “What is my average lease term for this property?” |
Advanced Cost Accounting MartThrough Advanced Cost Accounting (ACA) Mart you can analyze profitability by cost objects and their related category codes. For example, you can view your profitability by customer (ship to or bill to), customer geographic region, product, or product line. Because Advanced Cost Accounting Mart includes the data in the ACA module of your application, it contains direct costs and indirect cost assignments that you have previously created.
With Advanced Cost Accounting Mart, you answer questions such as “Which customers are generating the most revenue and which are most profitable?”, “Which products yield the highest margins?” and “How is the contribution margin impacted by direct and indirect costs?” Advanced Cost Accounting Mart enables you to investigate these and other questions as they relate to the profitability of your products, customers, geographical regions, and business units.
Manage Performance and Profitability Business Process
PeopleSoft Manage Performance and Profitability business process assists organizations in actively managing the costs directly impacting product, customer, and channel profitability. Organizations focused on managing performance and profitability are able to deliver accurate cost information to improve visibility, strengthen accountability, and enable more informed decision-making, driving improved performance. The Advanced Cost Accounting module enables organizations to capture detailed cost information, generate detailed cost assignments, and analyze and evaluate profitability. The corresponding analytics module provides increased visibility down to the cost object level and enables comparison and trending information for channel, customer, and product profitability. The Manage Performance and Profitability business process helps you answer questions such as “Who are my most profitable customers?”, “What products provide the highest contribution margin?”, ”What channel consumes the most company resources?” and “What profitability trends exist across product lines, customers and channels?”
Advanced Cost Accounting Delivered Fact Tables
Advanced Cost Accounting Mart contains the following fact tables:
Cost Analyzer Balance
Driver Balance
Cost Analyzer Balance Fact Table
The Cost Analyzer Balance fact table provides information about the value of activity that has occurred within a specific period. This balance, which is stored at the cost object level, contains both direct costs and revenue, plus any assigned costs. With this fact group, you can answer questions such as “What is the revenue for this product for this period?” and “What are my overhead costs for this customer for this period?”
This table describes the fact in the Cost Analyzer Balance fact table:
|
Fact Name |
Fact Description |
|
Net Balance |
A number that represents the net amount posted during the accounting period. The application uses the accounting periods from the Company Constants table (F0010). The net amount posted is the total of all debits and credits, beginning with the first day of the period through the last day of the period. The Cost Analyzer Balances table captures all transactions and balances for activity-based costing, as well as managerial accounting, based on view definitions. With this fact, you can answer questions such as “What is the revenue for this product for this period?” and “What are my overhead costs for this customer for this period?” |
The Driver Balance fact table provides information about activity by business unit, as well as cost object information. The Driver Balance fact table enables you to understand profitability by product or product line. With this fact group, you can answer questions such as “What are my sales, general and administrative expense costs by product?”, “What products are most profitable?” and “How do direct costs compare as a percent of product revenue?”
This table describes the fact in the Driver Balance fact table:
|
Fact Name |
Fact Description |
|
Net Posting Amount |
A number that represents the net amount posted during the accounting period. The application uses the accounting periods from the Company Constants table (F0010). The net amount posted is the total of all debits and credits, beginning with the first day of the period through the last day of the period. The driver balance table captures driver balances based on driver definitions. With this fact, table, you can answer questions such as “What are my sales, and general and administrative costs by product?”, “What products are most profitable?” and “How do direct costs compare as a percent of product revenue?” |