
 CRM Warehouse Overview
This chapter provides an overview of the Customer Relationship Management (CRM) Warehouse, the CRM Warehouse structure, and the CRM Warehouse components.
CRM Warehouse OverviewPeopleSoft CRM Warehouse is a comprehensive reporting and analysis platform, which includes a Multi-Dimensional Warehouse (MDW) infrastructure for operational and near real-time reporting. It also contains packaged data marts that provide the multidimensional analysis of key performance metrics from CRM subject areas, such as marketing, sales, support, online marketing, multi-channel communications, and customer segment activities.
PeopleSoft delivers PeopleSoft CRM Warehouse complete with extract, transform, and load (ETL) maps, data models, data marts, and a library of key CRM metrics. PeopleSoft CRM Warehouse also includes the tools that enable you to modify or add to the predefined reporting content.
PeopleSoft CRM Warehouse enables you to identify opportunities to generate successful long-term customer relationships by integrating enterprise-wide information about customer behavior, business operations, and profitability,
PeopleSoft CRM Warehouse enables your organization to evaluate and optimize marketing, sales, and customer support activities. You can review the data against organizational metrics and perform strategic analyses to identify and track multiple dimensions that affect profitability, identify key performance drivers, trends and opportunities, determine cost-to-serve by customer, product, department, and channel, and so on.
Note. For details of dimensions, see the PDF file that is published on CD-ROM with your documentation.
Understanding the CRM Warehouse StructurePeopleSoft marts are subsets of PeopleSoft CRM Warehouse and are the foundation for the applications. Marts are subject-specific relational schemas created for a particular group of users for multidimensional analysis and reporting. Each core functional area of the warehouse has predefined marts.
The CRM warehouse is divided into four areas, or marts: Marketing, Sales, Service, and Customer Segment.
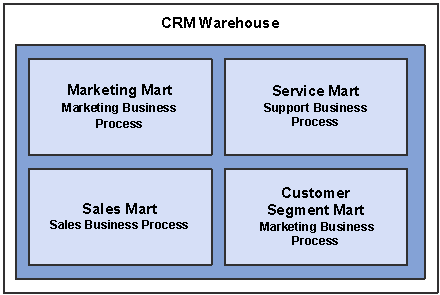
CRM Warehouse marts and business processes
Each mart is associated with a business process that helps you answer the questions you need to keep your organization robust and ahead of its competition. With each mart, PeopleSoft presents the associated business process and the fact tables that will help you answer your critical business questions.
Note. Although we list only the actual fact name, all facts that represent dollar amounts have three facts in the fact table, one
for each possible selected reporting currency. Populating the facts for alternate currencies is optional.
For additional details of facts, see the PDF file that is published on CD-ROM with your documentation.
This section discusses:
Marketing Mart
Service Mart
Sales Mart
Customer Segment Mart
Marketing MartMarketing Mart enables you to evaluate the effectiveness of marketing activities. Use it to analyze the number of leads generated, the number of clickthroughs, respondent profiles, lead qualification mechanisms, and program return on investment. The Marketing Mart helps you to understand which activities work and why, identify whom you are attracting, and how to improve the next program.
Marketing Mart includes the ability to analyze the effectiveness of online marketing efforts, in addition to traditional marketing activities. The Marketing Mart delivers comprehensive analysis of Marketing activities from the target of prospects through the close of sales. The Marketing Mart enables you to evaluate the effectiveness of all marketing activities for your target audiences across multiple marketing channels. With the Marketing Mart, you can tie back to sales activities and orders to the marketing program that originated the opportunities.
The Marketing Mart is related to PeopleSoft’s Marketing business process, which is also known as Customer Lifecycle Marketing business process. This is the process followed when developing marketing programs and activities. Marketers begin the cycle by analyzing historical and predictive data to determine their marketing strategy. Marketers can then plan marketing programs and related activities by allocating budgets, assigning teams and tasks, and scheduling the timing. Next, you execute these plans by designing and taking the programs live across multiple channels, including direct, online, and telemarketing, and converting prospects into leads and sales. Finally, closed loop reporting enables marketers to assess program performance both in real-time to make any required changes to maximize revenue opportunities, as well as post-program performance to measure its overall success.
Multiple business sub-processes are related to the Marketing Mart:
Marketing Mart reports help marketers with the Marketing Resource Management business sub-process to better manage marketing operations, such tracking budgets and expenses. In addition, all costs associated with a roll-up program are consolidated for a single view of how much the roll-up program cost, broken out by individual activities.
Marketing Mart reports provide insight into Cross-Sell Opportunity Identification business sub-process; the data can help you determine which products tend to be correlated so you can determine potential cross-sell opportunities.
You can also measure Program Performance business sub-process by examining the reach and response of your programs and activities across all channels: direct, telemarketing, and online. This can help you to determine channel effectiveness and identify successful programs that can be cloned and re-executed in the future.
Marketing Delivered Fact TablesWith the Marketing Mart PeopleSoft provides the following fact tables:
Marketing Activity
Product Affinity
Email Response
Repeat Email
Daily Email
All Response
Web Response
Repeat Web
Daily Web
Document Answer
Profile Choice
Email Performance
The Marketing activity fact table provides cost and time data for measuring the effectiveness and efficiency of a marketing program, program, and activity. With this fact group, you can answer questions such as “What is the return on investment (ROI) of my marketing activity?” and “ How effective is my marketing program?”
The fact data is a periodic snapshot captured at the marketing activity level.
This table describes the Marketing Activity fact table:
|
Fact Name |
Fact Description |
|---|---|
|
Budget Amount |
Amount of money budgeted for the marketing activity. This fact helps you answer questions such as “What is the amount of money budgeted for the marketing activity?” |
|
Total Cost |
Actual cost incurred after marketing activity design and execution. With this fact, you can answer questions such as “What is the total cost of this marketing program?” |
|
Closed Revenue |
Amount of money for the orders that are generated from the marketing program. With this fact, you can answer questions such as “How much revenue was created resulting from this marketing program?” |
|
Estimated Revenue |
Estimated revenue from the opportunities that are from the marketing activity. With this fact, you can answer questions such as “What is the estimated revenue to be generated by this marketing program?” |
|
Estimated Profit |
Difference between Estimated Revenue and Total Cost. With this fact, you can answer questions such as “What is the estimated profit to be generated by this marketing program?” |
|
Actual Profit |
Difference between Closed Revenue and Total Cost. With this fact, you can answer questions such as “What is the actual profit to be generated by this marketing program?” |
|
Number of Target Leads |
Targeted leads for the marketing activity. With this fact, you can answer questions such as “How many target leads are in this marketing program?” |
|
Number of Target Customers |
Number of customers targeted for the marketing program. With this fact, you can answer questions such as “How many target customers are in this marketing program?” |
|
Target Revenue |
Targeted revenue for the marketing activity. With this fact, you can answer questions such as “What is the target revenue for this marketing program?” |
|
Number of Leads |
Number of leads generated for the marketing activity. With this fact, you can answer questions such as “What is the actual number of leads generated by each marketing activity?” |
|
Number of Accepted Leads |
Number of leads that are accepted. With this fact, you can answer questions such as “What is the number of leads that have been accepted for this marketing activity?” |
|
Number of Opportunities |
Number of opportunities generated for the marketing activity. With this fact, you can answer questions such as “What are the number of opportunities generated by each marketing activity?” |
|
Number of Customers |
Number of customers that placed orders for the marketing activity. With this fact, you can answer questions such as “What is the number of customers that are generated by this marketing activity?” |
|
Number of Quotes |
Number of quotes generated for the marketing activity. With this fact, you can answer questions such as “What is the number of quotes for opportunities generated by this marketing activity?” |
|
Number of Orders |
Number of orders placed for the marketing activity. With this fact, you can answer questions such as “What is the number of orders for opportunities generated by this marketing activity?” |
|
Estimated Days |
Duration days estimated for the marketing activity. Estimated Days is the difference between Marketing Activity End date and Start date. With this fact, you can answer questions such as “What is the average number of estimated days for a specific marketing activity?” |
|
Actual Days |
Actual duration for the marketing activity. Actual Days is the difference between the last lead date generated from the activity and Marketing Activity Start date. With this fact, you can answer questions such as “What is the average number of actual days for a specific marketing activity?” |
|
Number of Responses |
Number of responses from a marketing activity. Response for sales force automation (SFA) marketing, telemarketing are the same as Total accepted leads. With this fact, you can answer questions such as “What is the number of responses generated by this marketing activity?” |
The Product Affinity fact table provides product correlation in a sales order that enables Market Basket analysis. This fact table provides insight into cross-selling opportunities. The fact data is derived from the sales order capture transaction at each product combination level. With this fact group, you can answer questions such as “Historically, what is the likelihood that a customer who purchases one product has purchased another specific product?”
This table describes the Product Affinity fact table fact:
|
Fact Name |
Fact Description |
|
Correlation Count |
Number of product correlations. This value is always 1 and is used for counting. With this fact, you can answer questions such as “What products are typically sold along with a specific product?” |
The Email Response fact table provides Email Responses per action (marketing activity) per dialog (marketing program). With this fact group, you can answer questions such as “How many emails have been sent out for each dialog action?”
The Email Response fact is an aggregated fact table.
This table describes the facts in the Email Response fact table:
|
Fact Name |
Fact Description |
|
Number of Contacts in List |
The number of contacts for each of the reach actions. With this fact, you can answer questions such as “How many audiences are there in this Online Marketing list?” |
|
Number of Duplicated |
The number of duplicate contacts that appear in more than one target audience for an external email reach action. With this fact, you can answer questions such as “How many audiences are contacted multiple times?” |
|
Number of Do Not Email |
The number of contacts in the email action who were marked in the database as “Do Not Email.” With this fact, you can answer questions such as “How many contacts don’t want to be contacted through email?” |
|
Number of Offered |
For email, the net number of emails sent after removing duplicates and “Do Not Email” contacts. With this fact, you can answer questions such as “How many audiences are contacted that have ‘Do not email’ option and were not duplicated?” |
|
Number of Bounced |
The number of contacts in the email action whose email bounced. With this fact, you can answer questions such as “How many emails were sent that were bounced back?” |
|
Number of Clickthroughs |
The actual number of times the specified link was clicked by a respondent. With this fact, you can answer questions such as” How many times was the specified link clicked?” |
|
Number of Responded |
The number of emails sent that generated responses. With this fact, you can answer questions such as “How many emails sent generated responses?” |
|
Number of Respondents |
The number of unique contacts from the target audience who clicked on at least on link. With this fact, you can answer questions such as ”How many people responded to the email?” |
The Repeat Email fact table provides repeat email responses per action per dialog. With this fact group, you can answer questions such as “How many repeating emails were sent that generated responses?”
The Repeat Email fact is an aggregated fact table.
This table describes the facts in the Repeat Email fact table:
|
Fact Name |
Fact Description |
|
Number of in List |
The number of contacts for each of the reach actions. With this fact, you can answer questions such as “How many audiences is in a specific online marketing list?” |
|
Number of Duplicated |
The number of duplicate contacts that appeared in more than one target audience for an external email reach action. With this fact, you can answer questions such as “How many audiences were contacted multiple times?” |
|
Number of Do Not Email |
The number of contacts in the email action who are marked in the database as “Do Not Email.” With this fact, you can answer questions such as “How many audiences marked ‘Do Not Email’ were contacted?” |
|
Number of Offered |
The net number of emails sent after removing duplicates and “Do Not Email” contacts. With this fact, you can answer questions such as “How many emails were offered that were not duplicates or ‘Do Not Email’?” |
|
Number of Bounced |
The number of contacts in the email action whose email bounced. With this fact, you can answer questions such as “How many emails were bounced back?” |
|
Number of Clickthroughs |
The actual number of times the specified link was clicked by a respondent. With this fact, you can answer questions such as “How many times was the specified link was clicked?” |
|
Number of Responded |
The number of emails sent that received a response. With this fact, you can answer questions such as “How many emails were sent that generated responses?” |
|
Number of Respondents |
The number of unique contacts from the target audience who clicked at least one link. With this fact, you can answer questions such as “How many people responded to the email?” |
The Daily Email fact table provides Email Responses per action per dialog. With this fact group, you can answer questions such as “How many daily emails were sent that generated a response?”
The Daily Email fact is an aggregated fact table.
This table describes the facts in the Daily Email fact table:
|
Fact Name |
Fact Description |
|
Number of Offered |
For email, the net number of emails sent after removing duplicates and “Do Not Email” contacts. With this fact, you can answer questions such as “How many emails were sent that were not duplicates or ‘Do Not Email’ contacts?” |
|
Number of Bounced |
The number of contacts in the email action whose email bounced. With this fact, you can answer questions such as “How many emails were sent that bounced back?” |
|
Number of Responded |
The number of emails sent that generated responses. With this fact, you can answer questions such as “How many emails were sent that received responses?” |
The All Response fact table provides a summary for email and Web page responses per action per dialog. With this fact group, you can answer questions such as “How many responses were received from emails and Web pages?”
The All Response fact table is an aggregated fact table.
This table describes the facts in the All Response fact table:
|
Fact Name |
Fact Description |
|
Number of in List |
The number of contacts for each of the reach actions. With this fact, you can answer questions such as “How many audiences are there in the online marketing list?” |
|
Number of Duplicated |
The number of duplicate contacts that appear in more than one target audience for an external email reach action. With this fact, you can answer questions such as “How many audiences were contacted multiple times?” |
|
Number of Do Not Email |
The number of contacts in the email action who were marked in the database as “Do Not Email.” With this fact, you can answer questions such as “How many audiences with ‘Do Not Email’ option were contacted?” |
|
Number of Offered |
For email, the net number of emails sent after removing duplicates and "Do Not Email" contacts. With this fact, you can answer questions such as “How many audiences are contacted that have ‘Do not email’ option and were not duplicated?” |
|
Number of Bounced |
The number of contacts in the email action whose email bounced. With this fact, you can answer questions such as “How many emails were sent that bounced back?” |
|
Number of Clickthroughs |
The actual number of times the specified link was clicked by a respondent. With this fact, you can answer questions such as “How many was the specified link in an email clicked?” |
|
Number of Responded |
The number of emails sent that generated responses. With this fact, you can answer questions such as “How many emails were sent that generated responses?” |
|
Number of Respondents |
The number of unique contacts from the target audience who clicked at least one link. With this fact, you can answer questions such as “How many people responded to this email?” |
|
Number of Responded Unknown |
The number of emails sent that responded unknown. With this fact, you can answer questions such as “How many people responded to the email that can not be identified?” |
The Web Response fact table provides Web page responses per action per dialog. With this fact group, you can answer questions such as “What are the responses for an online marketing Web page?”
The Web Response fact is an aggregated fact table.
This table describes the facts in the Web Response fact table:
|
Fact Name |
Fact Description |
|
Number of Visited Known |
The number of times that the Web page was requested by a known individual. With this fact, you can answer questions such as “How many visits to the Web page can be identified?” |
|
Number of Visited Unknown |
The number of times that the Web page was requested by an unknown individual. With this fact, you can answer questions such as “How many visits to the Web page can not be identified?” |
|
Number of Visitors |
The number of unique (non-duplicate) respondents from the target audiences who visited the Web page. With this fact, you can answer questions such as “How many visitors to the Web page can be identified?” |
|
Number Submitted Known |
The number of times that the Web page was submitted by a known individual. With this fact, you can answer questions such as “How many Web page submits can be identified?” |
|
Number Submitted Unknown |
The number of times that the Web page was submitted by an unknown individual. With this fact, you can answer questions such as “How many Web page submits can not be identified?” |
|
Number of Submitters |
The number of unique (non-duplicate) respondents from the target audience who submitted data on the Web page. With this fact, you can answer questions such as “What is the number of Web page submitters?” |
The Repeat Web fact table provides repeat Web page response per action per dialog. With this fact group, you can answer questions such as “How many people have visited the Web pages?”
The Repeat Web fact table is an aggregated fact table.
This table describes the facts in the Repeat Web fact table:
|
Fact Name |
Fact Description |
|
Number of Visited Known |
The number of times that the Web page was requested by a known individual. With this fact, you can answer questions such as “How many visits to the Web page can be identified?” |
|
Number of Visited Unknown |
The number of times that the Web page was requested by an unknown individual. With this fact, you can answer questions such as “How many visits to the Web page can not be identified?” |
|
Number of Submitted Known |
The number of times that the Web page was submitted by a known individual. With this fact, you can answer questions such as “How many Web page submits can be identified?” |
|
Number of Submitted Unknown |
The number of times that the Web page was submitted by an unknown individual. With this fact, you can answer questions such as “How many Web page submits can not be identified?” |
The Daily Web fact table provides daily Web page responses per action per dialog. With this fact group, you can answer questions such as “What is the number of daily Web page submits and visits?”
The Daily Web fact table is an aggregated fact table.
This table describes the facts in the Daily Web fact table:
|
Fact Name |
Fact Description |
|
Number Visited Known |
The number of times that the Web page was requested by a known individual. With this fact, you can answer questions such as “How many Web page visits can be identified?” |
|
Number Visited Unknown |
The number of times that the Web page was requested by an unknown individual. With this fact, you can answer questions such as “How many Web page visits can not be identified?” |
|
Number Submitted Known |
The number of times that the Web page was submitted by a known individual. With this fact, you can answer questions such as “How many Web page submits can be identified?” |
|
Number Submitted Unknown |
The number of times that the Web page was submitted by an unknown individual. With this fact, you can answer questions such as “How many Web page submits can not be identified?” |
The Document Answer fact table provides an answer choice for each Web page document per action per dialog. With this fact group, you can answer questions such as “What are the answer responses for a documented question that appeared online?”
This table describes the facts in the Document Answer fact table:
|
Fact Name |
Fact Description |
|
Number of Responses |
The number of responses from audience members to each question choice. With this fact, you can answer questions such as “How many responses were there to this documented question?” |
|
Number of Respondents |
The number of known audience members who responded to the question. With this fact, you can answer questions such as “How many people responded to the online questions?” |
The Profile Choice fact table provides an answer choice for each Web page profile question per action per dialog. With this fact group, you can answer questions such as “How many contacts responded to a particular Web page profile question?”
This table describes the facts in the Profile Choice fact table:
|
Fact Name |
Fact Description |
|
Number of Visits |
The number of times the Web page was requested. With this fact, you can answer questions such as “How many visits were there for this Web page?” |
|
Number of Visitors |
The number of unique (non-duplicate) respondents from the target audience who visited the Web page. With this fact, you can answer questions such as “How many visitors were there for this Web page?” |
|
Number Submitted |
The number of times that the Web page was submitted. With this fact, you can answer questions such as “How many submits were there for this Web page?” |
|
Number of Submitters |
The number of unique (non-duplicate) respondents from the target audiences who submitted data on the Web page. With this fact, you can answer questions such as “How many submitters were there for this Web page?” |
|
Number of Offers |
The number of times the document was sent. With this fact, you can answer questions such as “How many audiences are contacted through email?” |
|
Number of Clickthroughs |
The number of times the specified link was clicked by a respondent. With this fact, you can answer questions such as “How many clicks are on a specified link by a respondent?” |
|
Number of Respondents |
The number of unique contacts from the target audience who clicked at least one link. With this fact, you can answer questions such as “How many people responded to a Web link?” |
|
Number of Responses |
The number of responses from an audience who clicked at least one link. With this fact, you can answer questions such as “How many responses have there been from audiences?” |
|
Count |
The number of contacts that responded on any choice profile attributes. With this fact, you can answer questions such as “How many responses are there on a Web profile choice?” |
The Email Performance fact table provides data for an email dynamic content appearance per action per dialog. With this fact group, you can answer questions such as “How many contacts responded on a particular Web page link?”
The Email Performance fact table is an aggregated fact table.
This table describes the facts in the Email Performance fact table:
|
Fact Name |
Fact Description |
|
Number of Shown Known |
The number of times that a document containing a dynamic content object was sent to known individual audiences. With this fact, you can answer questions such as “How many times were documents sent to known audiences?” |
|
Number of Shown Unknown |
The number of times that the document containing the dynamic content objects was sent to unknown individual audiences. With this fact, you can answer questions such as “How many times were documents sent to unidentified audiences?” |
|
Number of Clicked Known |
The number of times that the specified link was clicked by a known individual respondent. How many times were document links clicked by a known respondent?” |
|
Number of Clicked Unknown |
The number of times that the specified link was clicked by an unknown individual respondent. With this fact, you can answer questions such as “How many times were document links clicked by an unknown respondent?” |
|
Number of Respondents |
The number of unique contacts from the target audience that clicked at least one link. With this fact, you can answer questions such as “How many times were document links clicked by an audience in the target list?” |
|
Number Offered |
The number of emails sent after removing duplicates and "Do Not Email" contacts. With this fact, you can answer questions such as “How many times was the document link offered?” |
|
Number Clicked |
The number of times the specified link was clicked by a respondent. With this fact, you can answer questions such as “How many times was the document link clicked by a respondent?” |
Sales MartSales Mart helps you analyze sales processes and evaluate the effectiveness of sales-related activities. Use it to examine pipeline status, forecasting accuracy, discount analysis, sales cycle time, and fallout analysis. Using historical measures of your sales processes helps you to provide opportunities for reducing cycle times within your sales activities.
The Sales Mart is related to the Sales business process, which is also called Collaborative Multichannel Selling business process. The Sales business fulfills an organization's requirements for discovering, managing, negotiating, and closing opportunities. This business process includes assigning leads and qualifying opportunities; proposing solutions and providing quotes; negotiating and closing the sales opportunities resulting in contracts, orders, or both; and managing pipelines, forecasts, and territories.
Sales managers monitor key performance metrics to gauge the overall effectiveness and efficiency of the sales force and to allocate resources across the territory structure to ensure adequate distribution of leads, opportunities and account coverage. Quote and proposal data provides additional insight into the details of future revenue streams and is used by sales managers to manage opportunity progression towards closure. Sales managers are responsible for monitoring individual and team performance and manage pipeline coverage and forecast data against quota levels at the individual sales representative, product, and summary levels.
There are two business sub-process related to the Sales Mart: Qualify to Close and Order to Cash. The Sales Mart addresses metrics related to both business sub-processes. The primary business sub-process that is most relevant to the sales manager role is Qualify to Close, which deals with the distribution of qualified sales leads, manages the conversion of leads into viable opportunities, and provides coaching and mentoring to the sales resources to maximize revenue generation for the organization.
A secondary business sub-process relevant for this role is Order to Cash, which is more directly related to the order capture and order management process. Sales managers that also manage this aspect of the overall sales process must monitor the ratio of opportunities to sales orders and the fulfillment of those orders through to collection and recognition of revenue. Order data provides additional information on source, product mix, discounting, and profitability metrics that provide insight into the overall effectiveness of the sales force. Sales managers use this information to adjust their strategy to maximize profitability and ensure that territories, and the resources that are allocated to those territories, are aligned properly.
Sales Delivered Fact TablesThe Sales Mart provides the following subject areas and fact tables:
Order Capture
Order Capture
Order Association
Quote and Quota
Product Quote
Sales Rep Quote
Sales Quota
Lead and Opportunity
Sales Lead
Opportunity
Opportunity Product
Order Capture − Order Capture Fact Table
The Order Capture fact table tracks data from source to destination. Orders are captured, enabling you to generate reports that tell you whether, for example, a sale is generated by a sales rep or partner, through which marketing activity the event occurred, or for which product and segment, and the respective business unit. With this fact group, you can answer questions such as “How many orders and how much revenue have I averaged per month?” and “How many recurring orders have I sold by customer, sales rep, or originating from a marketing activity?’
The fact data is an order line for each transaction.
This table describes the facts in the Order Capture fact table:
|
Fact Name |
Fact Description |
|
List Price |
The price per unit for calculating service charge. With this fact, you can answer questions such as “What is the list price for a product?” |
|
Quantity Ordered |
Quantity ordered by customer. With this fact, you can answer questions such as “What was the average quantity ordered for a product?” |
|
Recurring Price |
Price charged for recurring orders. With this fact, you can answer questions such as “What was the price of the periodic recurring charge for a product?” |
|
Recurring Frequency |
Frequency at which the recurring orders occur. With this fact, you can answer questions such as “ What is the frequency of the recurring charge for that instance of the product sale?” |
|
Ordered Price |
Actual price used in the order. With this fact, you can answer questions such as “What is the actual price used for an order?” |
Order Capture − Order Association Fact Table
The Order Capture fact table provides the association between an order and its source. These facts help you answer questions as to the effectiveness of your cross selling activities. With this fact group, you can answer questions such as “How many of these orders were generated from a lead, opportunity, and so on?”
The fact data is a transaction at each order association. That is, each order can be tied to each of the preceding business processes to analyze the effectiveness of strategic marketing and selling activities.
This table describes the facts in the Order Association fact table:
|
Fact Name |
Fact Description |
|
Order from Opportunity |
Number of orders originated through an opportunity. With this fact, you can answer questions such as “What is the number of orders that originated from this opportunity?” |
|
Order from Lead |
Number of orders originated through a lead. With this fact, you can answer questions such as “ What is the number orders originated through a particular lead?” |
|
Order Association Count |
Count of CRM transactions associated with an order. With this fact, you can answer questions such as “How many transactions are associated with this order?” |
|
Case Association with Service Order |
Count of cases associated with a particular service order. With this fact, you can answer questions such as “How many service orders are associated with a particular case?” |
|
Case Association with Returned Material Authorization (RMA) |
Count of cases associated with an RMA. With this fact, you can answer questions such as “How many RMAs are associated with a particular case?” |
Quote and Quota − Product Quote Fact Table
The Product Quote fact table contains metrics such as actual price and actual discount, which are used in sales quote analysis. These metrics are analyzed by dimensions such as Product and Time. With this fact group, you can answer questions such as “What is the average discount and selling price by product?”
Granularity is per Product per Quote.
This table describes the facts in the Product Quote fact table:
|
Fact Name |
Fact Description |
|
Product Quote Price |
The price that is offered to the customer by the sales rep for that specific quote, which may be different than the generally available price. With this fact, you can answer questions such as “What was the average quote price for a particular product?” |
|
Product Actual Discount Amount |
The discount the buyer is receiving for the given quote as an incentive to entice the buyer. With this fact, you can answer questions such as “What was the average discount for a particular product?” |
|
Quote Quantity |
Number of units of a specific product for which the buyer is receiving a quote. With this fact, you can answer questions such as “What is the quantity of product used for a set of quotes for that product?” |
|
Product Discount Counter |
The number of discounts per product per quote. With this fact, you can answer questions such as “How many discounts are there per quote?” |
|
Discount Flag |
Indicator of quote with discounts applied. With this fact, you can answer questions such as “Does this quote have a discount?” |
|
Product List Price |
List price for a product. With this fact, you can answer questions such as “What is the list price for this product?” |
|
Product Discount Price |
Discount price for this product. With this fact, you can answer questions such as “What is the discount price for this product?” |
Quote and Quota − Sales Rep Quote Fact Table
The Sales Rep Quote fact contains metrics such as actual price and actual discount, which are used in sales quote analysis. These metrics are analyzed by dimensions such as Sales Rep and Time. With this fact group, you can answer questions such as “What is the average discount and selling price by sales rep?”
Granularity is per Sales Rep per Quote.
This table describes the facts in the Sales Rep Quote fact table:
|
Fact Name |
Fact Description |
|
Sales Rep Actual Discount Amount |
The discount the buyer receives for the given quote as an incentive to entice the buyer. With this fact, you can answer questions such as “What is the amount of the discount offered to the customer by the sales rep?” |
|
Quote Count |
The number of quotes given for the product opportunity. With this fact, you can answer questions such as “What is the number of quotes for this particular product opportunity?” |
Quote and Quota − Sales Quota Fact Table
The Sales Quota fact table contains metrics used in measuring sales representative effectiveness by comparing the sales quota with the actual revenue achieved. These metrics are analyzed by dimensions such as Sales Territory, Forecast ID, and Time Frame.
With this fact group, you can answer questions such as ”How effective is my sales organization at attaining their individual quotas?”
Granularity is per Sales Rep per Forecast per Timeframe.
This table describes the facts in the Sales Quota fact table:
|
Fact Name |
Fact Description |
|
Quota Amount |
Amount of quota prescribed for a sales rep for a given time period. This quota is based on forward-looking estimates. With this fact, you can answer questions such as “What is the average quota amount for a sales person?” |
|
Opportunity Forecasted Revenue |
The revenue achieved if the sales quota is achieved. With this fact, you can answer questions such as “What is the total forecasted revenue amount in a sales timeframe?” |
|
Actual Revenue |
The actual revenue achieved by the sales rep. With this fact, you can answer questions such as “What is the actual revenue for a sales person in a sales timeframe?” |
Lead and Opportunity − Sales Lead Fact Table
The Sales Lead fact table provides measurements on lead duration and lead effectiveness. It contains metrics at the Lead ID level. These metrics are used for lead qualification and lead generation analysis and can be rolled up by dimensions such as Customer, Program, Sales Territory, and Marketing Channel. With this fact group, you can answer questions such as “What is my historical lead conversion rate?”
This table is an accumulated snapshot; each time a change is made to a lead, the existing row describing that lead is changed - but the Lead Date remains the same.
The granularity of this table is per Lead per Lead Date.
This table describes the facts in the Sales Lead fact table:
|
Fact Name |
Fact Description |
|
Number of Opportunities |
The number of opportunities that were generated out of a single lead. With this fact, you can answer questions such as “How many opportunities were generated from a lead?” |
|
Number of Orders |
The number of orders that were generated out of a single lead. With this fact, you can answer questions such as “How many orders were generated from a sales lead?” |
|
Lead to Opportunity Days |
The number of days the lead takes to become an initial opportunity. With this fact, you can answer questions such as “What is the average number of sales days from the start of a sales lead to a sales opportunity?” |
|
Lead to Sale Days |
The number of days the lead takes to become an initial sale. With this fact, you can answer questions such as “What is the average number of sales days from the start of a sales lead to a sales order?” |
|
Number of Quotes |
The number of quotes that were generated out of a single lead. With this fact, you can answer questions such as “What is the average number of quotes from a sales lead?” |
|
Number of Leads |
Number of leads generated. With this fact, you can answer questions such as “How many leads were generated?” |
|
Number of Customers |
Number of customers from a sales lead. With this fact, you can answer questions such as “How many customers were generated from this sales lead?” |
|
Lead Qualification Score |
The qualification score of a lead compared to the lead qualification goal to determine whether the lead is qualified. With this fact, you can answer questions such as “What is the average score of all qualified leads created in Q1 2005?” |
|
Lead Qualification Goal |
The qualification goal of a lead based on its selected qualification. |
Lead and Opportunity − Opportunity Fact Table
The Opportunity fact group provides pipeline analysis for measuring the effectiveness and efficiency of the sales force. With this fact group, you can answer questions such as “Historically, how long does an opportunity take to close?” and “What is the difference between the estimated and actual revenue recognition?”
The fact data is a snapshot captured at the Opportunity and Sales Rep grain level.
This table describes the facts in the Opportunity fact table:
|
Fact Name |
Fact Description |
|
Sales Rep Percent |
The percentage of an opportunity allocated to a specific sales rep. With this fact, you can answer questions such as “What is the revenue allocation percentage for a sales person?” |
|
Opportunity Score |
The qualification score of an opportunity is compared to the opportunity qualification goal to determine whether the opportunity is qualified. |
|
Opportunity Goal |
The qualification goal of an opportunity based on its selected qualification. |
|
Expected Revenue or Opportunity Potential Amount |
The potential amount of sales expected from the sales opportunity. With this fact, you can answer questions such as “What is the revenue expected from an opportunity?” and “What is the potential revenue from an opportunity?” |
|
Forecasted Revenue |
The revenue forecasted for the opportunity. With this fact, you can answer questions such as “What is the revenue forecasted for an opportunity?” |
|
Closed Revenue |
Amount of money from the sales orders that are generated from the opportunity. With this fact, you can answer questions such as “What is the order amount for an opportunity?” |
|
Estimated Opportunity to Sale Days |
The estimated number days for an opportunity to be converted into a sales order. With this fact, you can answer questions such as “How many days are estimated for an opportunity to generate an order?” |
|
Actual Opportunity to Sale Days |
Difference between Opportunity Closed date and Sales Order date. If multiple sales orders are generated from an opportunity, the calculation uses the smallest Sales Order date. With this fact, you can answer questions such as “How many days are required for an opportunity to generate an order?” |
|
Opportunity to Sale Days Accuracy |
Difference between Estimated and Actual Opportunity to Sales Days. With this fact, you can answer questions such as “What is the difference between actual opportunity sales days and estimated opportunity sales days?” |
|
Opportunity Confidence Percent or Probability Percent |
Probability or confidence percent of an opportunity. Zero percent indicates that it has lost business and 100 percent indicates that it has won business. With this fact, you can answer questions such as “What is the confidence percent for an opportunity?” |
|
Opportunity Budget Amount |
Amount of money budgeted for the opportunity. With this fact, you can answer questions such as “What is the total budget amount for all of the opportunities generated in a specific quarter?” |
|
Opportunity Weighted Revenue |
Opportunity forecasted revenue by confidence percent. With this fact, you can answer questions such as “What is the weighted revenue for a sales opportunity?” |
Lead and Opportunity − Opportunity Product Fact Table
The Opportunity Product fact table provides pipeline analysis by product or item. With this fact group, you can answer questions such as “Historically, how long does an opportunity take to close for a particular product?” and “What is the difference between the estimated and actual revenue recognition for a particular product?”
The fact data is a snapshot captured at the Opportunity and Product grain level.
This table describes the facts in the Opportunity Product fact table:
|
Fact Name |
Fact Description |
|
Probability Percent or Confidence Percent |
The probability or confidence percent of an opportunity. Zero percent indicates that it has lost business and 100 percent indicates that it has won business. With this fact, you can answer questions such as “What is the average confidence of the opportunity to generate an order?” |
|
Opportunity Qualification Score |
The qualification score of an opportunity used to compare to the opportunity qualification goal to determine whether the opportunity is qualified. With this fact, you can answer questions such as “What is the average score of all opportunities that the sales team has won in year 2004?” |
|
Opportunity Qualification Goal |
The qualification goal of an opportunity based on its selected qualification. |
|
Item Quantity |
The quantity potentially ordered for an item or product in an opportunity. With this fact, you can answer questions such as “What is the quantity for this product in the opportunity?” |
|
Item Actual Price |
The actual unit price for a line item in an opportunity. With this fact, you can answer questions such as “What is the actual price for the item in the opportunity?” |
|
Total Item Price |
The total price for a line item in an opportunity. With this fact, you can answer questions such as “What is the product item price in the opportunity?” |
|
Weighted Total Item Price |
The amount of total item price multiplied by the probability percent of the opportunity. With this fact, you can answer questions such as “What is the weighted product item price in the opportunity?” |
|
Probability Percent or Confidence Percent |
The probability or confidence percent of an opportunity. Zero percent indicates that it has lost business and 100 percent indicates that it has won business. With this fact, you can answer questions such as “What is the confidence percent for an opportunity?” |
|
Primary Product Flag |
Indicator that this product is a primary product. With this fact, you can answer questions such as “Is the product listed in the opportunity the primary product?” |
|
Reoccurring Frequency |
Number of times the product will be charged. With this fact, you can answer questions such as “How many times will the product be charged?” |
|
Recurring Price |
Recurring price. With this fact, you can answer questions such as “What is the price for the item that is a recurring charge?” |
|
Nonrecurring Price |
Nonrecurring price. With this fact, you can answer questions such as “What is the price for the item that is charge one time?” |
Service MartService Mart gives organizations the ability to analyze the effectiveness of their contact center by understanding call and case load trends, agent utilization, cost to support products and customers, up-sell and cross-sell success rates, product quality, and performance of service-level agreements. With this knowledge, organizations can lower the cost to serve, as well as increase service revenue, by maximizing each customer contact to provide the most effective service and generate service and sales revenue through targeted offers.
Service Mart helps you analyze all contact center activities, such as support activities, calls, cases, and resolutions, and test their effectiveness through various communication channels. Analysis of contact center communication channels in the context of CRM transactions provides insight into your organization’s ability to service your customer base. Use it to better understand product quality, call and case load trends, agent utilization, the cost to support products and customers, and performance to service level agreements.
Service Mart provides insight into PeopleSoft’s Support business process, which is also known as Integrated Service Management business process. This process follows the life span of a service incident, including revenue generation by way of offers. This business process also includes the process of reporting and resolving product defects and the analysis of contact center performance.
Service Mart provides insight into various stages of the Support business process, enabling an organization to improve business process efficiency through this knowledge.
Access, Resolve, and Recommend are the business sub-processes related to the Service Mart. The Access sub-process involves capture, entitle, and assign functions. The Resolve sub-process involves the search and resolve functions. The Recommend sub-process enables management to analyze offer success and loss rates and understand which offers are most effective.
Service Mart Delivered Facts
With the Service Mart, PeopleSoft provides the following fact tables:
Case
Case History
Case Association
Case Resolution
Solution
Entitlement
Case Survey
Call
Email Assignment
Chat
Interaction
The Case fact table provides cost and time data for measuring effectiveness and efficiency of a support case. With this fact group, you can answer questions such as “How many cases have been resolved on the first call for the past three months?”
The fact data is a current accumulated snapshot captured for each support case.
This table describes the Case fact table:
|
Fact Name |
Fact Description |
|
Case Count |
The value is 1 and is used for counting cases. This fact helps you answer questions such as “How many cases do I have?” |
|
Open Age |
If the case is not closed, Open Age is the amount of time (in minutes) since the case was created, until current. If the case is closed, Open Age is the amount of time since the case was created, until closed. With this fact, you can answer questions such as “How long has the case been open?” |
|
Closed Time |
Amount of time (in minutes) the case opened, until closed. If the case is not yet closed, the value is 0. This fact applies to closed cases only. With this fact, you can answer questions such as “How long does it take a case to close?” |
|
Responded Time |
Amount of time (in minutes) it took to respond to the case. If the case is not yet responded, the value is 0. With this fact, you can answer questions such as “How long does it take to respond to a case?” |
|
Open Case |
If the Case Status is “Open,” then the value is 1; otherwise, the value is 0. With this fact, you can answer questions such as “How many cases have an open status?” |
|
Opened Case |
If the case does not exist in case history, then the value is 1; otherwise, the value is 0. With this fact, you can answer questions such as “How many cases have been opened?” |
|
Closed Case |
If the Case Status is closed for the date, then the value is 1; otherwise, the value is 0. With this fact, you can answer questions such as “How many cases have a closed status?” |
|
Reopened Case |
If the Case Reopened Reason is not a space, then the value is 1; otherwise, the value is 0. With this fact, you can answer questions such as “How many cases have been reopened?” |
|
Resolved Case |
If the case is resolved, then the value is 1; otherwise, the value is 0. With this fact, you can answer questions such as “How many cases have been resolved?” |
|
Resolved First Contact |
If the case is resolved at the first contact, then the value is 1; otherwise, the value is 0. With this fact, you can answer questions such as “How many cases have been resolved on the first call?” |
|
Same Day Closed |
If the case close date is the same as the case created date, then the value is 1; otherwise, the value is 0. With this fact, you can answer questions such as “How many cases were closed on the same day?” |
|
Hot Case |
If the case has high priority category, then the value is 1; otherwise, the value is 0. With this fact, you can answer questions such as “How many cases have the highest priority?” |
|
Whiteboard Case |
If the case is a whiteboard case (a case created to represent a problem with multiple occurrences), then the value is 1; otherwise, the value is 0. With this fact, you can answer questions such as “How many cases are listed on the whiteboard with top priority?” |
|
Case Reassigned |
If the case has been assigned previously, then the value is 1; otherwise, the value is 0. With this fact, you can answer questions such as “How many cases were reassigned?” |
|
Case Escalated |
If the case priority has been changed, then the value is 1; otherwise, the value is 0. With this fact, you can answer questions such as “How many cases have been escalated?” |
|
Case Past Due Date |
If the current date is greater than target close date, then the value is 1; otherwise, the value is 0. With this fact, you can answer questions such as “How many cases are past the service level agreement due date?” |
|
Case with SLA |
If the case has a service level agreement (SLA), then the value is 1; otherwise, the value is 0 With this fact, you can answer questions such as “How many cases have a service level agreement?” |
|
Resolved Case with SLA |
Count of resolved cases in which SLA indicator is “Yes.” With this fact, you can answer questions such as “How many cases are resolved within the service level agreement?” |
|
Responded Within SLA |
Count of cases when responded within SLA indicator is “Yes.” With this fact, you can answer questions such as “How many cases that are responded have a service level agreement?” |
|
Number of Reassignments |
Number of reassignments for the case. With this fact, you can answer questions such as “What is the average number of case reassignments?” |
|
Number of Attempted Solutions |
Number of solutions attempted to solve the case. With this fact, you can answer questions such as “What is the average number of attempted solutions for a support case?” |
|
Straight Time Hourly Rate |
Agent’s provider group hourly rate on a straight time basis. With this fact, you can answer questions such as “What is the agent hourly rate on a straight time basis?” |
The Case History fact table contains the change history of each case life cycle from open to close. The fact data provides the basis of measurement on case reassignment and case escalation. With this fact group, you can answer questions such as “How long does it take to solve cases for this specific product?”
The fact record is captured whenever a case record is updated.
The facts in the Case History fact table are the same as in the Case fact table.
The Case Association fact table provides case association data between case and lead, order, service order, defect and script. With this fact group, you can answer questions such as “How many leads (or opportunities) were created through the contact center while supporting customers?”
The fact data is captured for each case.
This table describes the facts in the Case Association fact table:
|
Fact Name |
Fact Description |
|
Case Association Count |
The value is 1 and is used for counting case associations. The base for case association is Case ID and sequence number for each associated object. With this fact, you can answer questions such as “How many times is a case associated with other business processes, such as a case generating a sales lead or an order?” |
|
Case with Lead |
Measures the upsell capability. If the case is associated with a lead, the value is 1. If not, the value is 0. With this fact, you can answer questions such as “How many cases generated a sales lead?” |
|
Case with Order |
Measures the upsell capability. If the case is associated with an order, the value is 1. If not, the value is 0. With this fact, you can answer questions such as “How many cases generated an order?” |
|
Case with Service Order |
Measures the upsell capability. If the case is associated with a service order, the value is 1. If not, the value is 0. With this fact, you can answer questions such as “How many cases with service orders were generated?” |
|
Case with RMA |
If the case is associated with a RMA, the value is 1. If not, the value is 0. With this fact, you can answer questions such as “How many cases with an RMA were generated?” |
|
Case with Defect |
If the case is associated with a defect report, the value is 1. If not, the value is 0. With this fact, you can answer questions such as “How many cases were related to a product defect?” |
|
Case with Survey |
If the case is associated with a survey, the value is 1. If not, the value is 0. With this fact, you can answer questions such as “How many cases were followed with a customer survey?” |
The Case Resolution fact table provides the data for analyzing case resolution and agent-to-solution performance. With this fact group, you can answer questions such as “What is the average number of resolutions used to solve a case?”
The fact granularity is for each Resolution for each Case. This table describes the facts in the Case Resolution fact table:
|
Fact Name |
Fact Description |
|
Case Resolution Count |
Used for counting the number of resolutions. The value is 1. With this fact, you can answer questions such as “What is the average number of resolutions for a support case?” |
|
Resolved with Solution |
If the case resolution has a new solution created, the value is 1; otherwise, the value is 0. With this fact, you can answer questions such as “How many cases were resolved using solutions from the solution library?” |
|
Resolved with No Solution |
If the case is resolved without a solution, the value is 1; otherwise, the value is 0. With this fact, you can answer questions such as “How many cases were closed with no resolution?” |
The Solution fact table provides the usage and solved count for each solution in the contact center. The fact data also reflects the solutions submitted by an agent. With this fact group, you can answer questions such as “How many cases were solved with a particular solution?”
The fact data is an accumulated snapshot for each solution.
This table describes the facts in the Case Resolution fact table:
|
Fact Name |
Fact Description |
|
Usage Count |
Counter of how often the solution was selected in a search results page and marked as “Used.” With this fact, you can answer questions such as “How many times was a particular resolution used to solve a problem?” |
|
Solved Count |
Counter of how often the solution was selected to solve a case. With this fact, you can answer questions such as “How many times did the solution actually solve the problem?” |
The Entitlement fact table provides the entitlement data for a customer and product.
With this fact group, you can answer questions such as “What agreements and entitlements exist for my customers?”
The fact data is periodic snapshot captured for each entitlement.
This table describes the facts in the Entitlement fact table:
|
Fact Name |
Fact Description |
|
Entitlement Count |
Used for counting entitlements. The value is 1. With this fact, you can answer questions such as “How many entitlements were there for a specific customer and product?” |
|
Agreement Expire Days |
Represents the number of days before the agreement is expired. With this fact, you can answer questions such as “In how many days does a particular service agreement expire?” |
|
Agreement Renewal |
Current number of renewals for the entitlement. With this fact, you can answer questions such as “How many times was a particular service agreement renewed?” |
The Case Survey fact table provides the survey result from a customer support case. The data is used for measuring customer satisfaction. With this fact group, you can answer questions such as “How satisfied are our customers with the results of their cases?”
The fact transaction is captured for each survey script in each instance for each case.
This table describes the facts in the Case Survey fact table:
|
Fact Name |
Fact Description |
|
Survey Count |
Used for counting survey results. The value is 1. With this fact, you can answer questions such as “What is the number of customer surveys?” |
|
Script Weighted Value |
Weighted value for the script. With this fact, you can answer questions such as “What is the weight value for the survey script?” |
|
Rating Score |
The score used to determine the rating value. Rating score is the result of Total Score divided by Script Weighted Value. With this fact, you can answer questions such as “What is the score for the survey script?” |
The Call fact enables the measurement of a contact center’s call activity to improve upon the efficiency and effectiveness of the call center’s operations. The Call fact contains daily call and call segment activity that has been captured from computer telephone interface (CTI) or PeopleSoft CRM source systems. This fact table helps you answer questions such as “What is my average call volume for the month?”
This table describes the facts in the Call fact table:
|
Fact Name |
Fact Description |
|
Call Wait Time |
The time, in seconds, between the first appearance of a call in a call center and the first answer by a logged-in agent. With this fact, you can answer questions such as “What is the average wait time for customer calls?” |
|
Total Call Duration (Seconds) |
Total time, in seconds, of a call from initiation to termination. With this fact, you can answer questions such as “What is the average duration for customer calls?” |
|
Call Count |
The number of calls. This value is always equal to 1, as each call is unique. With this fact, you can answer questions such as “What is the average number of customer calls?” |
|
Agent Count |
Number of agent(s) assigned within a call. With this fact, you can answer questions such as “What is the average number of agents handling a customer call?” |
|
Number of Call Segments |
Number of call segments. With this fact, you can answer questions such as “How many call segments were there for the call?” |
|
Number of Inbound Calls |
Number of inbound calls. With this fact, you can answer questions such as “How many inbound calls were there for the day?” |
|
Number of Outbound Calls |
Number of outbound calls. With this fact, you can answer questions such as “How many outbound calls were there for the day?” |
|
Number of Conference Calls |
Number of conference calls. With this fact, you can answer questions such as “How many conference calls were there for the day?” |
|
Number of Internal Calls |
Number of internal calls. With this fact, you can answer questions such as “How many internal calls were there for the day?” |
|
Number of Queue Calls |
Number of queue calls. With this fact, you can answer questions such as “How many queued calls were there for the day?” |
|
Number of Transferred Calls |
Number of transferred calls. With this fact, you can answer questions such as “How many transferred calls were there for the day?” |
|
Number of Short Calls |
Number of short calls. With this fact, you can answer questions such as “How many short calls were there for the day?” |
|
Number of Abandoned Calls |
Number of calls abandoned by the caller, for example, when the caller hangs up while on hold. With this fact, you can answer questions such as “How many abandoned calls were there for the day?” |
|
IVR Calls (Internal Voice Response Calls) |
Number of IVR calls. With this fact, you can answer questions such as “How many internal voice response calls were there for the day?” |
|
Total Call Time (Seconds) |
Total call time. With this fact, you can answer questions such as “What was the total call time in seconds?” |
|
International Calls |
International calls. With this fact, you can answer questions such as “How many international calls were there for the day?” |
|
Internal Duration (Seconds) |
Internal duration. With this fact, you can answer questions such as “What is the internal call duration in seconds?” |
|
Outbound Duration (Seconds) |
Outbound duration. With this fact, you can answer questions such as “What is the outbound call duration in seconds?” |
|
First Ring Time (Seconds) |
First ring time. With this fact, you can answer questions such as “How long is the first ring time in seconds?” |
|
First Route Time (Seconds) |
First route time. With this fact, you can answer questions such as “How long is the first route time in seconds?” |
|
Call Conference Time (Seconds) |
Call conference time. With this fact, you can answer questions such as “How long is the total call conference time in seconds?” |
|
Call Queue Time (Seconds) |
Call queue time. With this fact, you can answer questions such as “How long is the total call queue time in seconds?” |
|
Call Transfer Time (Seconds) |
Call transfer time. With this fact, you can answer questions such as “How long is the total call transfer time in seconds?” |
|
Call Dial Time (Seconds) |
Call dial time. With this fact, you can answer questions such as “How long is the total call dial time in seconds?” |
|
Call Ring Time (Seconds) |
Call ring time. With this fact, you can answer questions such as “How long is the total call ring time in seconds?” |
The Email fact measures email volume, assignment activity, response time effectiveness, and template accuracy and utilization. This fact table includes Inbound Email, Recipient Email, Email Routing History, Email Relationship Management, Email History Natural Language Processing (NLP) Output (NLP Category Assignment), Assignment Scores, and Mailbox detail, which is stored in the Operational Warehouse Staging (OWS), to support access detail and populate the Multidimensional Warehouse (MDW). With this fact group, you can answer questions such as “How effective was our contact center in screening inbound email Spam messages last month?”
The Email fact table is an accumulated snapshot fact table. The fact grain is Email.
|
Fact Name |
Fact Description |
|
Inbound Email Count |
Number of inbound received emails derived from interaction method (flow). With this fact, you can answer questions such as “What is the total number of inbound emails to support customers?” |
|
Spam Email |
Number of inbound emails with a status of SPAM. With this fact, you can answer questions such as “What is the number of SPAM emails to support customers?” |
|
Outbound Email Count |
Outbound email count. With this fact, you can answer questions such as “What is the number of outbound emails?” |
|
Number of Closed Email |
Number of emails that have been closed by an agent sending an outbound email. With this fact, you can answer questions such as “How many emails are closed when supporting customers?” |
|
Past Due Date Email Count |
Assigned a value of 1 if Send Date on Recipient Email is greater than the Inbound Email Due Date. With this fact, you can answer questions such as “How many emails resolving customer cases are past the support due date?” |
|
Before Due Date Email Count |
Assigned a value of 1 if Send Date on Recipient Email is less than or equal to the Inbound Email Due Date. With this fact, you can answer questions such as “How many emails resolving customer cases were not past the support due date?” |
|
NLP Accuracy Count |
Assigned a value of 1 if the agent reassigns the category assigned by the NLP and the email is closed. With this fact, you can answer questions such as “How accurate is the National Language Process when handling emails?” |
|
NLP Assigned Score |
Score value that is captured when an assignment occurs from NLP. With this fact, you can answer questions such as “What is the score assigned by the National Language Process?” |
|
Email Score |
Score value that is captured when an agent performs an assignment. With this fact, you can answer questions such as “What is the score point for inbound email?” |
|
Number of Email Assignments |
Number of email assignments. With this fact, you can answer questions such as “How many times has the email been assigned?” |
|
Email Duration (Minutes) |
Email duration. With this fact, you can answer questions such as “How long did the email last?” |
The Email Assignment fact measures time from receipt to agent queue acceptance.
The fact grain is per assignment per Email.
This fact helps you answer questions such as “What is the average agent assignment for handling emails from customer who requested support?”
This table describes the facts in the Email Assignment fact table:
|
Fact Name |
Fact Description |
|
Assignment Count |
Assigned a value of 1 when an email has been assigned to an agent. With this fact, you can answer questions such as “What is the average assignment on email?” |
|
Duration (Minutes) |
Elapsed time an email spends in queue before assignment. With this fact, you can answer questions such as “What is the average time duration before an email is dealt with by an agent?” |
The Chat fact table measures agent load and volume of chat activity. With this fact group, you can answer questions such as “How many chats are related to a specific case?”
Chat fact grain is per Chat per Agent per Shift.
This table describes the facts in the Chat fact table:
|
Fact Name |
Fact Description |
|
Chat Count |
Number of chat sessions. With this fact, you can answer questions such as “How many chats were there for the day?” |
|
Number of Chats on a Case |
Number of chats on a case. With this fact, you can answer questions such as “How many chats are related to cases?” |
|
Number of Chats on an Order |
Number of chats on an order. With this fact, you can answer questions such as “How many chats are related to orders?” |
|
Chat Duration |
The elapsed time of a chat session based on chat’s date/time start and end. With this fact, you can answer questions such as “How long did the chat last?” |
The Interaction fact table provides a logical bridge linking email, chat, calls and an agent’s utilization or activity within each category to a related functional business object. It also provides insight into all customer interaction channels and their resulting transactions. With this fact group, you can answer questions such as “How many customer interactions were associated to this opportunity?”
This table describes the facts in the Interaction fact table:
|
Fact Name |
Fact Description |
|
Lead Interactions |
Number of lead interactions. Value is 1 for interaction linked to a Lead Object ID. This fact answers questions such as “What is the total number of customer interactions associated with a sales lead?” |
|
Case Interactions |
Number of case interactions. Value is 1 for interaction linked to a Case Object ID. This fact answers questions such as “What is the total number of customer interactions associated with a support case?” |
|
Opportunity Interactions |
Number of opportunity interactions. Value is 1 for interaction linked to an Opportunity Object ID. This fact answers questions such as “What is the total number of customer interactions associated with a sales opportunity?” |
|
Service Order Interactions |
Number of service order interactions. Value is 1 for interaction linked to a Service Order Object ID. This fact answers questions such as “What is the total number of customer interactions associated with a service order?” |
|
Capture (Order) Interactions |
Number of capture interactions. Value is 1 for interaction linked to a Capture (Order) Object ID. This fact answers questions such as “What is the total number of customer interactions associated with an order capture?” |
|
Interaction Duration |
Interaction duration. With this fact, you can answer questions such as “How long is the customer interaction?” |
|
Number of Calls |
Number of calls. With this fact, you can answer questions such as “How many calls were received during the day?” |
|
Number of Emails |
Number of emails. With this fact, you can answer questions such as “How many emails were received during the day?” |
|
Number of Chats |
Number of chats. With this fact, you can answer questions such as “How many chats were received during the day?” |
Customer Segment MartCustomer Segment Mart provides the analysis of customer behavior as a result of the activities of the CRM business processes. One of an organization’s goals is to manage a strategic segment of customers that are identified as having the potential for high value. There are many activities performed throughout the CRM business processes that influence the behavior of these desired segments.
Customer Segment Mart is part of PeopleSoft’s Marketing business process, which is also known as Customer Lifecycle Marketing business process. A marketing organization can segment its customer and prospect base using multiple hierarchical structures. In the List Management business sub-process, PeopleSoft provides functionality through the Audience Builder component to define, manage and update segments and hierarchies. PeopleSoft Marketing uses segment groups to define these hierarchies within a set of segments. Within the segment groups, you can segment primary audiences into smaller groups, enabling effective analysis of various campaign strategies. Audience membership can be static or dynamic in nature. You can re-execute criteria used to define audiences to establish an updated snapshot of each segment. This closed loop reporting enables marketers to assess the performance of programs targeting their strategic customer segments.
The List Management business sub-process is related to the Customer Segment Mart. This business sub-process examines the measures by audiences, segments, or both, to help determine “hot lists.” This process also helps to identify list quantity issues that marketers can potentially address. Customer segment analysis using customer acquisition and customer segment reports identify the most effective campaigns used to generate leads and sales. You can reuse the attributes of these campaigns to create similar marketing programs that are designed to illicit similar customer behavior in the strategic segment that you have selected. Using the Segment Migration fact, you can perform segment response analysis by tracking the effectiveness of CRM activities in influencing your customer base over time.
Customer Segment Delivered Fact Tables
Customer Segment Mart provides the analysis of customer behavior around the activities of your CRM business processes. Organizations want to manage strategic segments of their customer base that have been identified as having great potential. Many of the customer-centric activities that are captured in the CRM system can have a correlating influence on the behavior of members of those strategic segments.
With the Customer Segment Mart, PeopleSoft provides the following fact tables:
Segment Migration
Customer Acquisition
Customer Segment
Segment Count
The Segment Migration fact table provides a periodic snapshot of segment membership for a customer. Each organization tracks strategic segments of customers determined by predefined criteria that are tracked by sales marketing organizations. You can validate activities created to influence a desired migration of customers from one segment to another. With this fact group, you can answer questions such as “How many customers have moved from a low-value segment to a high-value segment?”
The grain of the Segment Migration table is captured at the Customer level.
This table describes the fact in the Segment Migration fact table:
|
Fact Name |
Fact Description |
|
Migration Count |
Number of customers that migrated between segments. This fact answers questions such as “How many customers in one segment migrated to a different segment?” |
Customer Acquisition Fact Table
The Customer Acquisition fact is a transactional fact table that stores measures of new customers by date of first sale. With this fact group, you can answer questions such as “How many interactions existed before a customer made a first purchase?”
The grain of the Customer Acquisition fact table is captured at the Customer level.
This table describes the fact in the Customer Acquisition fact table:
|
Fact Name |
Fact Description |
|
First Order Amount |
Total order amount for the processing period for each customer. This fact answers questions such as “What is the total amount of a customer’s first order?” |
|
Sales Team Interactions Count |
Count of all sales team customer interactions before the close of the first sale. This fact answers questions such as “How many sales interactions, such as meetings or phone calls, take place before a customer makes the first purchase?” |
|
Direct Mail Interactions Count |
Count of all direct mailings to audience members before close of first sale (to become a new customer). This fact answers questions such as “How many direct mailings are there before a customer makes the first purchase?” |
|
Telemarketing Interactions |
Count of all telemarketing interactions before close of first sale (to become a new customer. This fact answers questions such as “How many telemarketing activities are there before a customer makes the first purchase?” |
|
Inbound Marketing Interactions |
Count of all advisor dialogs and branch script interactions before close of first sale (to become a new customer). This fact answers questions such as “How many inbound calls are made before a customer makes the first purchase?” |
|
Online Marketing Contacts |
Count of all Online Marketing list memberships before the close of first sale (to become a customer). This fact answers questions such as “How many online marketing contacts are made before a customer makes the first purchase?” |
|
Outbound Email Count |
Count of outbound email interactions before close of first sale (to become a new customer). This fact answers questions such as “How many outbound emails are sent before a customer makes the first purchase?” |
The Customer Segment fact table provides a periodic snapshot of customer segment composite metrics. With this fact group, you can answer questions such as “How many opportunities exist for a segment of customers?” and “How many interactions by channel are servicing this strategic segment?”
The grain of the fact table is captured at the Customer level.
This table describes the facts in the Customer Segment fact table:
|
Fact Name |
Fact Description |
|
Total Order Amount |
Total order amount for the processing period for each customer. This fact answers questions such as “What is the average order amount for this segment’s customers?” |
|
Sales Team Interactions Count |
Count of all sales team tasks in which there are customer contacts. This fact answers questions such as “How many sales team interactions, such as meetings or phone calls, are there?” |
|
Direct Mail Interactions Count |
Count of all direct mailings audience membership. This fact answers questions such as “How many direct mail interactions have taken place for this segment’s customers?” |
|
Telemarketing Interactions |
Count of all telemarketing interactions. This fact answers questions such as “How many telemarketing interactions have taken place for this segment’s customers?” |
|
Inbound Marketing Interactions |
Count of all advisor dialogs and branch script interactions. This fact answers questions such as “How many inbound emails are there for this segment’s customers?” |
|
Online Marketing Contacts |
Count of all Online Marketing list memberships before the close of first sale (to become a customer). This fact answers questions such as “How many online marketing contacts have take place for this segment’s customers?” |
|
Outbound Email Count |
Count of outbound email interactions. This fact answers questions such as “How many outbound emails exist for this segment’s customers?” |
|
Order Capture Inbound Interactions |
Count of all order capture inbound marketing interactions. This fact answers questions such as “How many inbound interactions regarding orders exist for this segment’s customers?” |
|
Number Case Requests |
Number of case requests for load cycle. This fact answers questions such as “How many cases were requested from this segment’s customers?” |
|
Number of Open Case Requests |
Number of open case requests for load cycle. This fact answers questions such as “How many cases are still open from this segment’s customers?” |
|
Number of First Call Case Resolution |
Number of cases resolved on the first call. This fact answers questions such as “How many cases are resolved on the first call from this segment’s customers?” |
|
Number of Leads |
Count of leads for this customer. This fact answers questions such as “How many sales leads are generated from this segment’s customers?” |
|
Number of Opportunities |
Count of opportunities for this customer. This fact answers questions such as “How many sales opportunities are generated for this segment’s customers?” |
|
Number of Quotes |
Count of quotes for this customer. This fact answers questions such as “How many sales quotes are generated for this segment’s customers?” |
|
Number of Orders |
Count of orders for this customer. This fact answers questions such as “How many sales orders are generated for this segment’s customers?” |
|
Number of Times targeted |
Number of audiences a customer is in that is used by marketing activities for the period. This fact answers questions such as “How many times are this segment’s customers targeted for marketing activities?” |
The Segment Count fact table provides a periodic snapshot of customer count for the segment. With this fact group, you can answer questions such as “How many new customers are acquired for a specific segment?”
This table describes the fact in the Segment Count act table:
|
Fact Name |
Fact Description |
|
Number of New Customers |
If the customer has a sale in the period between start date of period and load date, the value is 1; otherwise, the value is 0. With this fact, you can answer questions such as “How many customers in the segment are new customers?” |
|
Number of Existing Customers |
If the customer is an existing customer, then the value is 1; otherwise, the value is 0. With this fact, you can answer questions such as “How many customers in the segment are existing customers?” |
|
Number of Lost Customers |
If the customer is a lost customer, then the value is 1; otherwise, the value is 0. With this fact, you can answer questions such as “How many customers in the segment have not placed an order in the past 18 months?” |