Specifying Data Model Options
Use the Specify Data Model Options (PTPG_WIZ_OPT) page to define the initial layout of the grid and the chart.
Navigation:
Access the Specify Data Model Options page by selecting the Next button on the Specify Data Model Values page.
This example illustrates the fields and controls on the Specify Data Model Options page. Definitions for the fields and controls appear following the example.
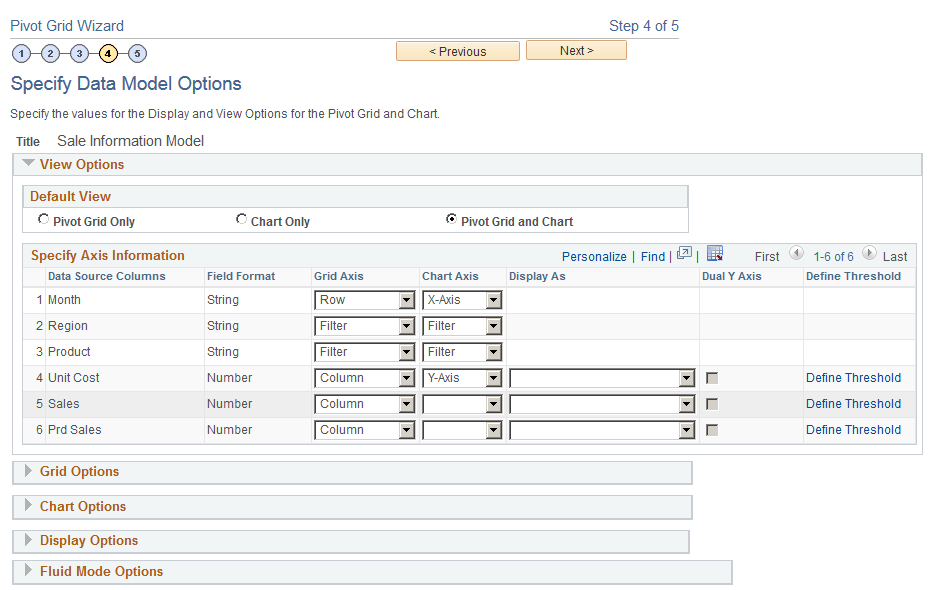
This page has six main sections: View Options, Grid Options, Chart Options, Display Options, and Fluid Mode Options. Each section can be expanded or collapsed.
Expand to display the view options.
Field or Control |
Description |
|---|---|
Default View |
Define Pivot Grid view options for the grid and the chart. Available options are:
|
Grid Axis and Chart Axis |
Select the initial grid and chart layout. Note that:
You can set multiple columns as Y axes, and these Y axes will be plotted as series on the charts. This feature has these limitations:
Note: The behavior of the Multiple Y axes feature applies to both classic and fluid views. In addition for fluid viewer, you have the option to control the behavior when you select facts in the column area that are displayed in the fluid viewer. See Fluid Mode Options. |
Display As |
The Display As column is available only for number (facts) fields. Select either the Percentage or the Percentage Grand Total option to display the number (fact) values in the grid and chart. Select display as Percentage if you want to show the data point in percentage. Select display as Percentage Grand Total if you want to show the calculated percentage of the data point on the grand total of the field. |
Dual Y-axis |
This option is available for the columns that are set to Y axis. Select an option to set the corresponding Y axis column as a dual Y axis on the Pivot Grid charts; this means that the system will display a second Y axis on the chart. The values for the second Y axis will be plotted like a series on the chart. Note that:
Note: The behavior of the Dual Y axis feature applies to both classic and fluid views. |
Define Threshold |
Click to access the Configure Thresholds page, where you can configure the basic threshold settings for the grids and the charts. All threshold settings are applied for both classic and fluid views. For detailed description see, Configuring Thresholds. |
Next |
Click to advance the wizard to the next page. |
Use the Grid Options section to define Pivot Grid view options for the grid and the chart.
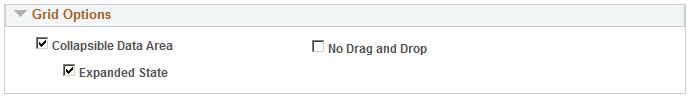
This example illustrates the fields and controls in the Specify Data Model Options page - Grid Options section. Definitions for the fields and controls appear following the example.
Field or Control |
Description |
|---|---|
Collapsible Data Area |
Select to allow viewers to collapse the data area. |
Expanded State |
Select to have the initial view expanded. |
No Drag and Drop |
Select if you do not want users to have the ability to drag and drop filters, rows, and column axes. |
Expand the Chart Options section to enter additional chart options.
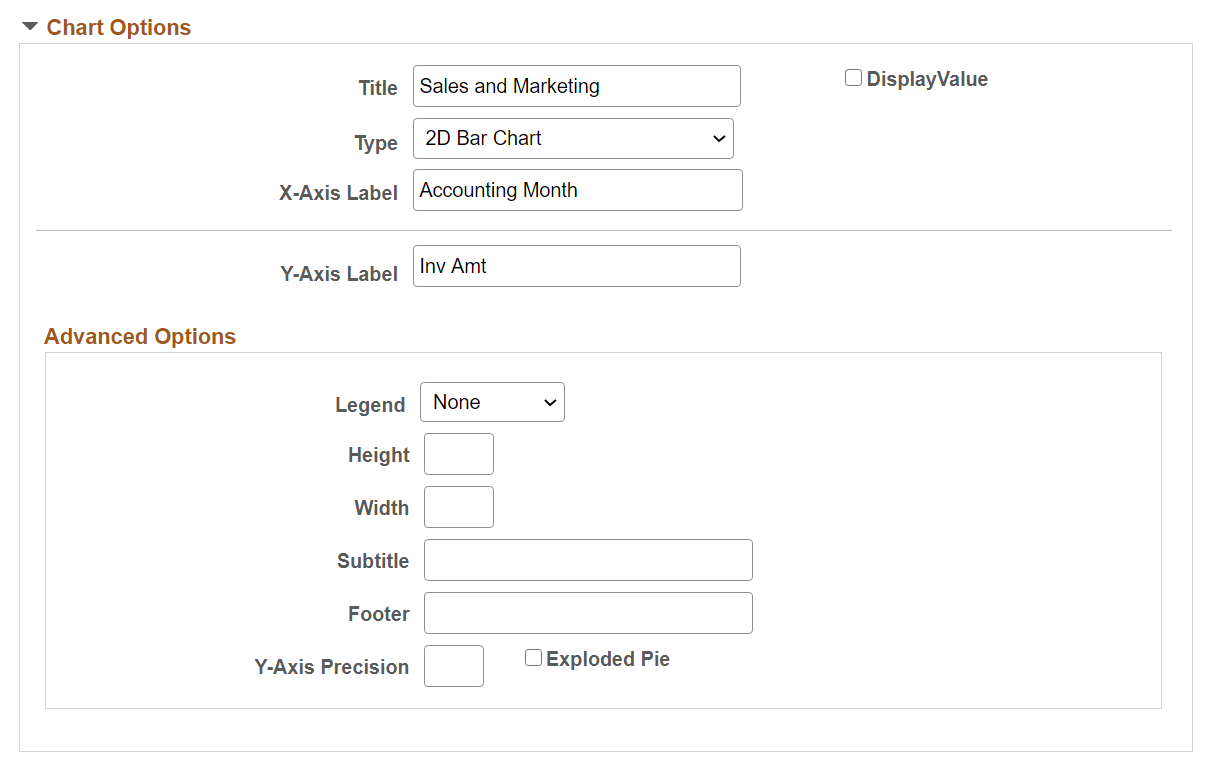
This example illustrates the fields and controls on the Specify Data Model Options page - Chart Options section. Definitions for the fields and controls appear following the example.
Field or Control |
Description |
|---|---|
Title |
Enter a title for your chart. By default, the Pivot Grid model name is used. |
Display Value |
Select this check box to display the data point values on the chart. The check box is disabled by default. |
Type |
All PeopleSoft chart types are available, including:
Note: 3-D charts are not supported as a chart type. |
X-Axis Label |
Enter a label for the X axis. By default, the field name for the X axis is used. |
Y-Axis Label |
Enter a label for the Y axis. By default, the field name for the Y axis is used. |
Advanced Options |
Define display options for the chart, including chart legend, and height and width of the chart. |
Legend |
Select a legend for the chart. The available options are Bottom, Left, None, Right, and Left. By default, the None option is selected. |
Y-Axis Precision |
Enter the number of decimal places in the Y-axis values. For example, when the Y-Axis Precision has a value of 2, the Y-axis in the chart has two decimal values. Note: When the pivot grid display is a pie chart type, then the Y-Axis Precision is disabled and considered as 0. |
Exploded Pie |
Select to view the 2D or 3D charts with exploded sectors. |
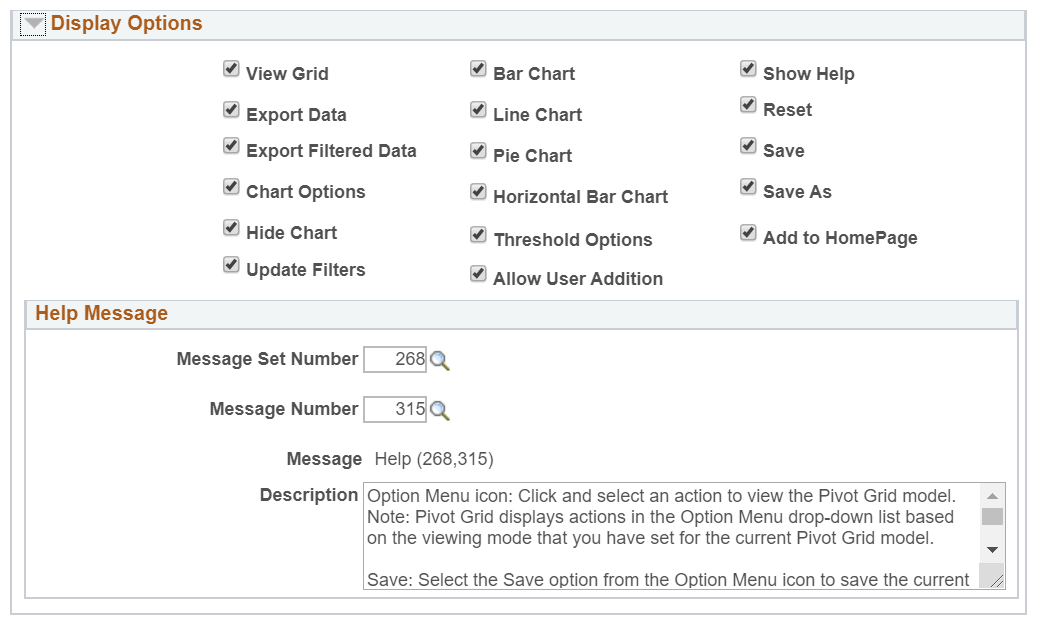
Use the Display Options section to hide chart icon shortcuts and to disable menu options in the Pivot Grid display. This configuration is at the model level and is applicable for all views.
For example, if the Hide Chart, Pie Chart, and Horizontal Bar Chart options are not selected in the Display Options section, the Hide Chart option in the Option Menu dropdown list is disabled and the Pie Chart and the Horizontal Bar Chart icons are invisible in the Pivot Grid display.
This example illustrates the fields and controls on the Specify Data Model Options page - Display Options section.
All selected options are available under the Options Menu on a pivot grid model view. See Using the Options Menu.
Field or Control |
Description |
|---|---|
View Grid |
Select to display the Pivot Grid view for the chart view on a modal window. The modal window also includes the facet pane on the left. You can select to slice and dice the data in the grid by dragging the facets from the left pane to the columns and rows of the grid. In addition, you can change prompts and facet values to analyze the data. When you select the Apply button in the top right of the modal, the chart is refreshed based on the current layout of the grid. Otherwise, when you select the Cancel button in the top left of the modal, it is closed and the chart layout is not changed. |
Export Data |
Select to export the underlying PSQuery data to Microsoft Excel. |
Export Filtered Data |
Select to export the filtered PSQuery data:
|
Chart Options |
Select to open the Chart Options dialog box, where you can change the chart layout, chart axis, and filters, and enable the display of the data point values on the chart. This option is available only when the chart is visible. See Using the User Charting Options. |
Hide Chart |
Select to show the option Hide Chart on a Pivot grid and Chart model. |
Update Filters |
Select to display the Update Filters dialog box, which enables you to add or remove filters for a model. The dimensions, that are configured with blank values for the Chart Axis column in Step 4: Specify Data Model Options page of the Pivot Grid Wizard, will be available to add as additional filters in addition to the default filter dimensions. See Specifying Data Model Options |
Bar Chart Line Chart Pie Chart Horizontal Bar Chart |
Select to provide the user options to change chart display visual. |
Threshold Options |
Select to authorize users to personalize threshold configurations. |
Allow User Addition |
Select to allow users to configure Personalized Analytic Notification. See Understanding Personalized Analytics Notification. Users will be able to personalize Threshold Criteria and Alert Type from Threshold Personalization dialog box. See Personalizing Thresholds. If the option is not selected, then options to personalize a threshold are available to the users or roles in the default notification list in Configure Threshold dialog box. See Configuring Thresholds. Enable Threshold Options to enable Allow User Addition. |
Show Help |
Displays the help icon on the pivot grid model. |
Reset |
Select to reset the pivot grid model to its original display. |
Save |
Select to save the current model layout as a default view of the current model. The model layout, filter values, and PSQuery prompt values are also saved as preferences. |
Save As |
Select to open the Save As dialog box, which enables you to copy the current Pivot Grid model and save it as a different one. |
Add to HomePage |
Select to add the pivot grid model with personalizations to a homepage. You are prompted to select the homepage when you select the option. |
Help Message |
Configure message text using the PeopleSoft preconfigured Message Set Number and Message Number. The message description shows when you roll over the Help button. |
This example illustrates the Pivot Grid fluid view. The Export Data, Export Filtered Data, and View Grid options are not listed in the Options Menu, and the Pie Chart and Horizontal Bar Chart icons are invisible.
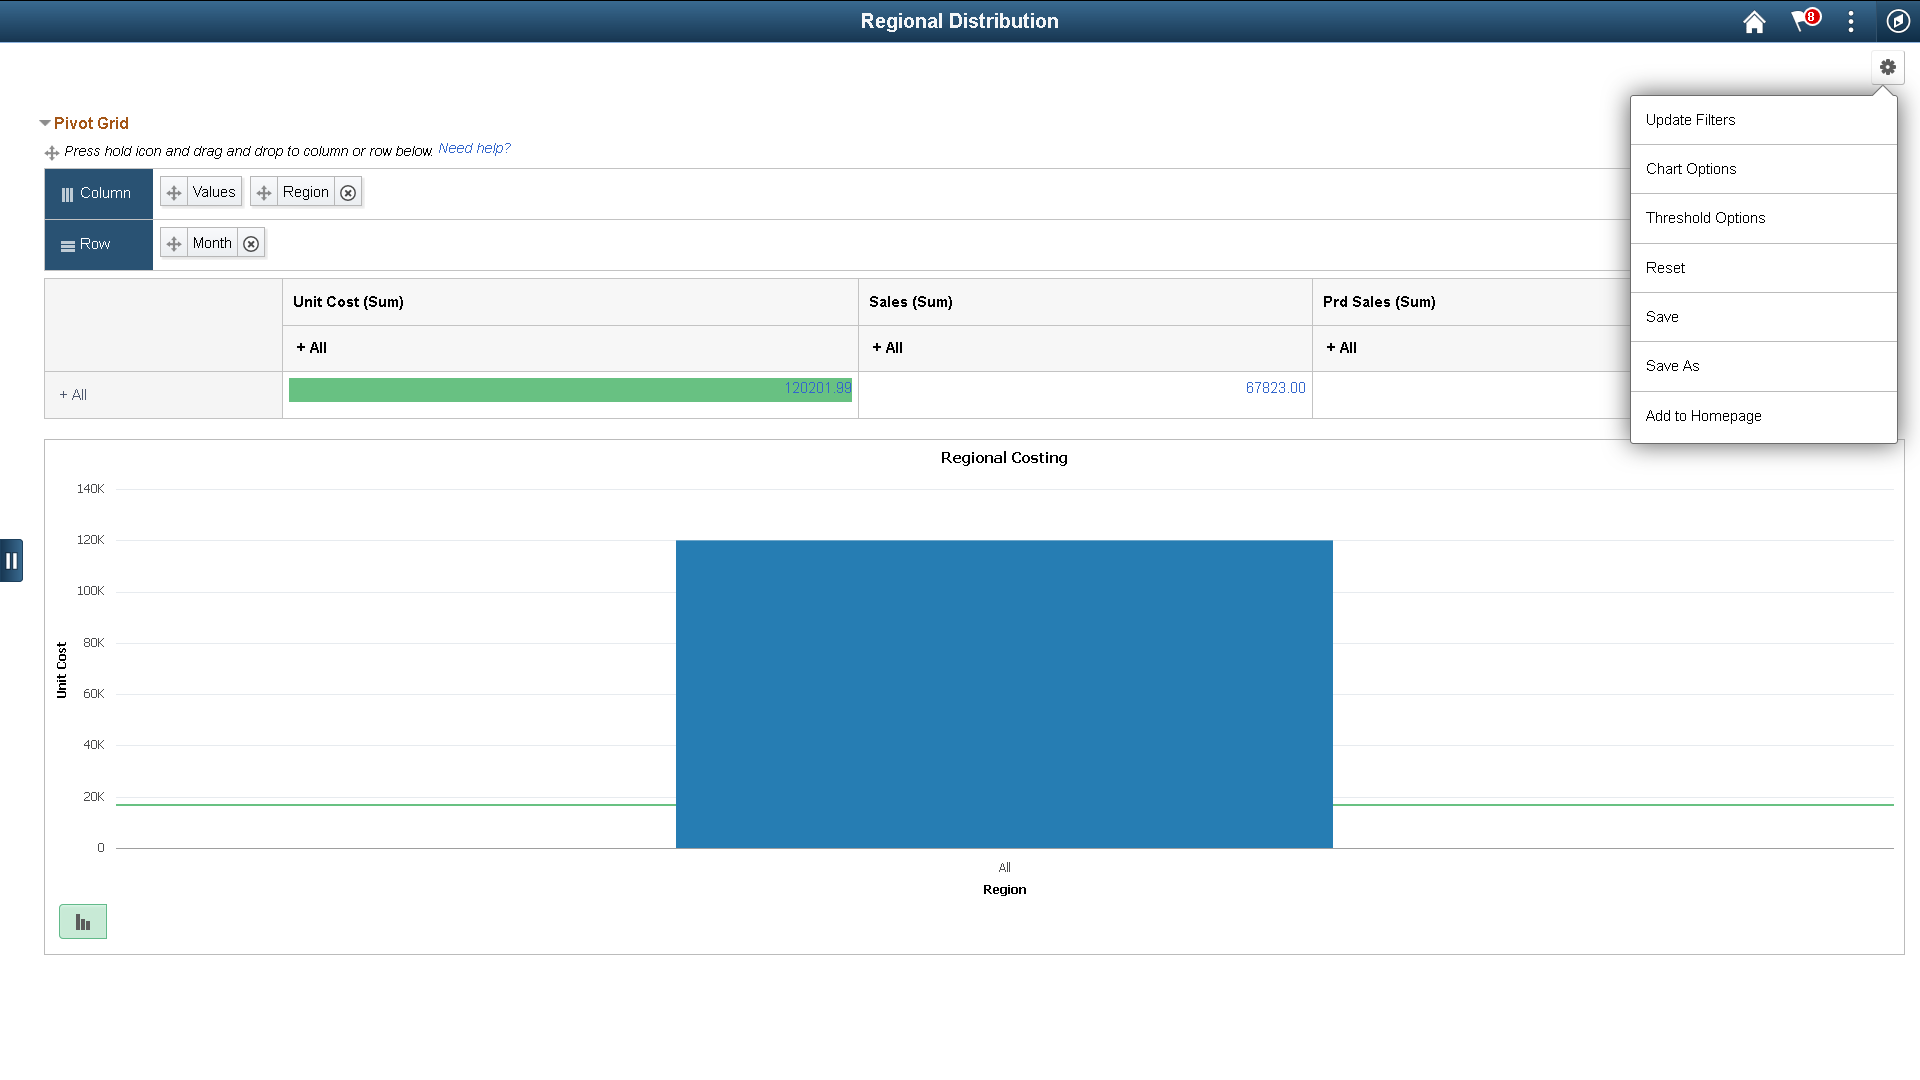
Note that following points when you set the values in the Display Options section:
If no view option is selected in the Display Options section and if all prompts are set to invisible, then the Options Menu is invisible in Pivot Grid Viewer.
You can selectively show and hide prompts using the Select Query Prompt Values section in the Pivot Grid Wizard – Specify Data Model Values page.
If the Show Help option is selected, the embedded Help icon is available in the Grid Viewer page.
Note: The Help icon is shown only in the classic viewer and it is unavailable in Fluid viewer.
Use the Help Message section to define the help information. The default help message is from message set number 268, and the message number 315. The message catalog entry is parsed for special placeholders %PBCTXT(PTPG_PSPGVIEWER). Note that the Help URL field in the Web Profile Configuration page must be specified (by selecting PeopleTools, Web Profile, Web Profile Configuration).
The Fluid Mode Options are grouped as follows:
List View Options
Viewer Options
Facet Selection
List View Options
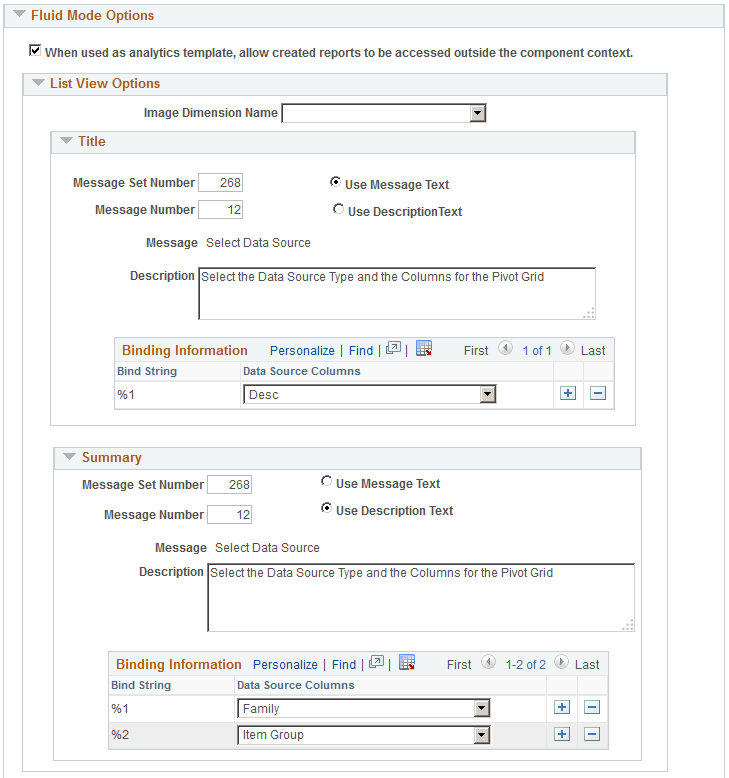
Use the Specify Data Model Options page - Fluid Mode Options section- List View Options region to define the list view options for the pivot grid model. The list view options include the title and the summary for each row of result. The Title and Summary regions use the dimension values that are part of the detail grid. When designing the pivot grid model, application developers create the title and summary text from message catalog entries. The bind values for the message catalog are passed from the dimensions, facts, and display columns.
See the Message Catalog section in Using Administration Utilities
Note: The list view options are also available at the Views Configuration page (Pivot Grid Wizard, Configuration Pivot Grid View link). These properties can be configured at each view level. The Views Configuration page for pivot grids overrides the Fluid Mode Options at the view level.
This example illustrates the fields and controls on the Specify Data Model Options page - Fluid Mode Options section - List View Options group.
Viewer Options
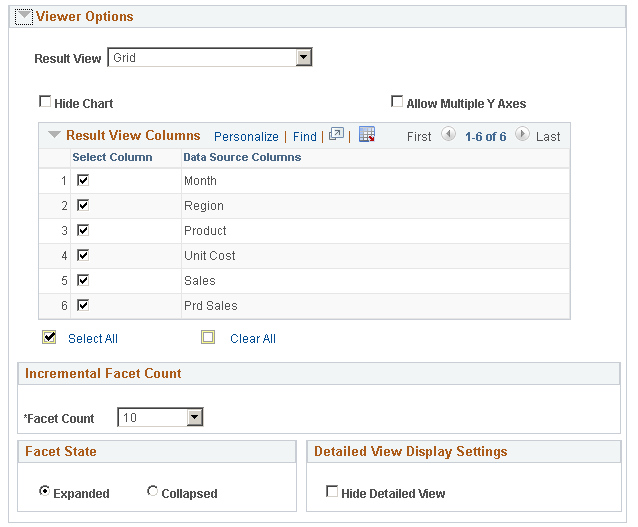
Use the Specify Data Model Options page - Fluid Mode Options section - Viewer Options region to define the result view for the pivot grid model.
This example illustrates the fields and controls on the Specify Data Model Options page - Fluid Mode Options section - Viewer Options group.
Field or Control |
Description |
|---|---|
Result View |
The Result View can be set to Grid, List, Grid and List, or None. |
Allow Multiple Y Axes |
Select this option to allow users to select multiple Y Axes on the chart. If this option is deselected, any change to the Y axis will result in a single Y axis being plotted on the chart. |
Hide Chart |
Select this option to hide the Chart toggle on a Component Real time Search page. If the check box is not selected the toggle will show on the search result page. |
Result View Columns |
By default, all the display type columns, axis rows, filters, and facet fields appear in the detail view. You may not select any column in the Result View Columns section to hide that column in the fluid view. |
Incremental Facet Count |
From the Facet Count dropdown select the incremental number of facet values that will load at a time. |
Facet State |
Select to keep the facets on the left pane, expanded or collapsed when the model loads initially. |
Detailed View Display Settings |
Select the Hide Detailed View check box to help chart models load faster. This option defers loading the detailed view of a chart. |
Facet Selection
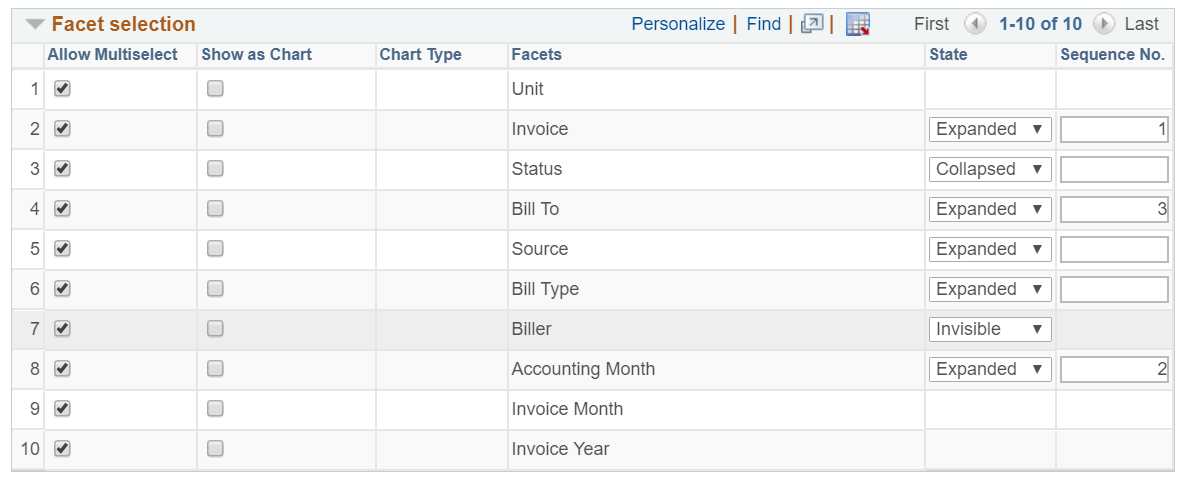
Use the Specify Data Model Options page - Fluid Mode Options section - Facet selection region to set the facet display options.
This example illustrates the fields and controls on the Specify Data Model Options page - Fluid Mode Options section - Facet selection region.
Field or Control |
Description |
|---|---|
Allow Multiselect |
Select to enable multi-select facets as charts and as lists in fluid views. |
Show as Chart |
Select to enable chart view. |
Chart Type |
Set the chart type for the facet. |
Facets |
Displays the facet name. |
State |
Select the state for the facet to appear as Expanded or Collapsed or as Invisible when the model loads initially. |
Sequence No. |
Define sequencing of the facets in the pivot grid configuration. The facet with the lower sequence number value will take precedence in order of appearance. |
Drilling URL Options
Use the Specify Data Model Options page - Fluid Mode Options section - Drilling URL Options region to define how mapped drilling URLs will appear in fluid view. The available options are Full Page Modal, Modal Window, New Window, and Replace Window.
This example illustrates the columns on the Specify Data Model Options page - Fluid Mode Options section - Drilling URL Options region.
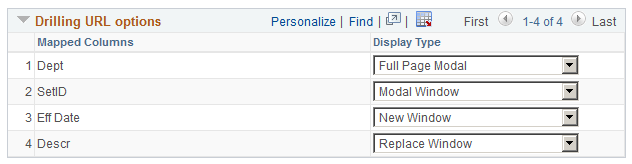
Note: PeopleSoft recommends that you set your drilling URLs to open in a new window for all external drilling URLs and classic components. For pages with fluid views, the Replace Window and Modal Window options are recommended.
The size of the modal window is controlled by the target page’s min-width and min-height settings, which is similar to any fluid modal. In smart phones, the target page is displayed as full page modal automatically when the column is configured to use the Modal window option.