Using the User Charting Options
Use the User Charting Options dialog box in Pivot Grid Wizard and Chart Options dialog box in Pivot Grid Viewer to change the chart layout, chart axis, and filters, and to enable the display of the data point values on the chart.
To access the User Charting Options dialog box, go to Step 5 of the Pivot Grid Wizard, select the gear icon (Options Menu), and then select Chart Options.
This example illustrates the fields and controls in the User Charting Options dialog box.
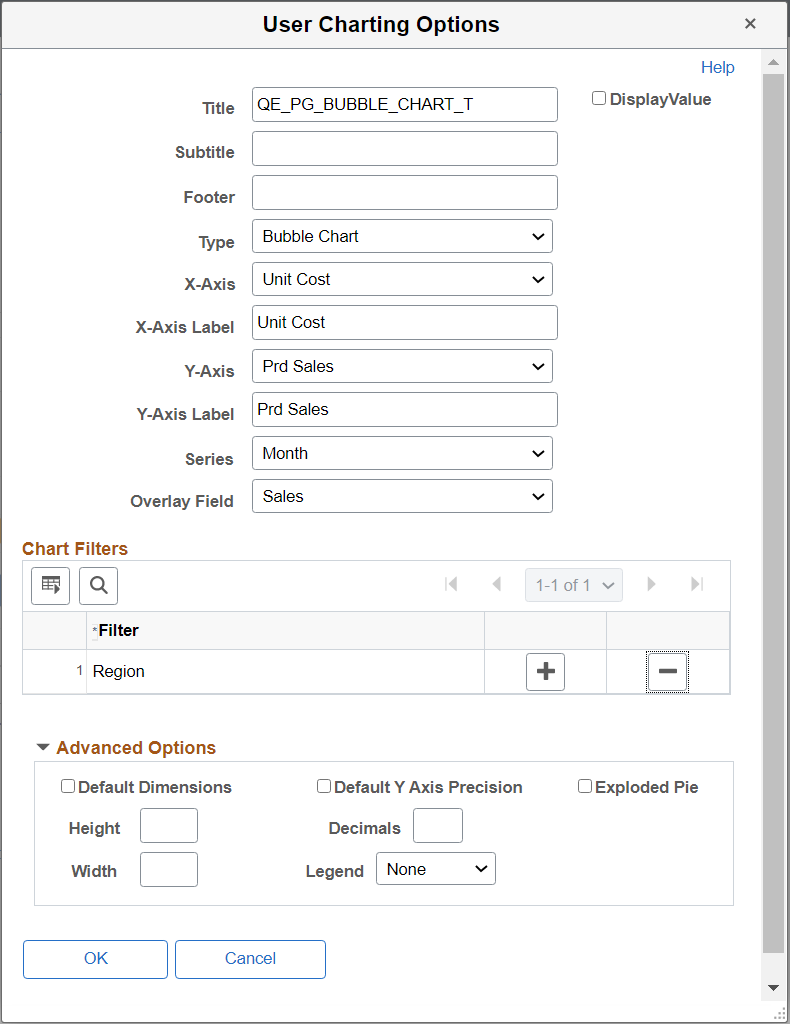
Note: The X Axis, Y-Axis Series, Overlay Field, and Chart Filters fields in the User Charting Options dialog box are not editable if the display option is Pivot Grid and Chart.
Field or Control |
Description |
|---|---|
Title |
Enter the title of the pivot grid. |
Display Value |
Select this check box to display the data point values on the chart. The check box is disabled by default. |
Subtitle |
Enter the subtitle if required. It displays under the title with smaller font size. |
Footer |
Enter additional information to display as footer text. |
Type |
Select the display type of the chart . See Chart Options. Note: 3-D charts are not supported as a chart type. |
X-Axis |
Select to change the X-Axis. You can change the X-axis from the User Charting Options, if you decide to use another field as x-axis. |
X-Axis Label |
Enter or modify the X-Axis label. |
Y-Axis |
Select to change the Y-Axis. You can change the X-axis from the User Charting Options, if you decide to use another field as y-axis. |
Y-Axis Label |
Enter or modify the Y-Axis label. |
Series |
Select the x-axis field to define as series. |
Overlay Field |
Select the Y-axis field to define as an overlay. |
Chart Filters |
Add or delete filters displayed on the chart view. |
Advanced Options |
Define display options for the chart, including chart legend, and height and width of the chart. |
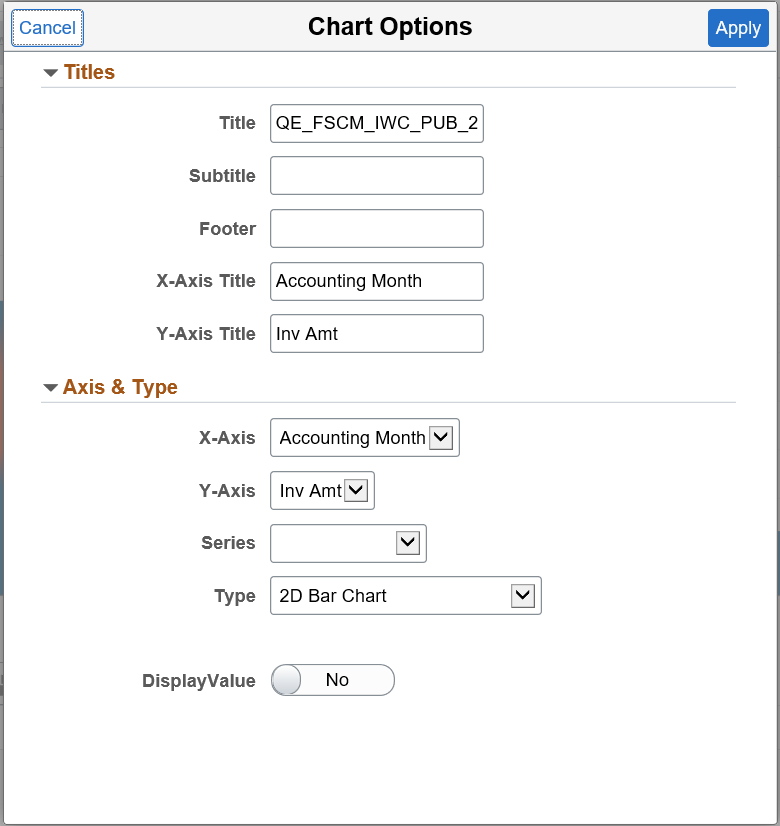
To access the Chart Options dialog box, select the gear icon (Options Menu), and then select Chart Options.
The following example illustrates the fields and controls in the Chart Options dialog box.