Performing Actions on the Pivot Grid Viewer
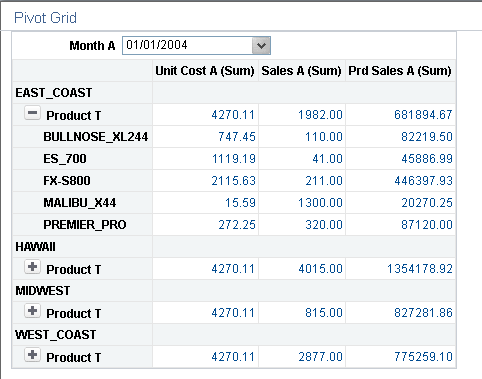
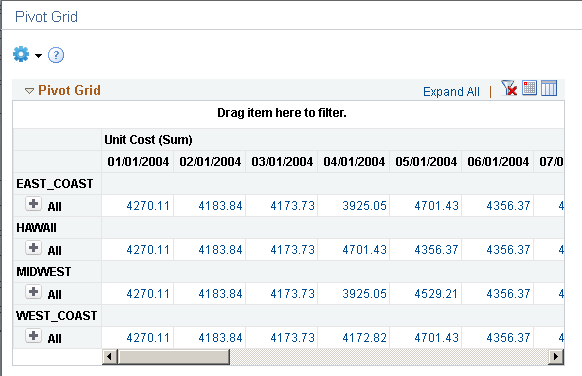
Click the + button to drill down a dimension on the pivot grid.
The example displays an item drill-down on the pivot grid viewer.
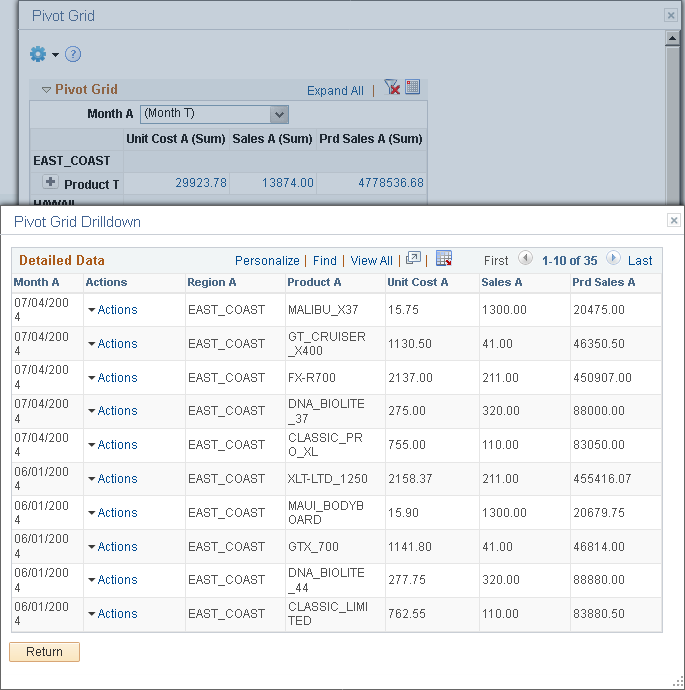
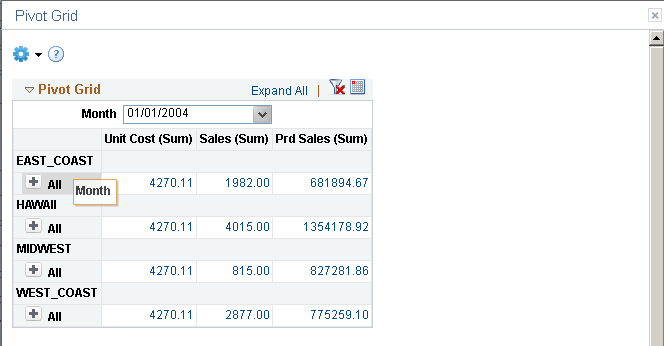
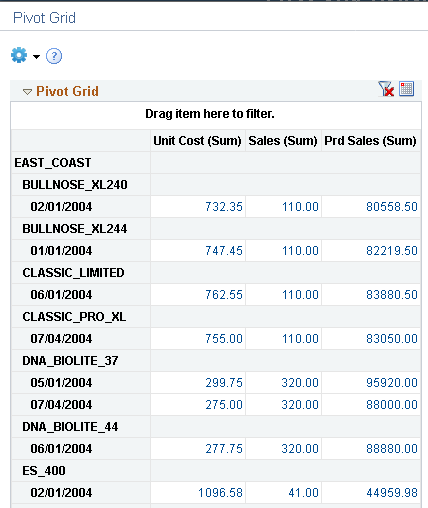
Drill down the aggregate values like SUM, AVG, COUNT, and so on. Click the aggregate value displayed on the grid to display the data that comprise the aggregate value.
The example displays detailed data view of an aggregate view item.
While performing drill down on the aggregate values, note that:
You may not be able to drill down an aggregate value if the authentication domain is incorrect. Set it up from the PeopleSoft Pure Internet Architecture or in the Web Profile page. See “Configuring General Portal Properties” in Configuring Web Profiles.
When you move the mouse over the value numbers, they appear as underlined links. Click the links to open the Detailed Data view for the aggregate value.
If related actions are configured for the aggregate view, clicking the value number links populates a context menu with two options: Detailed View and Actions.
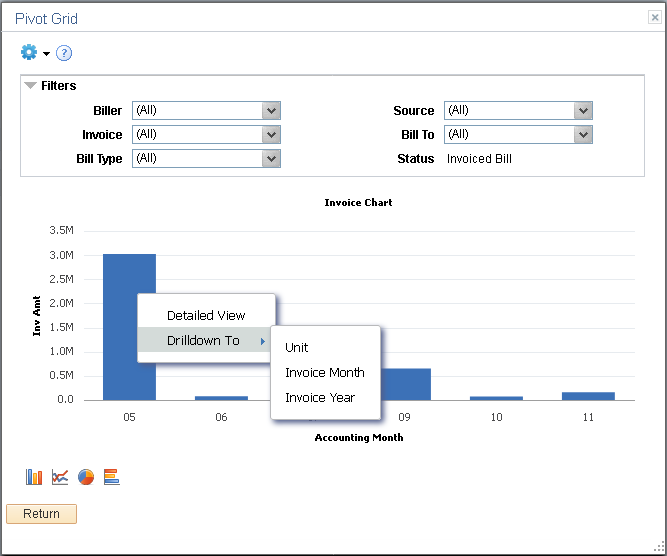
By clicking the data point on the chart, you can also drill down on aggregate values in the chart to view the detailed data that represents the chart data point; for example, a bar, a pie section, a line chart data point, and so on. If related actions are configured for the aggregate view, clicking the data point on the charts populates a context menu with three options: Detailed View, Drilldown To, and Actions.
This example shows the Drilldown To option that enables you to drill down to an axis value.
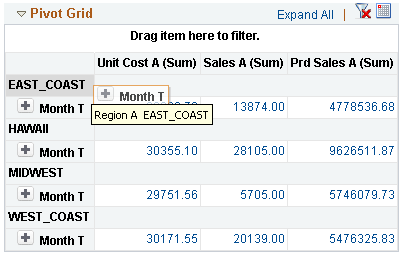
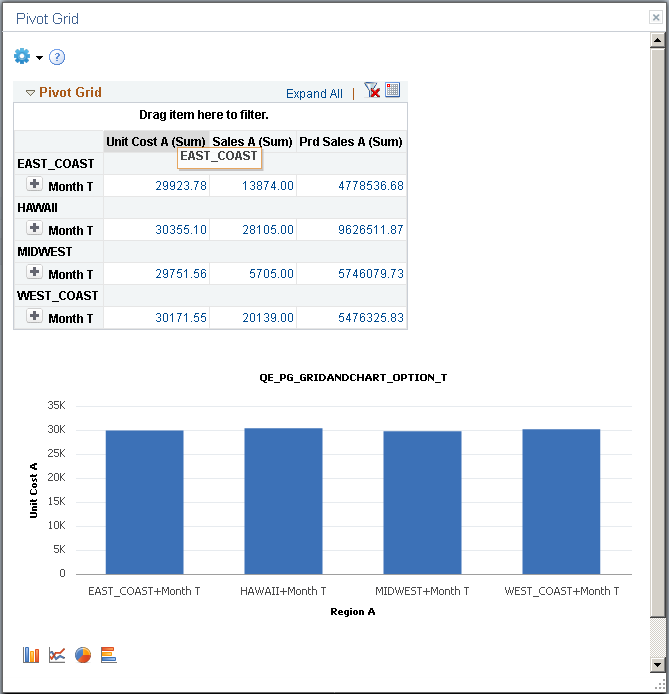
Drag the filter and move it to row or column.
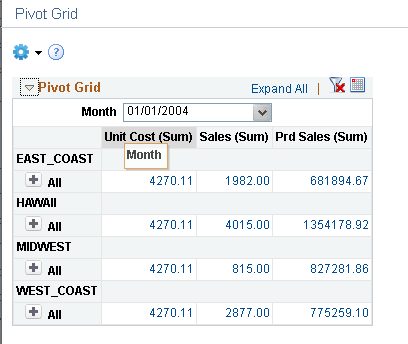
This example shows the report filter moved to the column axis.
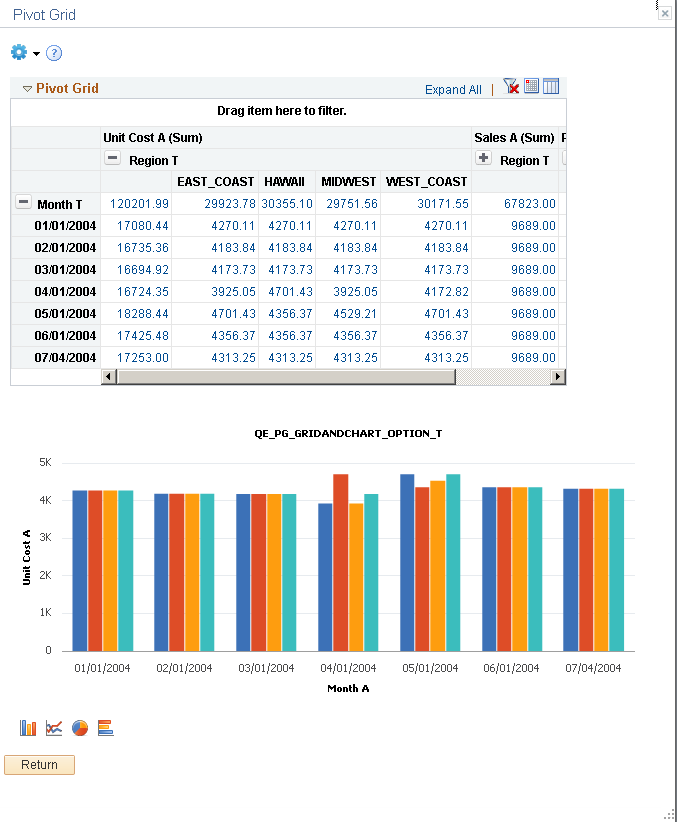
This example shows how to move the Month filter to a row axis by clicking the Month field and dragging it to the X axis.
This example shows a portion of the grid view when the report filter is moved to the row axis.
When there is any change in the pivot grid, the corresponding chart also shows the change.
In this example, Month is changed to the highest dimension level by dragging the month up on the X axis.
This example shows a portion of the grid after changing the dimension level.
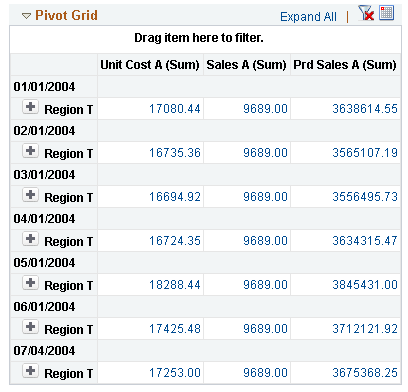
Chart also shows similar changes when there is any modification made to the grid.
You can move a row to a column and other way round too. Chart will also reflect changes made to the grid.
In this example, the Region axis is dragged to the column axis.
The chart and grid changes and shows data according to the changed axis.
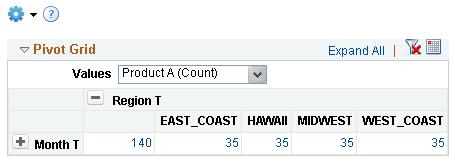
This example shows the Values filter. Drag any dimension from the grid to top of the grid to create a filter.
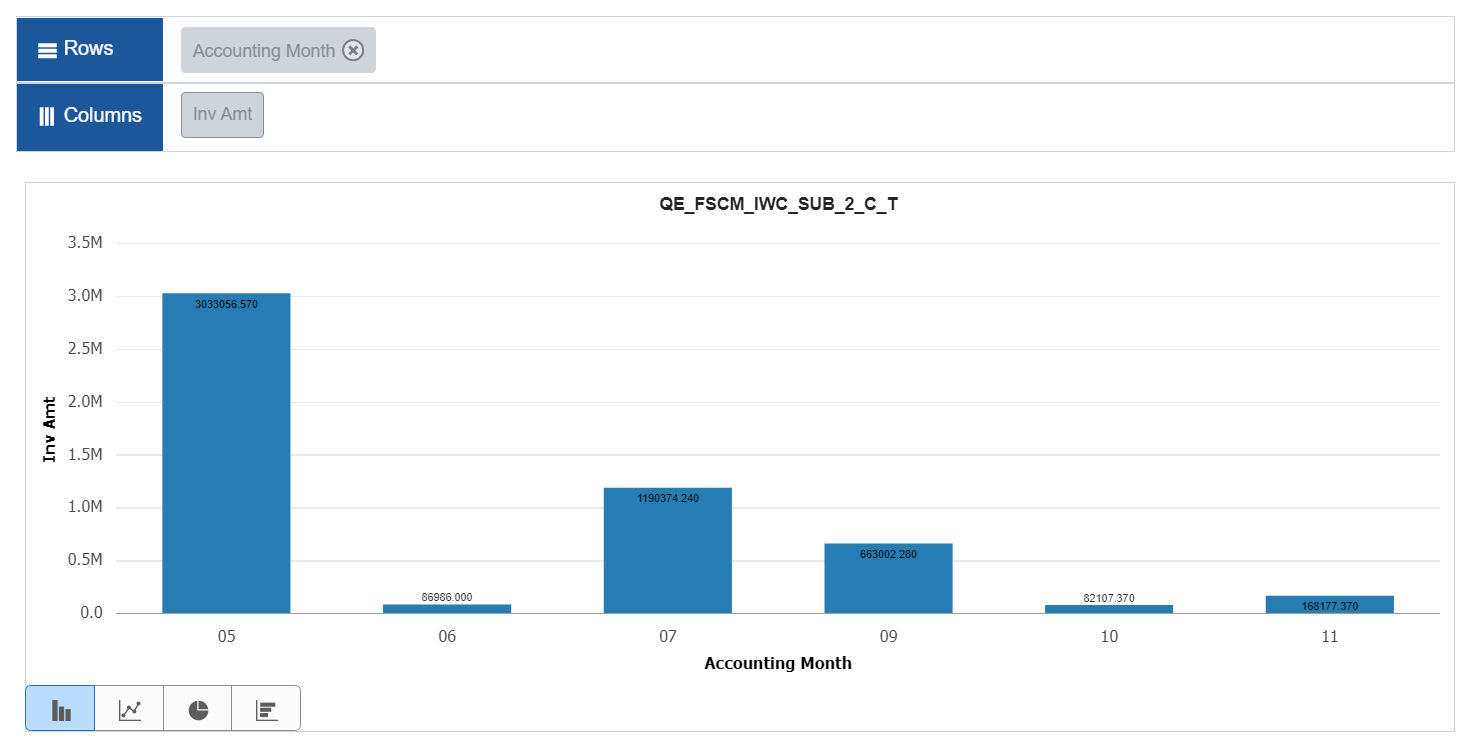
You can display the data point values on the Pivot Grid chart. This feature is disabled by default. You can enable this feature in the Pivot Grid Viewer as well as the Pivot Grid Wizard by selecting the Display Value check box in Chart Options. See Describing the Options Menu and Using the User Charting Options
The following example illustrates how the data point values are displayed on the chart when the Display Value option is enabled.
You can use the filter above the grid on the pivot grid viewer to select specific items. The grid and chart changes accordingly. You can select single or multiple values from one or more filter dropdown options. The filters also apply progressive filtering if they are dependent on each other.
Note: After applying filters on the Pivot Grid, if you navigate to a URL or Related Action, and then return to the Pivot Grid, the applied filters will be retained on the Pivot Grid. However, any changes that you make to the Pivot Grid database will not be updated on the retained filter(s).