 Analytic Models
This chapter discusses:
Analytic models.
Relationship of parts.
Tools.
Analytic Models
An analytic model is an information workshop. Just like an ordinary workshop, it contains parts that you use to build your projects and tools to put the parts together. But instead of building a cabinet or a chair, you organize data by building analytic models of information. This analytic model imitates the structure and relationships of information in the real world.
You can think of an analytic model as a collection of various kinds of information that are held together by a common purpose. For example, you can create an analytic model of an entire business, with information about revenues, employee expenses, accounts receivable, assets, liabilities, equity, and so on. You can also create an analytic model of a particular part of a business—such as employee expenses—and include more detail than you would in a more general analytic model of a business. The focus can be wide or narrow, but all the information about the area of interest goes into a single analytic model.
Because of an analytic model's multidimensional capabilities, end users analyze data from different angles to gain insight into their data. This data can range from a small table of values to a very large table containing hundreds of kinds of data about thousands of people, places, or things.
Relationship of Parts
This section discusses:
Data cubes and dimensions.
Formulas and user functions.
Cube collections.
Organizers.
 Data Cubes and Dimensions
The primary parts in an analytic model are data cubes (cubes) and dimensions:
A data cube is like a sheet of paper that contains one and only one kind of data.
When you build an analytic model, you create a data cube for each kind of information in the analytic model. For example, an analytic model of a business might contain a data cube for sales, a data cube for rent, a data cube for salary, and so on.
A dimension contains a list of one kind of data that can span various contexts.
For example, an analytic model of a business might contain the PRODUCT_CODES dimension and the MONTHS dimension. These two dimensions can be used in both a SALES cube collection and a COST_OF_GOODS cube collection to track the products sales and costs over a period of months.
A dimension member (member) is one list item within a dimension.
Maximum Length of Dimension member is 30. Many different kinds of dimension members exist. For example, the 010 product code is a detail member of the PRODUCT_CODES dimension. Western Europe is an aggregate member of the REGIONS dimension.
See Types of Dimension Members.
Note. You do not create dimension members in the analytic model definition. Instead, dimension members are dynamically created during runtime.
Note. The maximum number of dimensions attached to a data cube is 31. The aggregation routines fail if the attached dimensions are greater than 31.
Data cubes and dimensions work together to create the structure of the analytic model. To see how this works, imagine writing SALES at the top of a blank sheet of paper. This is the equivalent of creating a new data cube.
You could write only a single value in the SALES cube, but a cube with only one value is not useful. So your next action is to write a list of months across the top of the cube and a list of product codes down the side of the cube. This is an example of this image:
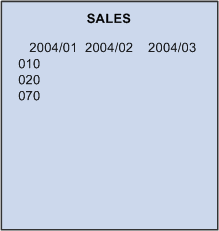
SALES data cube with attached PRODUCT_CODES and MONTHS dimensions
The SALES cube now contains a value for every month and product code because you attached two dimensions to the cube.
Dimensions are separate objects that can be used independently of data cubes. For this reason, even though you originally created the MONTHS and PRODUCTS dimensions for the SALES cube, you can reuse these dimensions with other data cubes. For example, imagine taking a new sheet of paper and writing COST_OF_GOODS at the top of the page, and then attaching the existing dimensions to the new sheet. This is an example of this image:
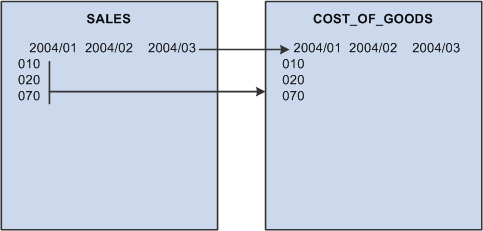
Attaching the PRODUCT_CODES and MONTHS dimensions to the COST_OF_GOODS data cube
It is tempting to think that the dimensions attached to the COST_OF_GOODS cube are copies of the dimensions on the SALES cube. This might be true on paper, but an analytic model works differently. The dimensions are independent objects that you attach to the data cubes. For this reason, the MONTHS dimension that is attached to the COST_OF_GOODS cube is the same dimension as the MONTHS dimension that is attached to the SALES cube. Therefore, any change that an application makes in a dimension is reflected on all data cubes that use that dimension.
For example, suppose the application adds a product code called 090 to the PRODUCT_CODES dimension on the SALES cube. The analytic model adds 090 to the PRODUCTS dimension on the COST_OF_GOODS cube. This is an example of this image:
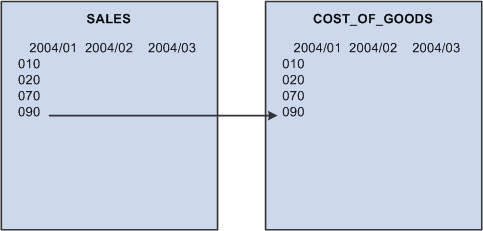
Adding the 090 product code to the PRODUCT_CODES dimension on the SALES cube
When updating an analytic model, you can use a combination of existing and new dimensions when you define a data cube. For example, suppose you create a cube called SALARY. You want to track monthly data, so you attach the existing MONTHS dimension to the data cube. You also want to track the salary for each employee, so you create a new EMPLOYEES dimension and attach it to the SALARY cube. This is an example of this image:
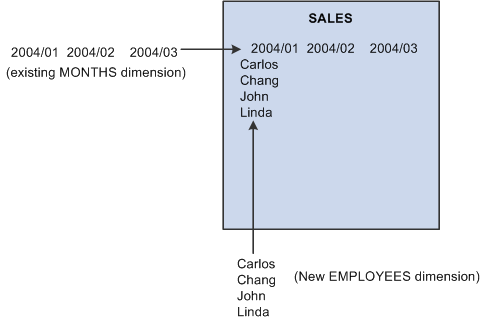
SALARY data cube with attached MONTHS dimension and new EMPLOYEES dimension
Formulas and User FunctionsYou create formulas to define the relationships among the data cubes in an analytic model. For example, this formula for the GROSS_MARGIN data cube defines the relationship between GROSS_MARGIN and other data cubes called SALES and COST_OF_GOODS:
SALES - COST_OF_GOODS
The analytic calculation engine recalculates the values in the GROSS_MARGIN data cube whenever the end user changes the values in the SALES or COST_OF_GOODS data cubes and saves those changes.
Formulas refer to kinds of information as defined by data cubes. Formulas do not refer to specific values. The relationship between GROSS_MARGIN, SALES, and COST_OF_GOODS remains true regardless of the specific data contained in these data cubes. You can attach new products or months to the data cubes without changing or copying the formula because the relationships between the data cubes have not changed.
User functions serve several purposes. You can create a user function that contains all or part of a formula and apply this user function to calculate multiple data cubes. You can also create user functions to define filter functions and rules for aggregating dimension members.
See Creating Rules, Formulas, and User Functions, Understanding Dimension Members.
Cube CollectionsA cube collection is a collection of related data cubes. You create cube collections to load data from the database into the analytic model, save data back to the database, and display calculated data to the end user at runtime. Some cube collections contain data cubes that receive user input, and other cube collections calculate data cubes and display calculated data to the end user.
See Creating Cube Collections.
Organizers
You can use organizers to arrange an analytic model's parts for more convenient viewing and editing. Within an analytic model, you can place any of the following parts in as many different organizers as you want:
Cube collections.
Data cubes.
Dimensions.
User functions.
Organizers.
You can drag and drop parts into and between organizers, place suborganizers into organizers, and drag and drop organizers and suborganizers to arrange their positions in the Organizers branch of the part browser.
See Also
Tools
This section discusses:
PeopleSoft Application Designer window components for creating analytic model definitions.
Behavior of bars.
Menu bar.
Part browser.
PeopleSoft Application Designer Window Components for Creating Analytic
Model Definitions
You use the areas labeled in this example to create analytic model definitions (select Start, Programs, PeopleTools 8.5x, Application Designer):
|
Provides access to commands and features that you use to create analytic model definitions. See Menu Bar. |
|
|
Contains buttons that you use to perform common commands and edit the parts of an analytic model definition. |
|
|
Contains buttons that you use to define formulas for data cubes and user functions. |
|
|
Displays the rules for data cubes and user functions. Note. The type of information that appears in the rule bar depends on the part that is currently selected. |
|
|
Part Browser |
Contains hierarchies that you use to view, organize, and edit an analytic model definition's parts. See Part Browser. |
|
Contains dialog boxes that you use to edit the parts of an analytic model definition. |
|
|
Enables you to enter notes about the different parts of the analytic model definition. |
|
|
Contains the output text from PeopleSoft Application Designer operations, such as Build (SQL Create and Alter), Find Definition References, Upgrade, Results, Validate, and PeopleCode Log. |
|
|
Contains descriptions of buttons and menu commands. |
Behavior of Bars
All of the bars—except for the menu bar and status bar—are dockable. You can drag the bars to the top, bottom, left, or right sides of the PeopleSoft Application Designer interface.
To float the bars, drag them away from the edges of the PeopleSoft Application Designer interface. You can then resize them vertically and horizontally.
Menu Bar
This section reviews PeopleSoft Application Designer menu commands that you use to create analytic model definitions.
Note. This section does not review all of PeopleSoft Application Designer menu commands.
See Using the PeopleSoft Application Designer Window Components.
This table shows the analytic model definition specific commands in the Edit menu:
|
Edit Menu Commands |
Usage |
Quick Keys |
|
Select to insert a built-in function and its arguments into a rule. |
Ctrl+Shift+F |
|
|
Select to insert a reference to the data cube into a rule. |
Ctrl+Shift+N |
|
|
Insert a reference to a dimension into a rule. After Analytic Calculation Engine inserts the dimension reference, complete the syntax for a member reference. |
Ctrl+Shift+M |
|
|
Insert a reference to a dimension into a rule. |
None |
|
|
Insert a reference to a user function into a rule. |
None |
This table shows the analytic model definition specific commands in the View menu:
|
View Menu Commands |
Usage |
|
Active and deactivate the notes bar. |
|
|
Active and deactivate the rule bar. |
This table shows the analytic model definition specific commands in the Part menu. You can access the same Part menu commands by right-clicking the part or subbranch that you want to add to or edit:
|
Part Menu Commands |
Secondary Menu Commands |
Usage |
Quick Keys |
|
New |
Create a new cube collection. |
Ctrl+L |
|
|
New |
Create a new data cube. |
Ctrl+D |
|
|
New |
Create a new dimension. |
Ctrl+E |
|
|
New |
Create a new user function. |
Ctrl+U |
|
|
New |
Create a new organizer. |
None |
|
|
Attach |
Attach one or more existing data cubes to the selected cube collection. |
Ctrl+S+D |
|
|
Attach |
Attach one or more existing dimensions to the selected data cube. |
Ctrl+Shift+E |
|
|
Move |
Move the selected part one position up in the part browser. |
Alt+Up |
|
|
Move |
Move the selected part one position down in the part browser. |
Alt+Down |
|
|
None |
Make a copy of the selected part. |
None |
|
|
Detach |
Detach one or more data cubes from the selected cube collection. |
None |
|
|
Detach |
Detach one or more dimensions from the selected data cube. |
None |
|
|
None |
Delete the selected parts. |
None |
This table shows the analytic model definition specific commands in the Tools menu:
|
Tools Menu Commands |
Secondary Menu Commands |
Tertiary Menu Commands |
Usage |
Quick Keys |
|
Analytic Model |
None |
Validate the analytic model. |
None |
|
|
Analytic Model |
None |
Find where the current part is used by other parts in the analytic model. |
None |
|
|
Analytic Model |
Causes and Effects Tool... |
None |
Launch the Causes and Effects Tool. |
None |
|
Analytic Model |
Causes |
Display the direct causes of the selected data cubes. |
Alt + < |
|
|
Analytic Model |
Causes |
Display all causes of the selected data cubes. |
None |
|
|
Analytic Model |
Causes |
Display all of the input data cubes that directly or indirectly affect the selected data cubes. |
None |
|
|
Analytic Model |
Effects |
Display the direct effects of the selected data cubes. |
Alt + > |
|
|
Analytic Model |
Effects |
Display all effects of the selected data cubes. |
None |
|
|
Analytic Model |
Circular Formulas |
Show the data cubes involved in the circular system. |
None |
Part Browser
The part browser is a treelike structure whose main branch is the analytic model itself. The main branch contains several subbranches, as described in this table:
|
Branch |
Description |
|
Contains a subbranch for each cube collection in the analytic model. Double-click a cube collection to edit the cube collection's properties. Expand a cube collection to view all of the dimensions and data cubes in a cube collection. Click a dimension or data cube to edit its properties. |
|
|
Contains a subbranch for each data cube in the analytic model. Click a data cube to edit its properties. Expand a data cube view all of the dimensions that are attached to the data cube. Click a dimension to edit its properties. |
|
|
Displays each dimension in the analytic model. Click a dimension to edit its properties. |
|
|
Displays each user function in the analytic model. Click a user function to edit its properties. |
|
|
Contains a subbranch for each organizer in the model. Expand the organizers to view the parts within the organizers. |
Dragging and Dropping Parts in the Part Browser
You can drag and drop parts in the part browser to:
Add new data cubes to cube collections.
Attach data cubes to dimensions.
Rearrange the order of dimensions.
Rearrange the hierarchy of organizers.