Viewing Recruiting Pivot Grids
This topic discusses recruiting pivot grids.
Note: Pivot grids are accessed from pagelets. Pagelets can be added to a user’s PeopleSoft home page or to the Recruiting Home Page.
|
Pivot Grid Name |
Definition Name |
Usage |
|---|---|---|
|
View the number of openings that were opened and closed each month. |
|
|
View the number of open job openings of various ages. |
|
|
HRS_PG_INPRC_APPL |
View the distribution of dispositions for your active applicants. |
|
|
View the average number of days to fill job openings by month. |
PeopleSoft Pivot Grid is a PeopleTools technology that provides actionable operational analytics using charts and grids. Pivot grids enable users to visually display real-time data and organize it on the fly by pivoting and filtering. The self-service, multi-dimensional analytics provided by PeopleSoft Pivot Grid provides users with the business intelligence needed to make informed decisions.
Recruiting Solutions delivers four pivot grids that provide graphic views of important performance measures:
The Job Opening Open and Close Trend chart shows data related to the number of openings that are opened and closed on a monthly basis, giving users a picture of hiring activity across time, departments and locations.
The Job Opening Aging Analysis chart shows the number of open job openings in various pre-defined age bands, providing vital information about an organization’s recruiting backlog.
The In Process Applicants chart shows the distribution of dispositions for applicants who are being considered for job openings, offering a view of the applicant pipeline.
The Time to Fill chart shows monthly average Time to Fill data, helping users to see trends in their ability to fill job openings.
Note: This data is available to recruiters, recruiting managers, recruitment administrators, and hiring managers based on their security acess, or if they are part of the hiring team. They can access the pivot data through various pagelets.
For more information on the setup and capabilities of PeopleSoft Pivot Grid, see PeopleTools: Pivot Grid.
These page controls appear on all Recruiting pivot grids:
Field or Control |
Description |
|---|---|
|
Click to open the Options Menu, then select from these menu items:
|
Filters |
Displays drop-down list boxes that you use to filter the data to be displayed in the chart. |
<Drilldown Menu> |
When you click a data element (for example, a bar on a bar chart), a menu provides these options:
|
Use the Job Opening Open and Close Trend pivot grid to view the number of openings that were opened and closed each month.
Navigation:
This pivot grid is accessed from pagelets that you can add to your PeopleSoft home page or to the Recruiting Home Page.
On the My Job Openings pagelet, click the My Job Openings Analytics link, then click the Job Opening Open and Close Trend option.
On the Recruiting Manager Summary pagelet, click the Recruiting Manager’s Analytics link, then click the Job Opening Open and Close Trend option.
This example illustrates the Job Opening Open and Close Trend pivot grid.
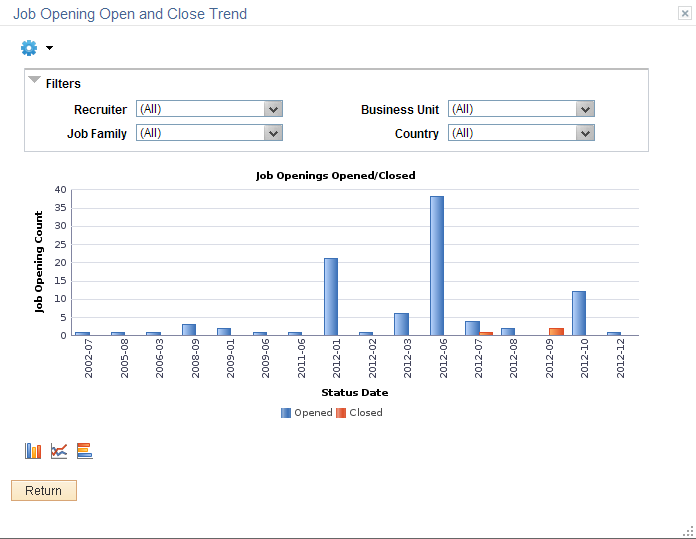
The Job Opening Open and Close Trend pivot grid displays monthly job opening data. By default, the data appears as a bar chart. For each month, one bar represents the number of job openings that were opened, and a second bar represent the number of job openings that were filled.
The opening date for a job opening is considered to be the earliest posting date or, if there are no postings defined, the actual job opening date. The closing date is the date that the job opening status changed to Filled/Closed.
Chart Content and Layout
The following table describes options for manipulating the chart:
|
Option |
Details |
|---|---|

Prompts |
Enter the From Date and To Date to define the date range for the pivot grid. Initially, the chart displays data for the past year. |
|
Filters |
|
|
Drill-down options |
|
|
Chart type options |
|
Use the Job Opening Aging Analysis pivot grid to view the number of open job openings of various ages.
Note: Continuous job openings, which remain open indefinitely, are not included in the data for this chart.
Navigation:
This pivot grid is accessed from pagelets that you can add to your PeopleSoft home page or to the Recruiting Home Page.
On the My Job Openings pagelet, click the My Job Openings Analytics link, then click the Job Opening Aging Analysis option.
On the Recruiting Manager Summary pagelet, click the Recruiting Manager’s Analytics link, then click the Job Opening Aging Analysis option.
This example illustrates the Job Opening Aging Analysis pivot grid.
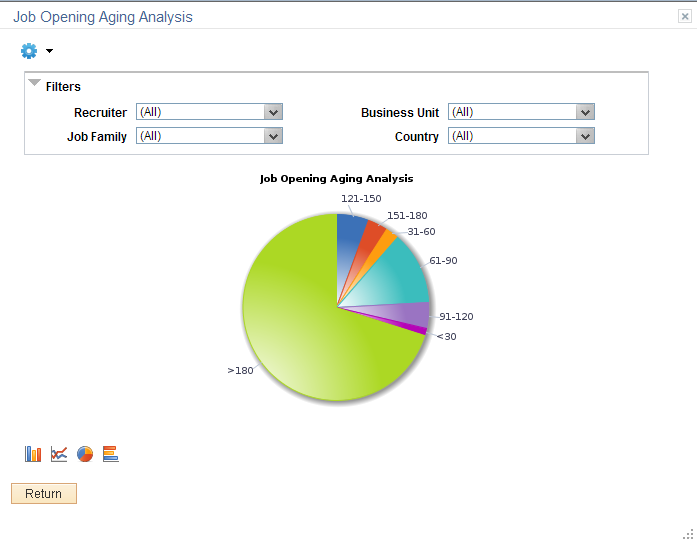
The Job Opening Aging Analysis pivot grid displays counts of open job openings in predetermined age bands. The age bands are <30 days, 31–60 days, 61–90 days, 91–120 days, 121–150 days, 151–180 days, and > 180 days.
A job’s age is the number of days since the earliest posting date or, if no postings exist, the number of days since the date the job was opened.
By default, the data appears as a pie chart.
Chart Content and Layout
The following table describes options for manipulating the chart:
|
Option |
Details |
|---|---|
|
Prompts |
Enter the From Date to define the date range for the pivot grid. Only jobs opened on or after the specified date are included in the chart. Initially, the chart includes data for jobs that were opened within the past year. Note: Because the My Job Openings pagelet shows jobs based on the creation date, not the posting date, the number of job openings represented in the chart does not necessarily match the number in the pagelet even when both are looking at data from the same period of time. |
|
Filters |
|
|
Drill-down options |
|
|
Chart type options |
|
Use the In Process Applicants pivot grid to view the distribution of dispositions for applicants who are being considered for job openings.
Navigation:
This pivot grid is accessed from the My Applicants pagelet. You can add this pagelet to your PeopleSoft home page or to the Recruiting Home Page.
On the My Applicants pagelet, click the My Applicants Analytics link, then click the In Process Applicants option.
This example illustrates the In Process Applicants pivot grid.
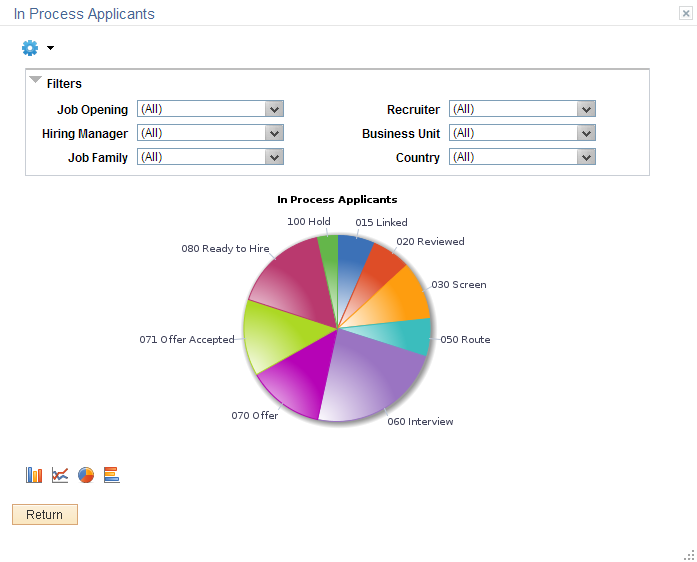
The In Process Applicants pivot grid displays counts of applicants in various dispositions. The chart shows all in-use dispositions except Draft and Reject.
By default, the data appears as a pie chart.
Chart Content and Layout
The following table describes options for manipulating the chart:
|
Option |
Details |
|---|---|
|
Prompts |
Enter the From Date and To Date to define the date range for the pivot grid. Only applications that were created within the specified date range are included in the chart. Enter Y (yes) or N (no) in the Include Applied Status field to determine whether the chart includes applications in the default disposition that is assigned when the application is first submitted. The delivered default disposition is Applied. Initially, the chart includes data for jobs that were opened within the past year, and it does not include applications in the default (Applied) disposition. |
|
Filters |
|
|
Drill-down options |
|
|
Chart type options |
|
Use the Time to Fill pivot grid to view the average number of days to fill job openings by month.
Navigation:
This pivot grid is accessed from pagelets that you can add to your PeopleSoft home page or to the Recruiting Home Page.
A simplified version of this pivot grid appears directly on the Time to Fill pagelet.
On the Time to Fill pagelet, click the Time to Fill Analytics link, then click the Time to Fill option.
On the Recruiting Manager Summary pagelet, click the Recruiting Manager’s Analytics link, then click the Time to Fill option.
This example illustrates the Time to Fill pivot grid.
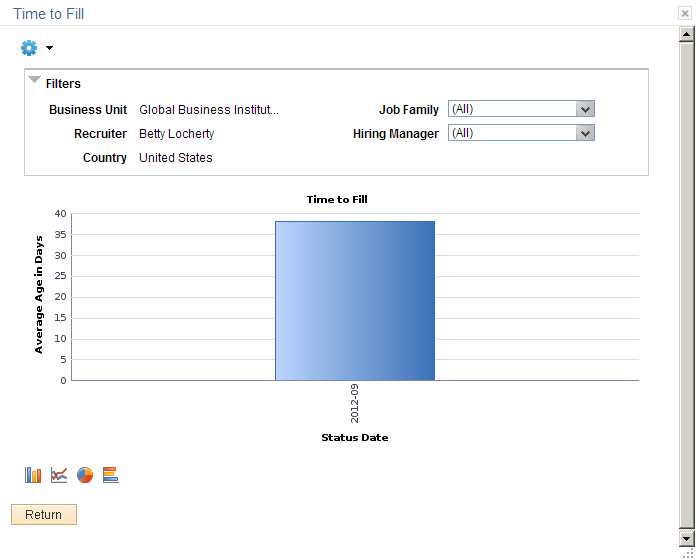
The Time to Fill pivot grid displays the average days taken to fill the job openings that are closed in a particular month.
Chart Content and Layout
The following table describes options for manipulating the chart:
|
Option |
Details |
|---|---|
|
Prompts |
|
|
Filters |
|
|
Drill-down options |
|
|
Chart type options |
|