Using the PeopleSoft Fluid User Interface to View Recruiting Manager Summary
This topic discusses how Recruiting Managers use the fluid Recruiting Manager Summary page to view summary information about the workload and effectiveness of recruiters who report to the current user. It also provides access to recruiting pivot grids that provide actionable operational analytics.
Note: Only users with the Recruiting Manager Fluid role can access this tile on the Fluid Recruiting Homepage.
For general information about fluid pages in PeopleSoft HCM, see Understanding PeopleSoft Fluid User Interface Homepages.
|
Page Name |
Definition Name |
Usage |
|---|---|---|
|
HC_HRS_MGR_SUMM_FLU_GBL (cref for the tile) |
To access the Recruiting Manager Summary page. |
|
|
HRS_MGR_SUMM_FLU |
View summary information about the workload and effectiveness of recruiters who report to you. This page shows information for direct reports only, not for the user’s entire organization. |
Recruiting Managers use the Recruiting Manager Summary tile (cref for the tile: HC_HRS_MGR_SUMM_FLU_GBL) to access the Recruiting Manager Summary page.
Navigation:
The Recruiting Manager Summary tile is an optional tile on the delivered Fluid Recruiting Homepage.
This example illustrates the Recruiting Manager Summary tile.
Recruiting Managers use the Recruiting Manager Summary page (HRS_MGR_SUMM_FLU) to view summary information about the workload and effectiveness of recruiters who report to them. This page shows information for direct reports only, not for the user’s entire organization.
Note: This page supports up to 300 direct reports. If a user with more than 300 direct reports attempts to use this page, the grid will stop after loading data for 300 direct reports, and the system will display a message to the user.
Navigation:
Click the Recruiting Manager Summary tile on the delivered Fluid Recruiting Homepage.
This example illustrates the fields and controls on the Recruiting Manager Summary page.
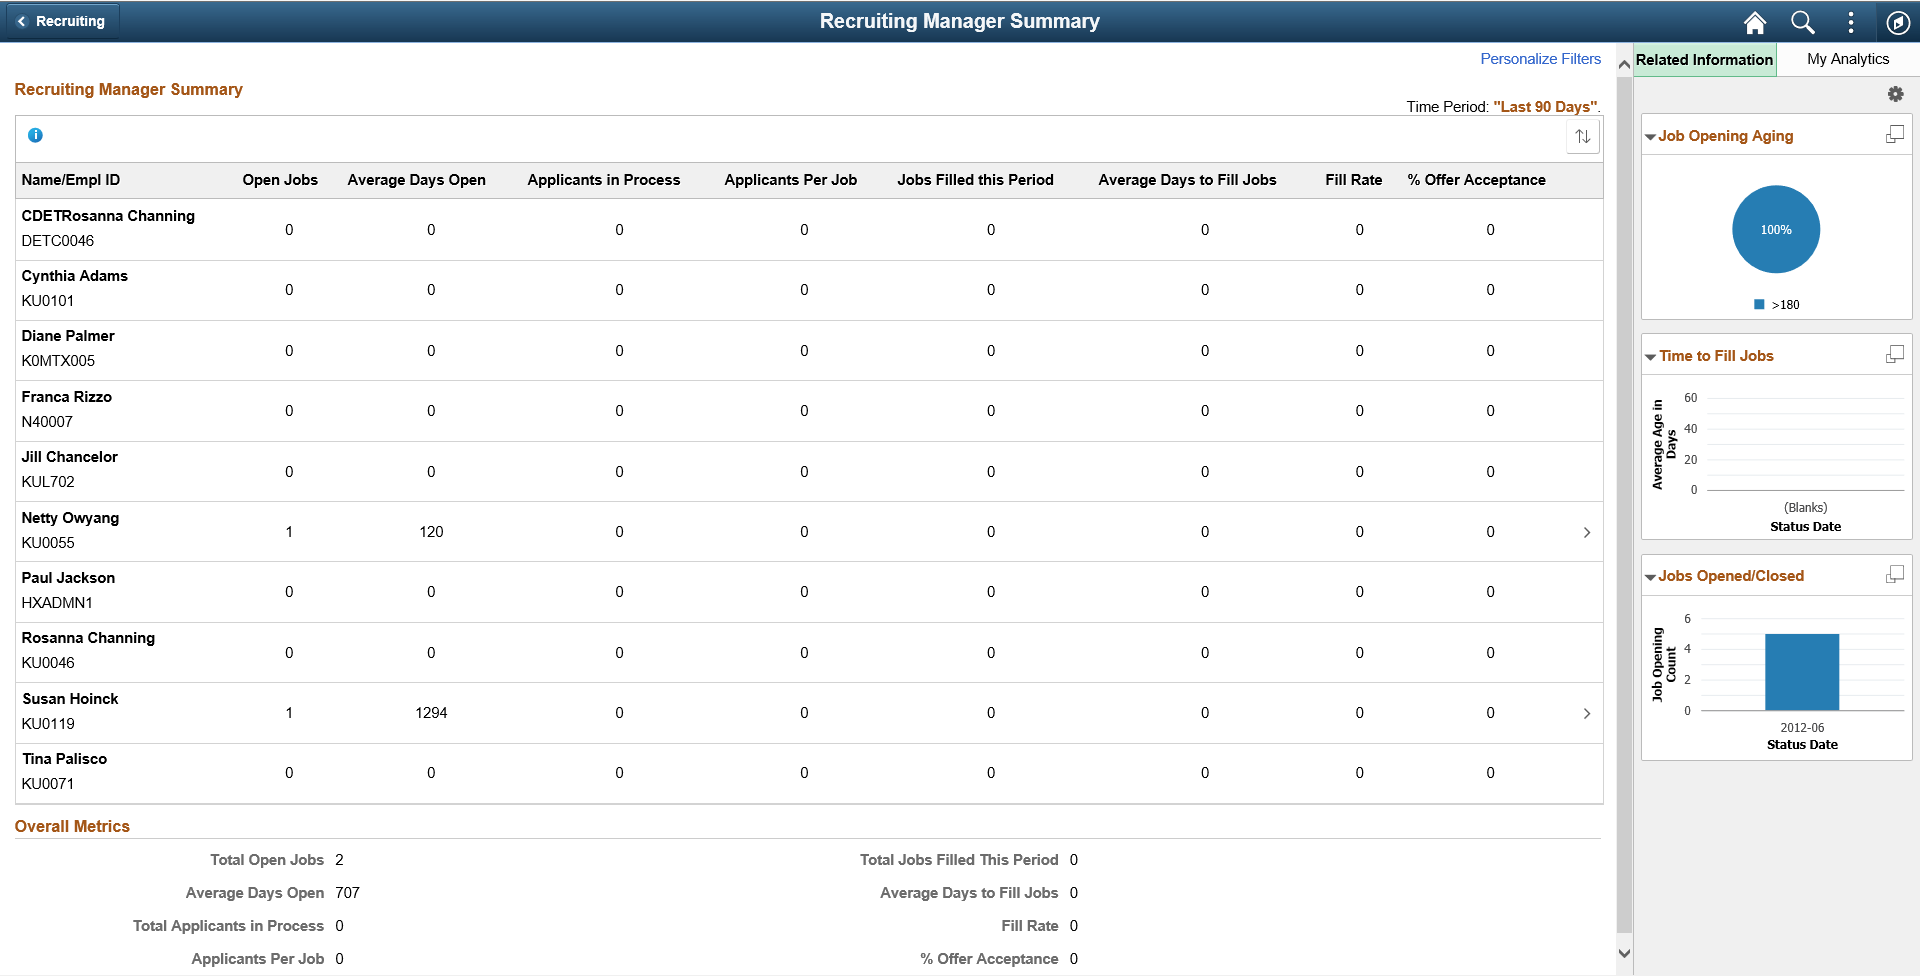
The Recruiting Manager Summary page shows a variety of metrics to gauge the workload and effectiveness of a recruiting manager’s direct reports. All metrics are based on job openings where the direct report is the primary recruiter.
Click on any direct report’s row to access the Browse Job Openings Page pre-filtered to show that direct report's open job openings.
Personalizing Filters
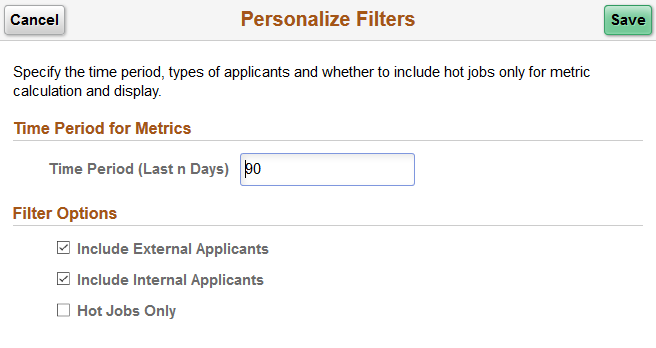
Click the Personalize Filters link to choose the time period to include in the recruiting manager metrics and to set filter options to control which types of applicants and job openings are included.
This example illustrates the Personalize Filters modal window.
Time Period for Metrics
Field or Control |
Description |
|---|---|
Time Period (Last n Days) |
Enter the number of days before today that the time period for recruiting manager metrics starts. The default value is 90. |
Filter Options
Field or Control |
Description |
|---|---|
Include External Applicants and Include External Applicants |
Select one or both of these check boxes to indicate which types of applicants to include in the recruiting manager metrics. By default, both check boxes are selected. |
Hot Jobs Only |
Select this check box to exclude job openings that are not hot jobs from the recruiting manager metrics. By default, this check box is deselected. |
Determination of Direct Reports
The system determines the user’s direct reports based on the access type specified on the Target Information Page. As delivered, the Recruiting Manager Summary page uses the access type By Part Posn Mgmt Supervisor (By Partial Position Management Supervisor).
Metrics for Direct Reports
Field or Control |
Description |
|---|---|
Name |
Displays the name of the direct report. |
Open Jobs |
Displays the number of open job openings where the direct report is the primary recruiter. Click the link to access the Browse Job Openings page pre-filtered to show the direct report’s open job openings. |
Average Days Open |
Displays the average number of days that the jobs included in the Open Jobs count have been open. The average is rounded to the nearest whole number. The days open for a job opening is the number of days since the job opening’s earliest posting date. If the job has never been posted, the days open is the number of days since the job opening was created. If the earliest job posting date (or, if none, the job creation date) is in the future, the days open is 0. |
Applicants in Process |
Displays the number of active applicants for the jobs included in the Open Jobs count. Applicants are considered active if they have non-Draft dispositions in any phase other than Reject or Hold. |
Applicants per Job |
Displays the average number of applicants per job opening based on the values in the Open Jobs field and the Applicants in Process field. The average is rounded to the nearest whole number. |
Jobs Filled this Period |
Displays how many of the direct report’s job openings were filled during the period specified on the page’s personalization page. This includes only job openings where the direct report is the Primary Recruiter. Job openings are considered filled when the status changes to the status configured as the “Complete” job opening status. Under the delivered status configuration, this is the 110 Filled/Closed status. |
Average Days to Fill Jobs |
Displays the average number of Days to Fill for the jobs filled this period. The average is rounded to the nearest whole number. A job opening’s Time to Fill is the number of days between the earliest post date for the opening and the date when the job opening is filled. If the job opening was never posted, then Time to Fill is measured from the job opening creation date. If the job was filled before the earliest posting date (or, if the job wasn’t posted, before the job creation date), the Days to Fill is zero. |
Fill Rate |
Displays the direct report’s fill rate, which is the Jobs Filled This Period value as a percentage of the number of open jobs during the same period. The fill rate is rounded to the nearest whole number. The number of jobs open during the period includes openings that were open at beginning of period and openings that were opened during the period. Cancelled jobs are removed from the equation. |
% Offer Acceptance |
Displays the direct report’s offer acceptance rate, which is the number of offers accepted as a percentage of the number of offers extended during the same period. The offer acceptance rate is rounded to the nearest whole number. |
Overall Metrics
The Overall Metrics group box displays summary data for all of the recruiting manager’s direct reports. The fields are the same as those in the Direct Reports grid, but the values in the grid are aggregated to produce the overall metrics.
Related Content and Decision Support
If you use PeopleTools 8.55 or later, the Recruiting Manager Summary page includes a supplementary panel that provides access to related information and Simplified Analytics.
For more information about Simplified Analytics, refer to the Simplified Analytics topics in the PeopleTools: Pivot Grid documentation.
Field or Control |
Description |
|---|---|
|
Click this icon to open the supplementary panel. The panel displays tabs for Related Information and My Analytics. |
Related Information |
Click to display a menu listing the pivot grids, then select one of the following pivot grids to display:
For more information, see Viewing Recruiting Pivot Grids Note: The pivot grids when accessed from the Recruiting Manager Summary page display data for all of the user’s direct reports rather than just displaying the user’s own data. |
|
This icon appears at the top of the Related Information tab. Click to open the Personalize Related Content page. This page lists the available related content so you can choose whether the Related Information tab shows or hides each item. |
|
This icon appears at the top of each individual item in the Related Information tab. Click to expand the item to open a modal dialog with a larger interactive version of the chart. |
My Analytics |
The My Analytics tab provides access to the Simplified Analytics capabilities provided by PeopleTools 8.55 and later. Click the plus button to create a new chart, or Click an existing chart to view details. The delivered role PivotGridSuperUser gives users the ability to create and publish reports. This video provides additional information about Simplified Analytics: Video: PeopleSoft HCM 9.2 Image 18 Highlights: Simplified Analytics |
 (Supplementary Panel button)
 (Personalize Related Content icon)