Using the Processing Monitor
|
Page Name |
Definition Name |
Usage |
|---|---|---|
|
GP_CS_POP_RCNTL |
Update Processing Monitor data for a calendar group. |
|
|
HC_GP_WC_PROC_MON_FL_GBL |
Access the Processing Monitor - By Calendar Group page. |
|
|
GP_CS_STAT1 |
View detailed processing statistics for calendar groups. |
|
|
GP_CS_STAT2 |
View detailed processing statistics for calendars. |
The Processing Monitor component provides a comprehensive set of processing statistics along with graphical representations of those statistics. The statistical information displayed on this page includes:
Counts by selection, calculation, and segment status. This information is further broken down by the Absence and Payroll calculation types.
Summarized gross pay and net pay results for payroll calculations.
Summarized accumulator results for absence calculations.
The Processing Monitor presents this information by calendar group and by individual calendar.
Note: You cannot use the Processing Monitor to review processing statistics for off-cycle calendars.
Updating Processing Monitor Data
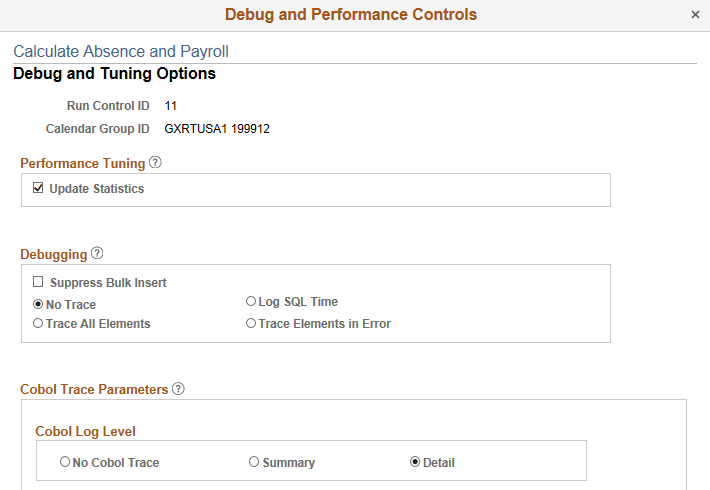
The system updates the data presented in the Processing Monitor during absence and payroll calculation batch processing. You can disable the portion of the batch process that updates the Processing Monitor by deselecting the Update Processing Monitor check box on the Debug and Tuning Options page.
This is an example of the Debug and Tuning Options page.
You can also update Processing Monitor data for a specific calendar group using the Update Processing Monitor Data page.
Use the Update Processing Monitor Data page (GP_CS_POP_RCNTL) to update Processing Monitor data for a calendar group.
Note: This is a secondary process for updating Processing Monitor data. Typically, the system updates Processing Monitor data during absence and payroll calculation batch processing.
Navigation:
This example illustrates the fields and controls on the Update Processing Monitor Data page.
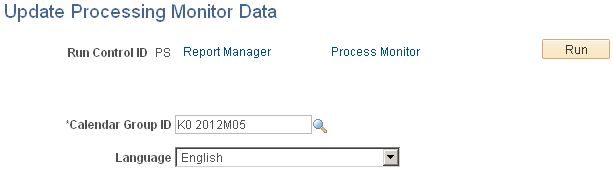
Select a Calendar Group ID and click the Run button. The Update Processing Monitor Data (GP_CS_POP_ST) application engine program updates the Processing Monitor data for the selected calendar group.
Note: If you update the Processing Monitor as part of the absence and payroll calculation batch process, you do not need to update it using the Update Processing Monitor Data process. For more information, see the documentation for the Debug and Tuning Options Page.
Use the Global Payroll Process Monitor tile (HC_GP_WC_PROC_MON_FL_GBL) to access the Processing Monitor - By Calendar Group page.
Navigation:
You can add the delivered Global Payroll Process Monitor tile to your fluid home pages.
This example illustrates the Global Payroll Process Monitor tile.
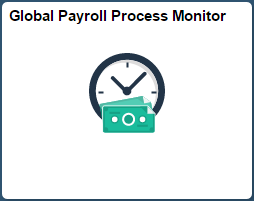
Click the tile to access the page in the classic user interface.
Use the Processing Monitor - By Calendar Group page (GP_CS_STAT1) to view detailed processing statistics for calendar groups.
Navigation:
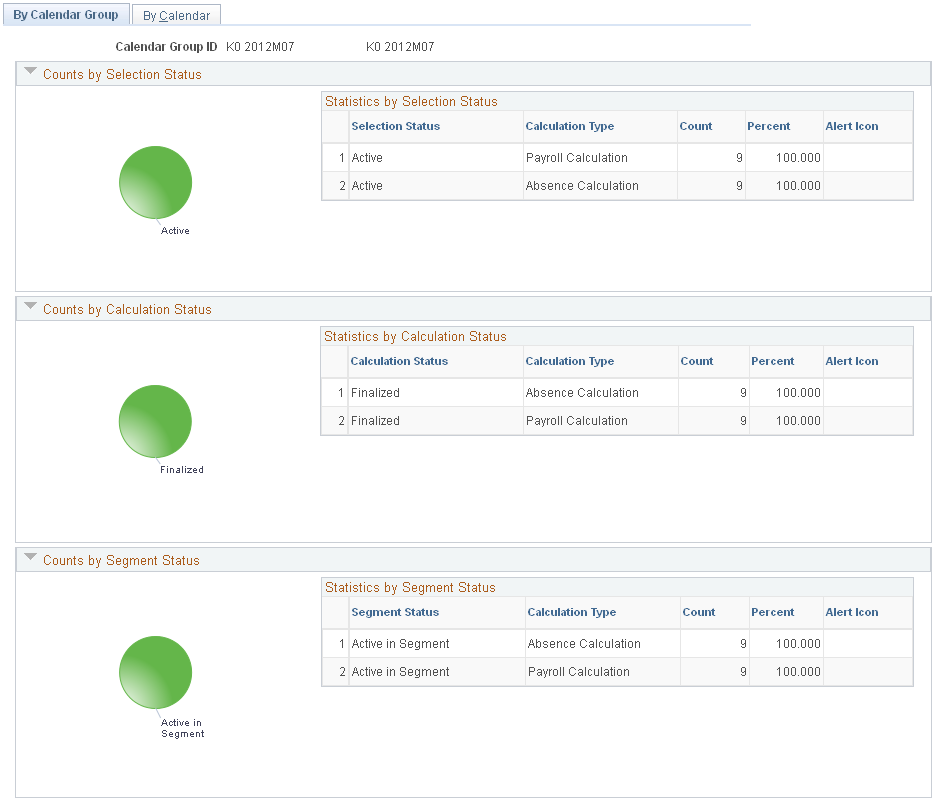
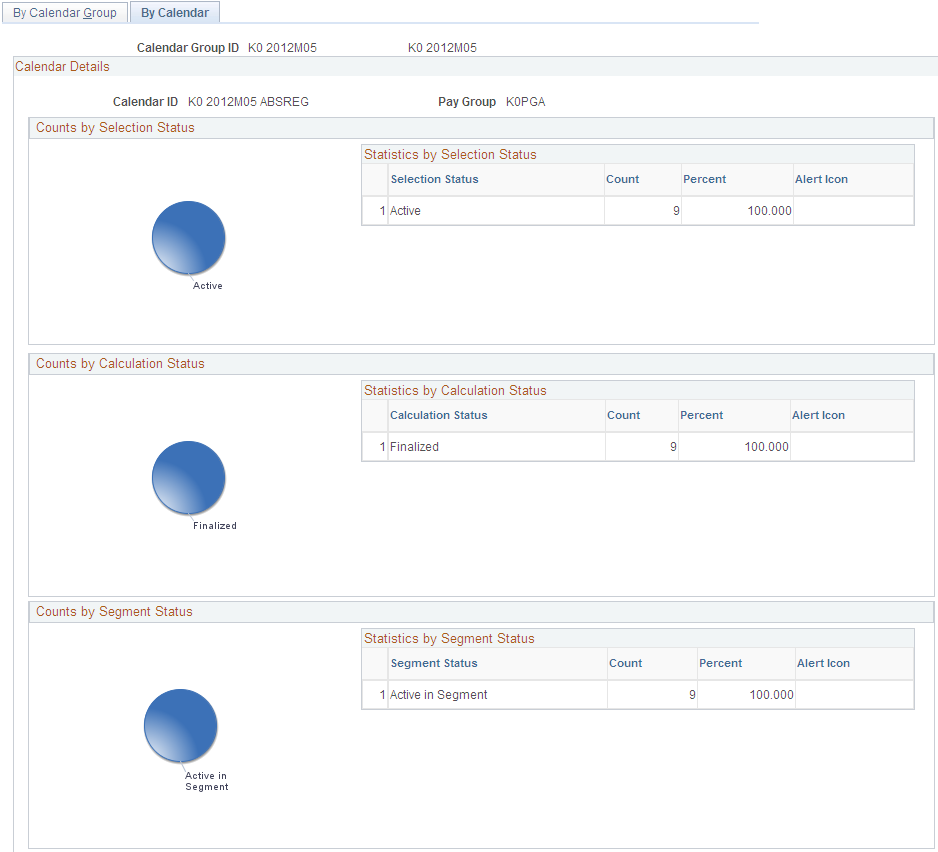
This example illustrates the fields and controls on the Processing Monitor - By Calendar Group page (1 of 2).
This example illustrates the fields and controls on the Processing Monitor - By Calendar Group page (2 of 2).
Note: The Processing Monitor displays results from the first version (V1) and revision (R1) in the case of retroactive processing.
For more information on retroactive processing, see Understanding General Rules of Retroactive Processing.
Counts by Selection Status
This section of the page includes a Statistics by Selection Status grid that presents processing statistics organized by Selection Status and Calculation Type. For each combination of selection status and calculation type that exists, the grid displays a row that includes a Count, a Percent, and an Alert if applicable.
To the left of the Statistics by Selection Status grid, the Counts by Selection Status section includes a pie chart that provides a graphical representation of the processing statistics presented in the grid.
Counts by Calculation Status
This section of the page includes a Statistics by Calculation Status grid that presents processing statistics organized by Calculation Status and Calculation Type. For each combination of calculation status and calculation type that exists, the grid displays a row that includes a Count, a Percent, and an Alert if applicable.
To the left of the Statistics by Calculation Status grid, the Counts by Calculation Status section includes a pie chart that provides a graphical representation of the processing statistics presented in the grid.
Counts by Segment Status
This section of the page includes a Statistics by Segment Status grid that presents processing statistics organized by Segment Status and Calculation Type. For each combination of segment status and calculation type that exists, the grid displays a row that includes a Count, a Percent, and an Alert if applicable.
To the left of the Statistics by Calculation Status grid, the Counts by Calculation Status section includes a pie chart that provides a graphical representation of the processing statistics presented in the grid.
Note: For the Counts by Selection Status, Counts by Calculation Status, and Counts by Segment Status sections, you determine what triggers this page to display alert icons by defining status key threshold definitions on the Monitor Configuration Page.
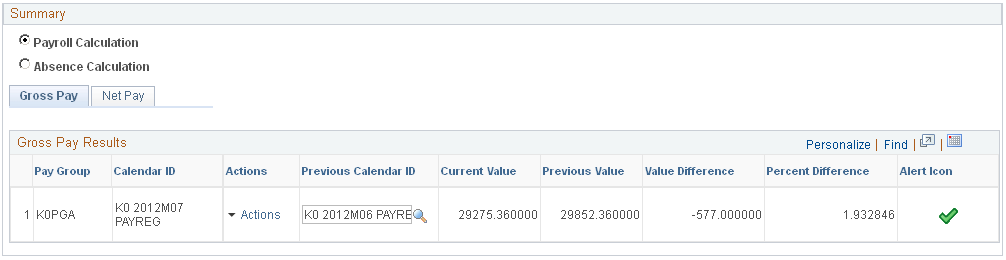
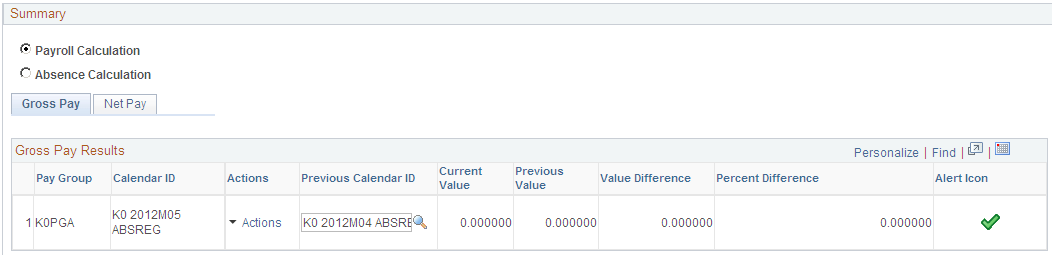
Summary
This section displays a summary of payroll and absence calculation results.
Note: The Payroll Calculation and Absence Calculation options appear in this section only if you select a value in the Element List Set field of the Monitor Configuration Page. If no element list set is selected, this section displays only payroll calculation results. Additionally, if you select Other as the Payroll System on the Monitor Configuration page, this section does not display any payroll calculation results.
Field or Control |
Description |
|---|---|
Payroll Calculation |
Select this option to display a summary of payroll calculation results in the Summary section of the page. When you select this option, the page displays two tabs of payroll calculations results: Gross Pay and Net Pay. |
Absence Calculation |
Select this option to display a summary of absence calculation results in the Summary section of the page. When you select this option, the page displays a tab for each element group associated with the element list set that you selected on the Monitor Configuration page. For each element group tab, the system displays a link for each absence accumulator that is a member of that element group. |
This example illustrates the Summary section of the Processing Monitor - By Calendar Group page with the Absence Calculation option selected.
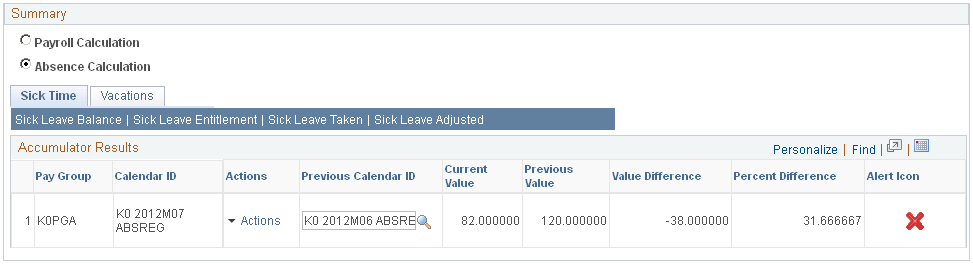
For gross pay, net pay, and each absence accumulator, the grid displays a row for each pay group.
Field or Control |
Description |
|---|---|
Actions |
Click to access links to additional information for the row. Available actions are:
|
Previous Calendar ID |
Select the previous calendar to which you want to compare your current results. By default, the system populates this field with the calendar that immediately precedes the current calendar. Only finalized calendars associated with the respective pay group are available to select in this field. |
Current Value |
Displays the current calendar’s value for gross pay, net pay, or an absence accumulator. |
Previous Value |
Displays the previous calendar’s value for gross pay, net pay, or an absence accumulator. |
Value Difference |
Displays the difference between the current value and previous value for gross pay, net pay, or an absence accumulator. |
Percent Difference |
Displays the percentage of difference between the current value and previous value for gross pay, net pay, or an absence accumulator. |
Alert Icon |
Displays the appropriate alert icon based on the value of the Percent Difference field. Note: You determine which icons correspond to which percentages of difference by defining results threshold definitions on the Monitor Configuration Page. |
Department ID Analysis Pivot Grid
When you click the Action link in the Summary portion of the Processing Monitor, select View Department ID Analysis to access the View Department ID Analysis pivot grid.
This example illustrates the fields and controls on the View Department ID Analysis page.
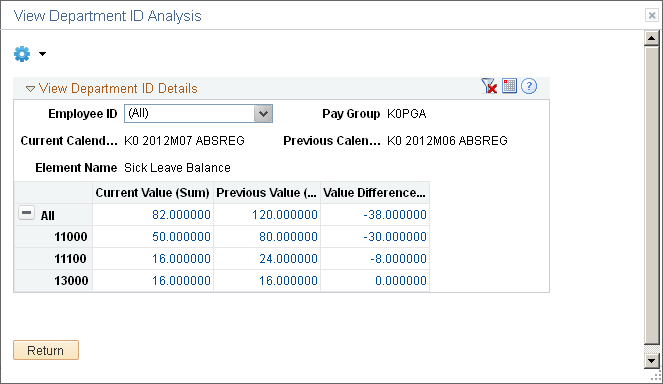
When fully expanded, this pivot grid shows the current value and value difference for the gross pay, net pay, or absence accumulator for each department associated with a specific pay group and calendar ID.
Field or Control |
Description |
|---|---|
|
Click the Options Menu button and select Prompts to select a different previous period for the department ID analysis. |
Employee ID |
Select the employees for which you want to filter the department details. You can click and drag this field to the column listing the departments to view the Current Value and Value Difference by employee for each department. |
Current Value |
Displays the current value for gross pay, net pay, or an absence accumulator. You can click on a link in this column to access the Pivot Grid Drilldown page where you can view payee-specific details. |
Previous Value |
Displays the previous value for gross pay, net pay, or an absence accumulator. You can click on a link in this column to access the Pivot Grid Drilldown page where you can view payee-specific details. |
Value Difference |
Displays the value difference for gross pay, net pay, or an absence accumulator. You can click on a link in this column to access the Pivot Grid Drilldown page where you can view payee-specific details. |

This example illustrates the fields and controls on the Pivot Grid Drilldown page.
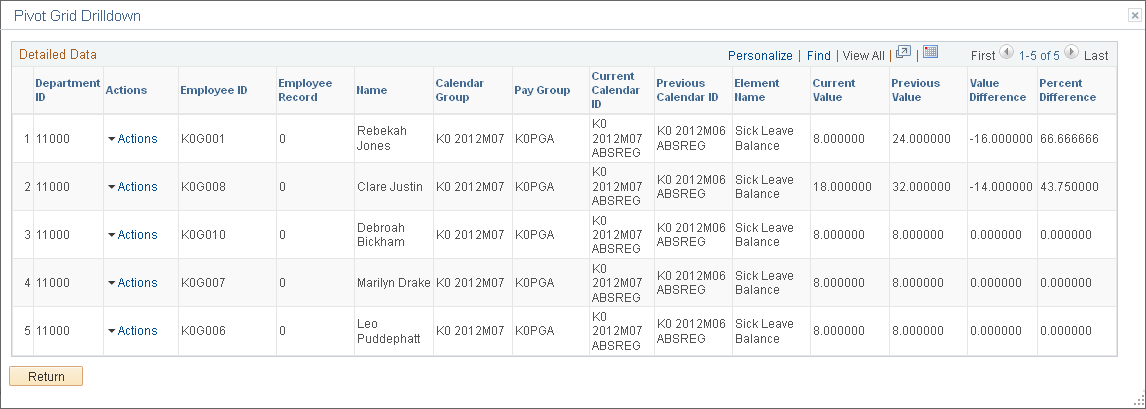
Field or Control |
Description |
|---|---|
Actions |
Click to access the View Employee Results link that you can use to access the Results by Calendar - Calendar Results page for the employee. |
For more information on pivot grids, see the product documentation for PeopleTools: Pivot Grid.
Use the Processing Monitor - By Calendar page (GP_CS_STAT2) to view detailed processing statistics for calendars.
Navigation:
This example illustrates the fields and controls on the Processing Monitor - By Calendar (1 of 2).
This example illustrates the fields and controls on the Processing Monitor - By Calendar (2 of 2).
The fields on this page are identical to those on the Processing Monitor - By Calendar Group Page.