Reviewing Control Plan Performance
This topic provides an overview of the Control Plan Performance component.
|
Page Name |
Definition Name |
Usage |
|---|---|---|
|
QS_STRMRVW_SEL |
Select a control plan and specify the timeframe from which you want to extract information. |
|
|
QS_STRMRVW_GEN |
View summary information for all process streams in the control plan. |
|
|
Compare Data Statistic Page |
QS_ANLZ_STSSUM_SPG |
Select the statistic for comparison. |
|
Compare Dataset Statistics Page |
QS_BARGRAPH_RVW |
View a bar graph comparing the selected statistics for all characteristics in the control plan. |
|
QS_SGRP_DET_PNL |
View subgroup results associated with a selected process stream. |
|
|
QS_STRMRVW_STS |
View basic statistics by stream. |
|
|
QS_STRMRVW_STS2 |
Display capability indices by stream. |
|
|
QS_STRMRVW_STS4 |
View attribute statistics associated with the defects or defectives characteristics for the control plan. |
You can monitor process performance using the Review Control Plan Performance component. For example, you can assess key statistics, perform graphical analysis, and, if needed, post probable causes and corrective actions. The inquiry is similar to creating a quality data extraction, but does not require the SQL-like qualification of plan hierarchy fields. Instead, you enter the specific hierarchy field values related to the control plan. These pages produce a quick snapshot of the process data over a specified period of time.
In addition, the process information on these pages can be downloaded in the form of a quality application client dataset and used for exploratory analysis off-line.
Note: This option is available if the Quality application client is installed.
Use the Selection Criteria page (QS_STRMRVW_SEL) to select a control plan and specify the timeframe from which you want to extract information.
Navigation:
This example illustrates the fields and controls on the Selection Criteria page. You can find definitions for the fields and controls later on this page.
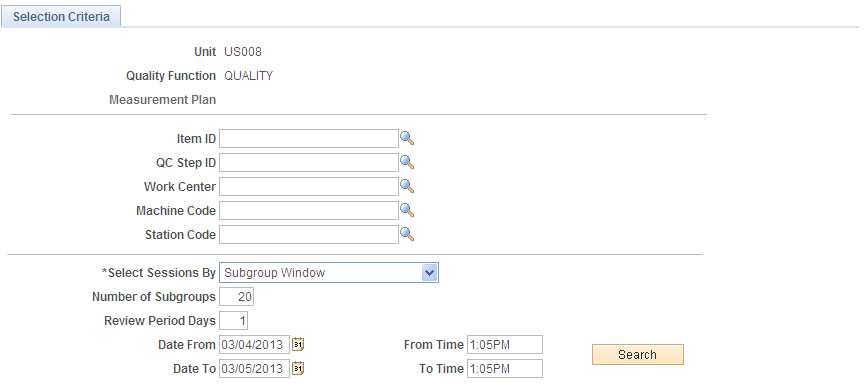
Select the specific hierarchy fields in the upper portion of the page associated with the control plan for which you want to review performance. The hierarchy fields vary depending on the quality function that you select.
Field or Control |
Description |
|---|---|
Select Sessions By |
Select the time frame for which you want to view the control plan performance. Values include: All Subgroups: Retrieves all subgroups for the process. Note: Selecting All Subgroups against high-volume processes may cause longer processing times. Daily Window: Retrieves data starting from a specified number of days from the current date and time. Enter the number of days to subtract from the current date in the Review Period Days field. Specific Date Range: Selects data within a specific date range. Enter the date from and from time, as well as the date to and to time. Subgroup Window: Selects the most current N subgroups completed. Enter the number of subgroups that you want in the Number of Subgroups field. |
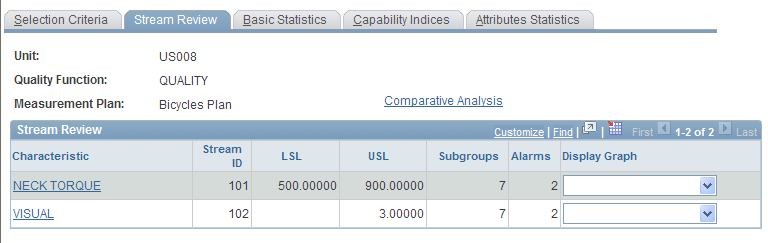
Use the Stream Review page (QS_STRMRVW_GEN) to view summary information for all process streams in the control plan.
Navigation:
This example illustrates the fields and controls on the Stream Review page. You can find definitions for the fields and controls later on this page.
Field or Control |
Description |
|---|---|
Comparative Analysis |
Click this link to view a bar graph comparing selected statistics for all characteristics in the control plan. |
Characteristic (Display Detail) |
Click this link to access the Subgroup Detail page for that characteristic. The Subgroup Detail page lists the subgroup values that you selected and used to calculate the summary display. |
Stream ID |
Displays a unique process stream that was defined by the system. |
LSL (lower specification limit) |
Displays the current lower specification limit. |
USL (upper specification limit) |
Displays the current upper specification limit. |
Subgroups |
Displays the number of subgroups the system retrieves and uses for performance estimates. |
Alarms |
Displays the number of alarms occurring for the subgroup during the time period. |
Display Graph |
Select the type of graph that you would like to review for this characteristic. Values are Control Chart, Histogram, Pareto of Alarms, Pareto of Comments, Pareto of Corrective Actions, Pareto of Defects, and Pareto of Probable Causes. |
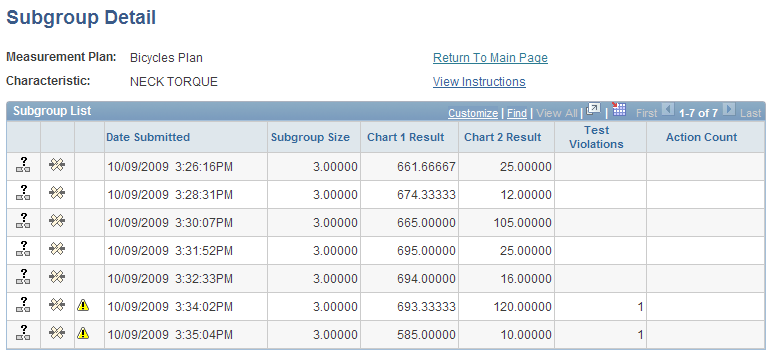
Use the Subgroup Detail page (QS_SGRP_DET_PNL) to view subgroup results associated with a selected process stream.
Navigation:
Click the Characteristic (Display Detail) link on the Stream Review page.
This example illustrates the fields and controls on the Subgroup Detail page. You can find definitions for the fields and controls later on this page.
Field or Control |
Description |
|---|---|
Date Submitted |
Displays the date and time that the subgroup was entered. |
Subgroup Size |
Displays the subgroup sample size. |
Chart 1 Result |
Displays the calculated subchart 1 plot value. |
Chart 2 Result |
Displays the calculated subchart 2 plot value. |
Test Violations |
Displays the number of test violations detected for this subgroup. |
Action Count |
Displays the number of corrective actions logged against this subgroup. |
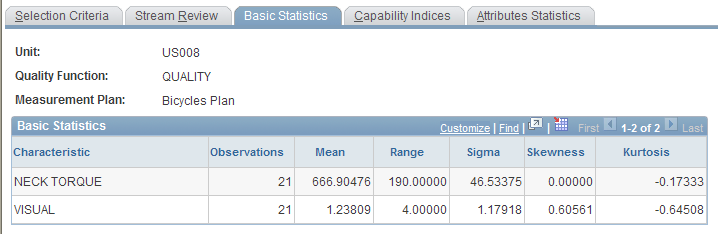
Use the Basic Statistics page (QS_STRMRVW_STS) to view basic statistics by stream.
Navigation:
This example illustrates the fields and controls on the Basic Statistics page. You can find definitions for the fields and controls later on this page.
Field or Control |
Description |
|---|---|
Observations |
Displays the number of discrete observations used to in the statistical calculations. |
Mean |
Displays the statistical mean. |
Range |
Displays the range. |
Sigma |
Displays the standard deviation. |
Skewness |
Displays the skewness. |
Kurtosis |
Displays the kurtosis. |
Use the Capability Indices page (QS_STRMRVW_STS2) to display capability indices by stream.
Navigation:
This example illustrates the fields and controls on the Capability Indices page. You can find definitions for the fields and controls later on this page.
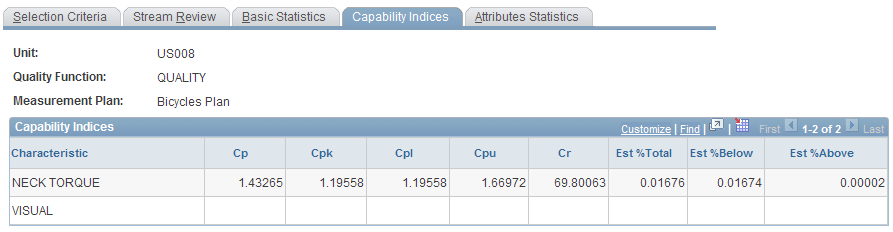
The system displays the process capabilities that are industry-accepted estimates calculated for each characteristic in the control plan.
Field or Control |
Description |
|---|---|
Cp |
Process potential. |
Cpk |
Process capability. |
Cpl |
Lower process capability. |
Cpu |
Upper process capability. |
Cr |
Capability ratio. |
Est % Total (estimated percent total), Est % Below (estimated percent below), and Est % Above (estimated percent above) |
Displays the estimated total percentage of units predicted to be out of specification. |
Use the Attributes Statistics page (QS_STRMRVW_STS4) to view attribute statistics associated with the defects or defectives characteristics for the control plan.
Navigation:
This example illustrates the fields and controls on the Attributes Statistics page. You can find definitions for the fields and controls later on this page.
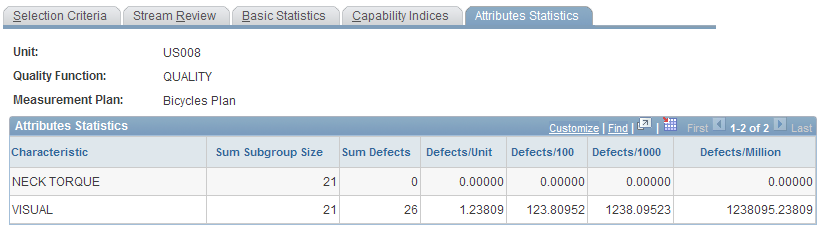
Note: The statistics are only calculated for characteristics that have a data type of defects or defectives—count data.
Field or Control |
Description |
|---|---|
Sum Subgroup Size (sum subgroup size) |
Displays a tally of all subgroup sizes entered for each subgroup retrieved by the inquiry. |
Sum Defects |
Sum total of all defects. |
Defects/Unit, Defects/100, Defects/1000, and Defects/Million |
Statistics include defects per unit, hundred, thousand, and million. |