Defining Control Plans
To define control plans use the Control Plans component (QS_CREATE_QCPLANS). This topic provides an overview of control plans and discusses how to define control plans.
|
Page Name |
Definition Name |
Usage |
|---|---|---|
|
QS_ROOT_FILTER |
Load a limited list of control plans with which to work. |
|
|
QS_STREAM_ROOT |
Define and maintain control plans that bundle all associated inspection and control information into individual plans. |
|
|
QS_QCPLAN_DEFINE |
Create multiple control plans at once. Enter the different fields on the page or use a wild card pertaining to a hierarchy field. |
|
|
QS_STREAM_DETAIL |
Maintain control limits for individual streams that are associated with each control plan. |
The control plan is the combination of one set of characteristics with a specific instance of hierarchy values. The control plan:
Brings together all areas of control into one single plan for data collection and analysis.
Is required to collect data.
Is the method by which you apply quality controls to specific hierarchy fields and the measurement plan.
Because a control plan contains a measurement plan (which can have more than one characteristic) when you save the control plan, the system creates a process stream beneath the control plan for each characteristic in the measurement plan. The process streams become the actual points of control.
A Quality business unit, quality function, and measurement plan must exist to create control plans. You can delete only those control plans that haven't been previously saved.
Use the Load QCPlans page (QS_ROOT_FILTER) to load a limited list of control plans with which to work.
Navigation:
All fields are optional.
Configuration Settings
Select the fields by which you want to filter control plans.
Hierarchy Constant
Displays the hierarchy fields that are associated with the quality function. Select the hierarchy fields by which you want to filter the control plans.
Use the Maintain QCPlans page (QS_STREAM_ROOT) to define and maintain control plans that bundle all associated inspection and control information into individual plans.
Navigation:
This example illustrates the fields and controls on the Maintain QC Plans page. You can find definitions for the fields and controls later on this page.
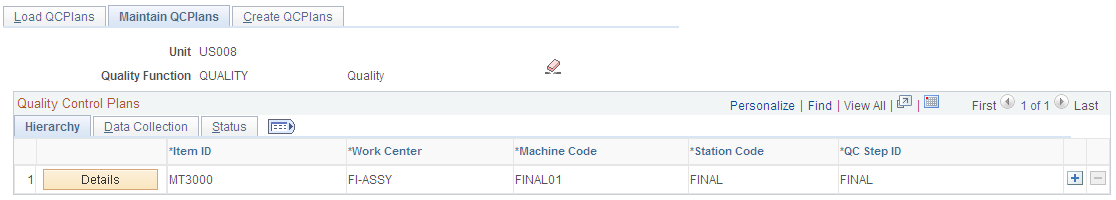
The first columns on the page vary depending on the quality function that you select. The columns are the individual hierarchy fields associated with the quality function. Enter the individual hierarchy fields for the control plan.
Data Collection Tab
Select the Data Collection tab.
Field or Control |
Description |
|---|---|
Data Entry Method |
Select the data-entry method: By Sample or By Subgroup. |
Data Entry Name |
Enter a name by which to group multiple control plans. By giving the same name to multiple rows, you can gather more than one set of streams for data entry and data extraction purposes. |
Sequence |
Enter a sequence number to define the order in which control plans with a common data-entry name appear in data entry. |
Sample Frequency |
Select the recommended sampling frequency for this control plan. |
Trace Set |
Select a trace set for the control plan. This field is active if you associate trace fields with the selected quality function. |
Attribute Group |
Select an attribute group to the control plan. This field is active if attribute groups are defined for the selected Quality business unit. |
Examples of Data-Entry Methods
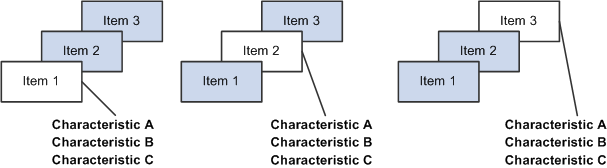
Using the by sample method for a control plan, you inspect all the characteristics for the first sample, then all the characteristics for the next sample, such as inspecting a large item that must be fixtured. You take all measurements of that item prior to fixturing the next item.
This diagram illustrates the by sample data-entry method where item 1 is inspected for characteristics A, B, and C, then item 2 is inspected for characteristics A, B, and C, and finally item 3 is inspected for characteristics A, B, and C:
This diagram illustrates the by sample data-entry method.
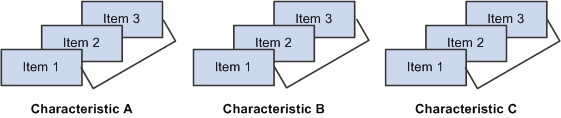
Using the by subgroup method, you inspect one characteristic for a group of items, then another characteristic for a group of items, such as inspecting several small items in succession with a specific gauge. You complete the sample for each characteristic prior to using the next gauge.
This diagram illustrates the by subgroup data-entry method where items 1, 2, and 3 are inspected for characteristic A, then items 1, 2, and 3 are inspected for characteristic B, and finally items 1, 2, and 3 are inspected for characteristic C:
This diagram illustrates the by subgroup data-entry method.
If you are collecting data against this control plan by using data entry by control plan, the system uses the method that you specify on this page. Otherwise, the system uses the data-entry method that you assign on the access list. The system uses the access list when setting up data entry for multiple control plans.
Status Tab
Select the Status tab.
The system displays the number of streams that exist under this control plan in the Stream Count field.
Use the Create QCPlans page (QS_QCPLAN_DEFINE) to create multiple control plans at once.
Enter the different fields on the page or use a wild card pertaining to a hierarchy field.
Navigation:
Configuration Settings
Select or enter the values that you want to apply to the new control plans.
Wildcard (optional)
This group box affects the Hierarchy Constants group box.
Field or Control |
Description |
|---|---|
Field |
Select the field for which you want to use a wildcard. |
String |
Enter the wildcard using SQL-link syntax. For example, if you select Item ID as the field for the wildcard, and you want to create control plans for all items containing the letter A, enter %A% in the String field. |
Source |
Enter the prompt table that is assigned to this field in the quality function definition. You can override this entry with any valid table or view containing one column matching the wildcard field. |
Hierarchy Constants
If you select a hierarchy field as a wild card, you can't enter data in that particular field in this group box.
The hierarchy fields in this group box are associated with the quality function. The fields vary depending on the quality function that you select.
Use the Stream Details page (QS_STREAM_DETAIL) to maintain control limits for individual streams that are associated with each control plan.
Navigation:
Click the Details button on the Maintain QCPlans page.
This example illustrates the fields and controls on the Stream Details page. You can find definitions for the fields and controls later on this page.
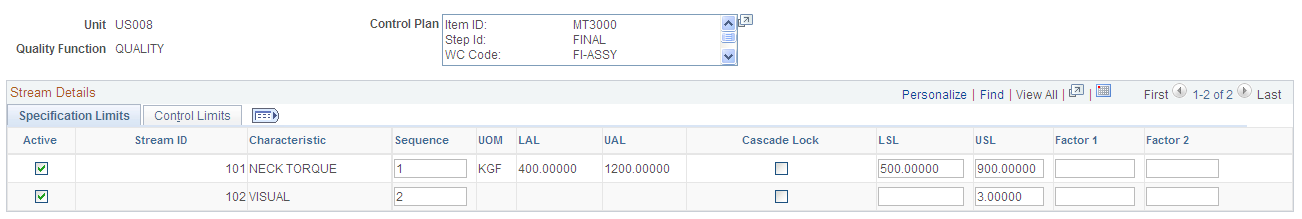
Use this page to define stream-specific data-collection settings and specification limits.
Field or Control |
Description |
|---|---|
Stream ID |
A unique sequential ID that is assigned by the system to each stream appears. It cannot be changed. |
Sequence |
Enter the sequence of how the characteristics are ordered when performing data entry against the plan. |
UOM (unit of measure), LAL (lower acceptance limit), and UAL (upper acceptance limit) |
The system displays the values that are inherited from the measurement plan. The fields are display-only; you can't change them. The Cascade Lock field doesn't affect them. |
Cascade Lock |
With cascaded fields, the values that you assign at the characteristic level in the measurement plan cause the plan to act as a template. You can override the values that cascade to streams at any time at the stream level. You might want to change a specification limit in the characteristic instead of changing it on every stream, which is an advantage of cascading. However, if you don't want to overwrite the values for specific streams with values from the characteristic, protect those streams with the cascade lock. Select the Cascade Lock check box if you want to lock the stream from being updated by changes that are made to the parent characteristic from the measurement plan. Changes in characteristics that are cascaded to streams are changes to the active setting, specification limits (lower specification limit and upper specification limit), and factors 1 and 2. |
LSL (lower specification limit), USL (upper specification limit), Factor 1 , and Factor 2 |
Enter stream-specific specification limits that you want to use. By default, the limits that are defined for the underlying characteristic are inherited. Select the Cascade Lock check box to protect these entries from changes that are made at the measurement plan level. |
Control Limits Tab
Select the Control Limits tab to view or change working control limits for individual streams.
Field or Control |
Description |
|---|---|
Clim Status (control limit status)process control limitsstatuses |
Displays the control limit status for a particular stream: None: Limits are not yet assigned or calculated for the stream. Preliminary: First level of promotion. Monitoring: Second level of promotion. Ongoing: Third and final level of promotion. Recalc (recalculate): Recalculated after ongoing. Assigned: Limits are assigned manually. Reset: Limits are reset manually to begin the promotion cycle that is defined by the control procedure that is assigned to this characteristic. |
LCL (1) [lower control limit (graph 1)], CL (1) [control limit (1)], UCL (1) [upper control limit (1)], LCL (2), CL (2) , and UCL (2) |
Display if control limits are established either by assignment or by calculation. The fields reflect the current control limit values and status of the stream. |
Note: Quality assigns the statuses according to the limit promotion milestones information that you define by using the Control Procedures page.
Assigning Control Limits
Field or Control |
Description |
|---|---|
|
Click the Assign Control Limits button to assign process control limits. The limit status changes to assigned, which means to ignore the promotional milestones that are associated with a control procedure that is associated with the measurement plan. Enter the control limits that you want to assign to the stream in the control limit fields: LCL (1), CL (1), UCL (1), LCL (2), CL (2), or UCL (2). |

Resetting Process Control Limits
Field or Control |
Description |
|---|---|
|
Click the Reset Control Limit Promotions button to restart the limit calculation-promotion cycle. The Clim Status value changes to Reset. |

Control Limit Promotion Method Example
In a typical control limit promotion method, the limits are assumed to be ever tightening over time as the process matures and process improvement methods take effect. This diagram illustrates process control limits where the subgroup milestones of 10, 20, and 30 are used as examples only and are not fixed:
This diagram illustrates process control limits.
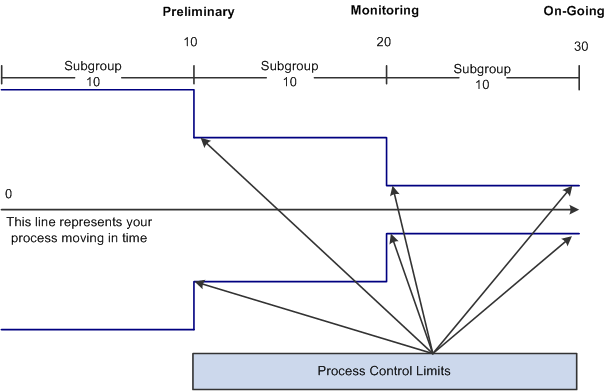
The following steps show how a control limit promotion cycle progresses:
For a new process with unknown capability, control limits are indeterminate and the system reflects a preliminary status.
As the process matures, the promotion cycle continues to collect data and makes improvements to the process through corrective actions. Control limits are recalculated at intervals, and the status progresses to monitoring and then to ongoing to reflect heightened stability and tighter control.
At any time during the different levels of promotion, you can reset control limits and restart the cycle. When you reset control limits, the system status is reset until it reaches the first promotion milestone (preliminary).
You can also assign specific control limits at any time. When you assign control limits, the system status is assigned and limit promotions are not performed.