Creating Templates for the Supply/Demand Dashboard
|
Page Name |
Definition Name |
Usage |
|---|---|---|
|
IN_SDA_MULTI_SRCH |
Create up to four templates. |
|
|
IN_SDA_COMBO_SRCH |
Create up to two combination templates. |
Dashboard Templates are created to populate the charts in the SD Dashboard and can be used to track and report multiple conditions within your supply and demand business flow. You can create multiple templates and save them for different views of analysis.
The S/D Dashboard provides four quadrants that you can populate with different chart templates. You determine four templates that appear as defaults upon entering the SD Dashboard, but you can change any of the four quadrants to another save template, change the conditions of a save template, or create new templates when viewing supply and demand in the SD Dashboard.
SD Dashboard templates are saved by User ID. Therefore they are for the individual user only. SD Dashboard templates are not shared.
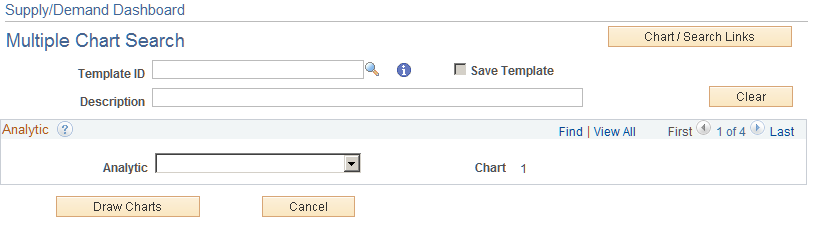
Use the Multiple Chart Search page (IN_SDA_MULTI_SRCH) to create up to four templates.
Navigation:
Click the Chart / Search Links button, and then select Multiple Chart Templates.
This example illustrates the fields and controls on the Multiple Chart Search page.
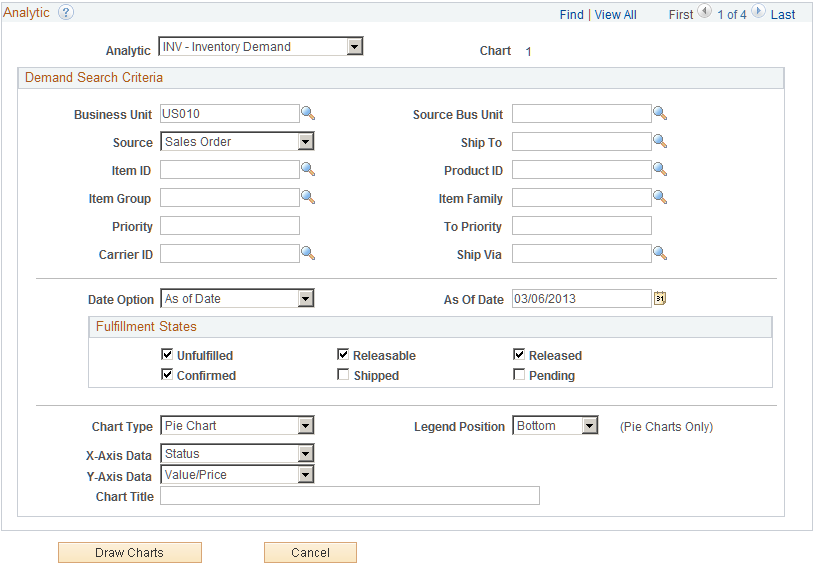
This example illustrates the fields and controls on the Multiple Chart Search page where Analytic is Inventory Demand.
Field or Control |
Description |
|---|---|
Template ID |
Enter a template ID that indicates the information that is displayed in the template. |
Save Template |
Select to indicate that the values in the template are to be saved. |
Description |
Enter a description that identifies the information that is displayed in the template. |
Clear |
Click the button to clear all values that have been entered in a template. |
Analytic
Notice that the system displays 1 of 4 in the Analytic section. The 4 represents the four quadrants of the Supply/Demand Dashboard. You are not required to create four templates.
Field or Control |
Description |
|---|---|
Analytic |
Select an analytic option. Options include:
When you select an option in this field, the system populates the remaining fields for the template. |
Analytic is INV – Inventory Demand
The fields that are displayed represent the search fields and criteria that will be used by the system when displaying the chart. Some field values appear by default based on the Supply/Demand Dashboard User Config – Dashboard Setup Page for your User ID. These fields can be changed on this page.
The fields in the first section are used to search for all demand or a specific demand option. For example, if you want to see all items, then leave the Item ID field blank. If you want to see a specific item, then enter that item in the Item ID field.
Field or Control |
Description |
|---|---|
Date Option |
Select an option that segments, or buckets, the data that is displayed. Options include As of Date, Date Range, and Number of Days. Depending on the option selected, the page automatically adjusts for you to enter the specific date information. |
Draw Charts |
Click this button to test the chart based on your search criteria. This option provides an opportunity to view the results and make changes to your search criteria. |
Chart Title |
Enter a title for the chart that provides meaning to you. This title displays on the Supply/Demand Dashboard page in the upper left corner of the corresponding chart quadrant. |
Save |
Click this button to save and store the template for your User ID. |
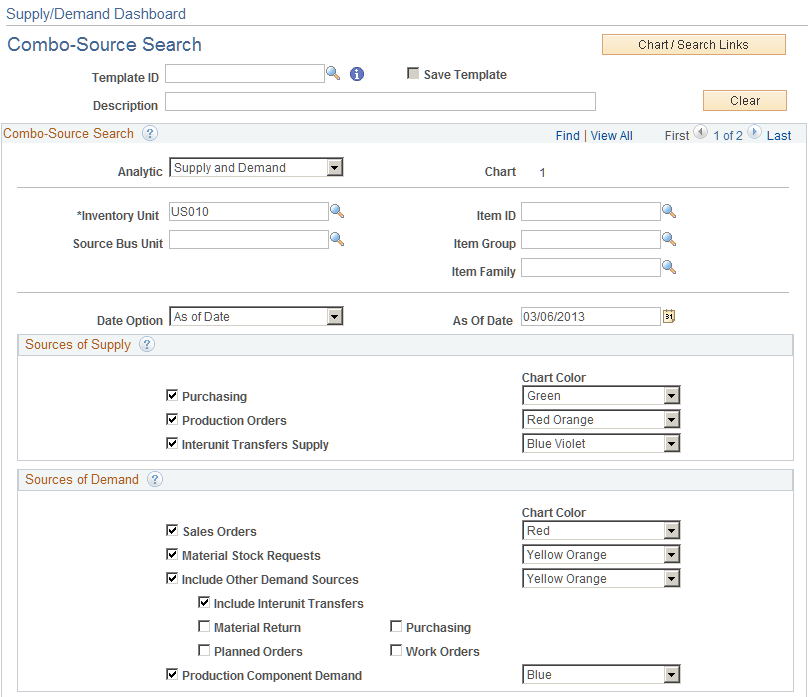
Use the Combo-Source Search page (IN_SDA_COMBO_SRCH) to create up to two combination templates.
Navigation:
Click the Chart / Search Links button, and then select Combo-Source Search.
This example illustrates the fields and controls on the Combo-Source Search page (1 of 3).

This example illustrates the fields and controls on the Combo-Source Search page (2 of 3) where Analytic is Supply and Demand.
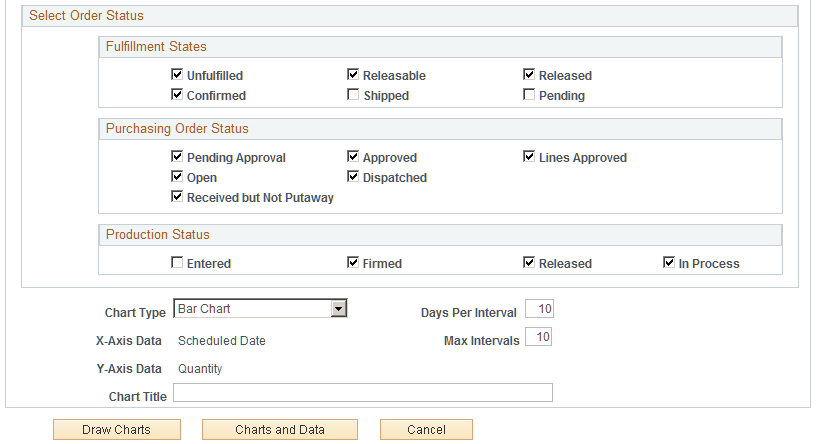
This example illustrates the fields and controls on the Combo-Source Search page (3 of 3) where Analytic is Supply and Demand.
The fields that are displayed represent the search fields and criteria that will be used by the system when displaying the chart. Some field values appear by default based on the Supply/Demand Dashboard User Config - Combo Chart Setup Page for your User ID. These fields can be changed on this page.
Combo-Source Search
The system displays 1 of 2 in the Analytic section. The 2 represents the two of the four quadrants of the Supply/Demand Dashboard. You are not required to create four templates.
Field or Control |
Description |
|---|---|
Analytic |
Select an analytic option. Options include:
When you select an option in this field, the system populates the remaining sections and fields on the page. |
Charts and Data |
Click this button to have the system create a chart and a table that uses the data selected in your template. Similar to the Draw Charts button, this option provides an opportunity to view the results and make changes to your search criteria. |