Setting up the Supply/Demand Dashboard User Configuration
|
Page Name |
Definition Name |
Usage |
|---|---|---|
|
IN_SDA_OPR_CONFIG |
Define default values for the various options available on the dashboard by User ID. |
|
|
Supply/Demand Dashboard User Config - Combo Chart Setup Page |
IN_SDA_OPR_CFG_CMB |
Define default values for the various options available on the Combo-Source Chart page by User ID. |
Use the Supply/Demand Dashboard User Config page (IN_SDA_OPR_CONFIG) to define default values for the various options available on the dashboard by User ID.
Navigation:
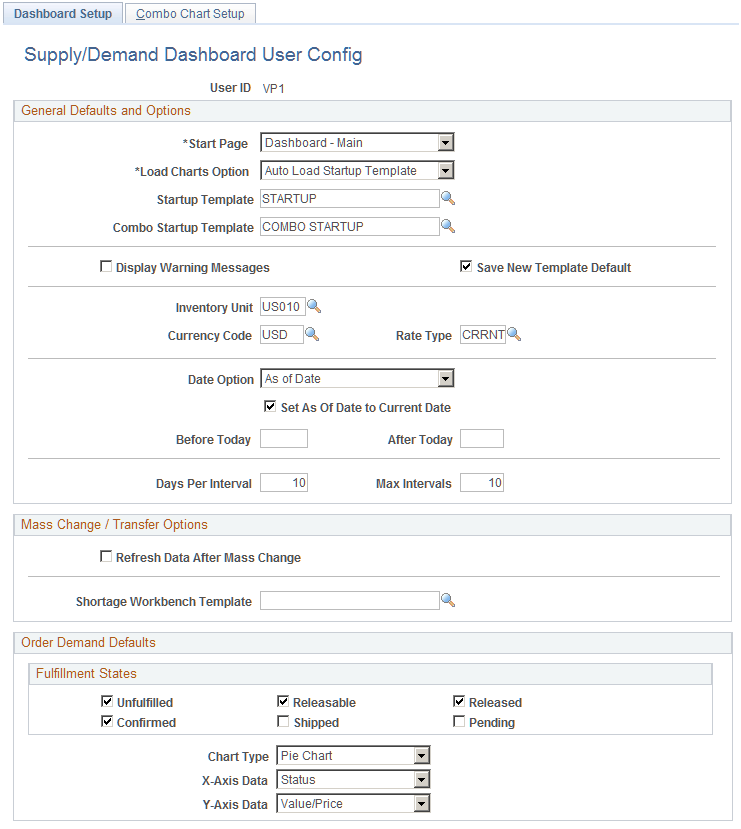
This example illustrates the fields and controls on the Supply/Demand Dashboard User Config page (1 of 2).
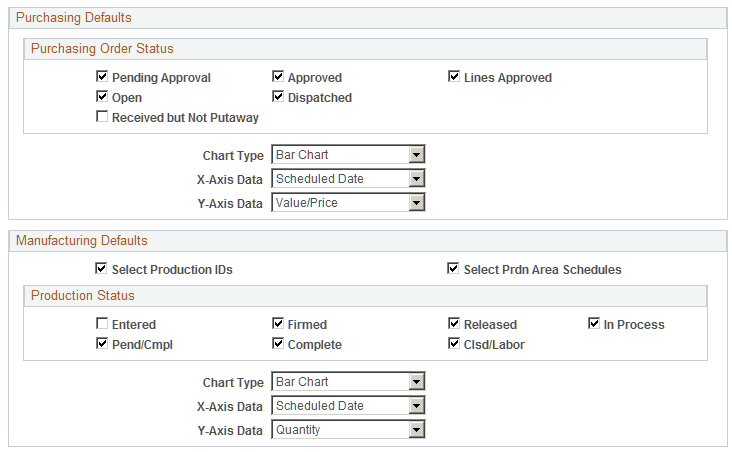
This example illustrates the fields and controls on the Supply/Demand Dashboard User Config page (2 of 2).
This page provides default values for analytics.
Field or Control |
Description |
|---|---|
Start Page |
Select an option that determines the page that is initially displayed when entering the Dashboard. Options include:
|
Load Charts Option |
Select an option that determines the charts that are loaded when entering the Dashboard. Options are: Auto Load Last Saved Charts: Select to load the charts that were saved during the last session. Auto Load Startup Template: Select to load the option selected in the Startup Template field. No Auto Load: Select to no load any charts in the Dashboard. |
Startup Template |
Select a template that you want to see when Auto Load Startup Template is selected in the Load Chart Options field. |
Combo Startup Template |
Select a combo startup template that you want to see when Combo-Source Charts is selected in the Start Page field. |
Nbr of Charts to Display (number of charts to display) |
Enter a value from 0 to 4, which determine how many charts are displayed in the Dashboard. |
Display Warning Messages |
Select to indicate that you want to display warning messages. For example, if multiple UOMs are used in one analytic, the system displays a warning message. If this option is not selected, only error messages are displayed. |
Save New Template Default |
Select to indicate that the Save Template check box is selected by default on the Multiple Chart Search and Combo-Source Search pages, when a new template is created. |
Inventory Unit, Currency Code, and Rate Type |
Select the primary Inventory business unit, currency code, and currency rate type that you want to see when viewing the Dashboard. The rate type is used for all conversions for all monetary data. |
Date Option |
Select a date options that is used by default and represents the dates that are used to display supply and demand data.
|
Set As Of date to Current Date |
Select to indicate that the current date should be used by default when doing analysis on any chart data. When viewing the Dashboard, users can change the date to any date in the past or into the future. |
Before Today and After Today |
Enter the number of days, before and after today’s date, for all search criteria. This option is used when Number of Days is selected in the Date Option field. |
Days Per Interval and Max Intervals |
Enter a value that indicates the number of pie slices in a pie chart and the number of bars in a bar chart. |
Mass Change/Transfer Options
Performing mass changes is a secure feature and a user must be granted access to this feature in order to see mass change options.
Field or Control |
Description |
|---|---|
Refresh Data After Mass Change |
Select to indicate that the analytic data should be refreshed (recalculated) after performing a mass change update. |
Save Mass Change History |
Select to indicate that you want the details of a mass change update to be available for review. |
Shortage Workbench Template |
Select a shortage template to display if you have access to the Shortage Workbench. When doing a multi-line transfer to the Shortage Workbench for a Demand analytic you can use a pre-defined Shortage Workbench template to be used when transferring to the Shortage Workbench. |
Common to Order Demand, Purchasing, and Manufacturing Defaults
Field or Control |
Description |
|---|---|
Chart Type |
Select the type of chart that displays by default for all order demand, purchasing, and manufacturing pages. |
X-Axis Data |
Select the x-axis option that displays by default for all order demand, purchasing, and manufacturing pages |
Y-Axis Data |
Select the y-axis option that displays by default for all order demand, purchasing, and manufacturing pages |
Order Demand Defaults
Field or Control |
Description |
|---|---|
Fulfillment States |
Select the Inventory state options that are to be included on all searches for demand. |
Purchasing Defaults
Field or Control |
Description |
|---|---|
Purchasing Order Status |
Select the Purchasing status options that are to be included in as receipts (not putaway) in the Expected PO Receipts analytic chart. |
Manufacturing Defaults
Field or Control |
Description |
|---|---|
Select Production IDs |
Select to indicate that production orders are to be included in Manufacturing analytics. |
Select Prdn Area Schedules (select production area schedules) |
Select to indicate that production schedule orders are to be included in Manufacturing analytics. |
Production Status |
Select the Production status options that are to be included in Manufacturing analytics. |
Use the Supply/Demand Dashboard User Config - Combo Chart Setup page (IN_SDA_OPR_CFG_CMB) to define default values for the various options available on the Combo-Source Chart page by User ID.
Navigation:
.
This example illustrates the fields and controls on the Supply/Demand Dashboard User Config - Combo Chart Setup page.
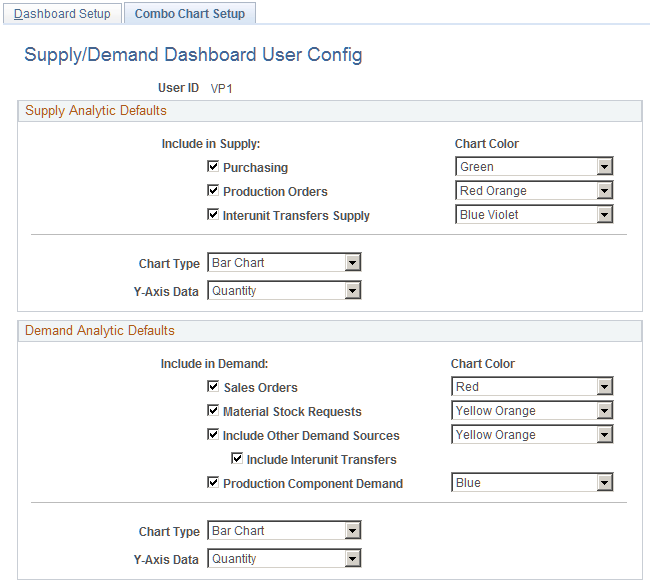
This page provides default values for the Combo-Source Chart page that displays the combination of supply and demand. A combo-source chart lines data up on a single chart.
Supply Analytic Defaults
Field or Control |
Description |
|---|---|
Include in Supply |
Select the source options that you want to include in supply calculations. |
Chart Color |
Select the color that represents Purchasing, Production Orders, and Interunit Transfer Supply if they are selected on the left. |
Chart Type |
Select the chart type (Bar Chart or Stacked Bar Chart) that represents the default value for supply on the Combo-Source Chart search page. |
Y-Axis Data |
Select y-axis option (Quantity or Value/Price) that represents the default value for supply on the Combo-Source Chart search page. |
Demand Analytic Defaults
Field or Control |
Description |
|---|---|
Include in Demand |
Select the source options that you want to include in demand calculations. |
Chart Color |
Select the color that represents Sales Orders, Material Stock Requests, Other Demand Sources, and Production Component Demand if they are selected on the left. |
Chart Type |
Select the chart type (Bar Chart or Stacked Bar Chart) that represents the default value for demand on the Combo-Source Chart search page. |
Y-Axis |
Select y-axis option (Quantity or Value/Price) that represents the default value for demand on the Combo-Source Chart search page. |