Analyzing Supply and Demand Using the Supply/Demand Dashboard
|
Page Name |
Definition Name |
Usage |
|---|---|---|
|
IN_SDA_DASHBOARD |
View and analyze supply and demand. |
|
|
IN_SDA_QCKSRCH_SEC |
Change search criteria for all the charts on your page. |
|
|
IN_SDA_CHTPROP_SEC |
Change the properties of a chart. |
|
|
IN_SDA_CHART1 IN_SDA_CHART2 IN_SDA_CHART3 IN_SDA_CHART4 |
View a split page that displays a chart and a table for the search criteria. |
|
|
IN_SDA_MC_SEC |
Perform a mass change to the data being displayed. |
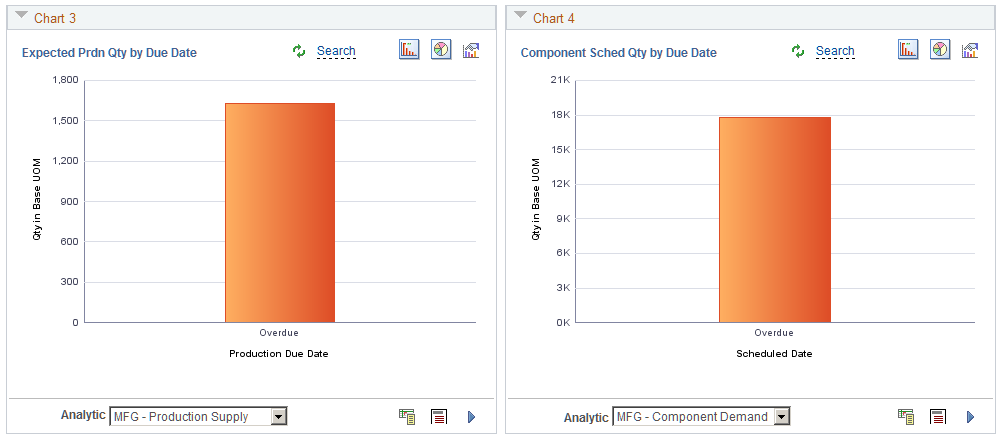
The S/D Dashboard provides four quadrants that you can populate with different chart templates. You determine which templates you want to view as your default templates when you enter the S/D Dashboard for the first time. Keep in mind, that after entering the S/D Dashboard, you can view any template that you have created or change template conditions.
You can select the same chart template in multiple quadrants; change the conditions of each chart, enabling you to perform side-by-side comparisons.
The SD Dashboard can be use to perform mass changes for those who are authorized to do so. Mass changes can correct problems across multiple business documents, such as changing the scheduled ship date for multiple orders. The Refresh Data After Mass Changes check box on the Supply/Demand Dashboard User Config – Dashboard Setup Page can be used to refresh the dashboard, after making a mass change, and provides the user with a refreshed view of the information for further analysis.
For more information about setting up mass change templates, see Setting Up and Viewing Mass Changes to the Supply / Demand WorkCenter.
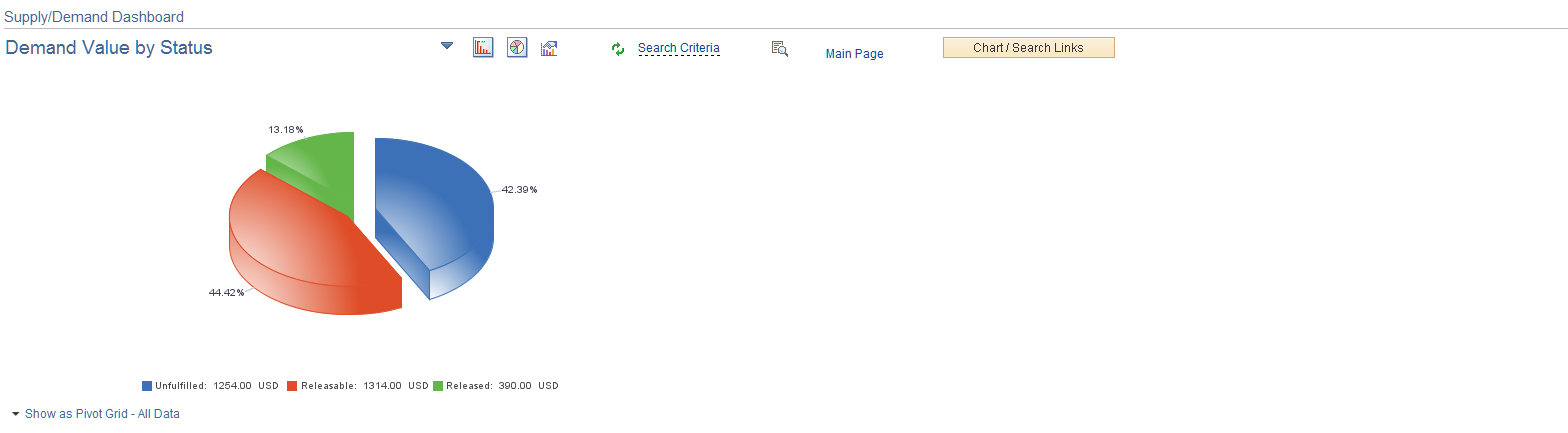
Use the Supply/Demand Dashboard page (IN_SDA_DASHBOARD) to view and analyze supply and demand.
Navigation:
This example illustrates the fields and controls on the Supply/Demand Dashboard page (1 of 2).
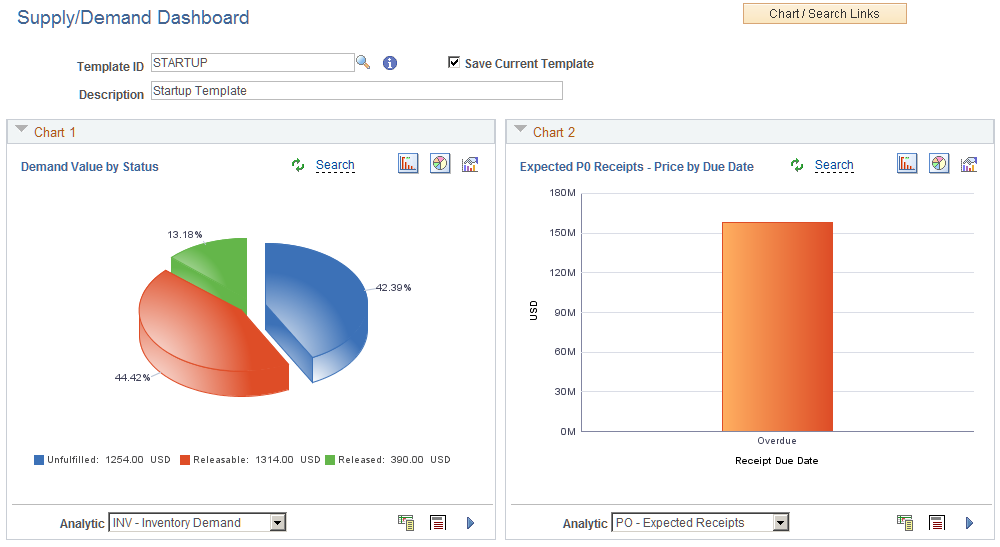
This example illustrates the fields and controls on the Supply/Demand Dashboard page (2 of 2).
You can click a specific segment of a pie or bar chart to access a table where you can view details and take actions that address issues. See the Chart and Chart Detail PageChart and Chart Detail Page.
For additional field and icon definitions, for this and other Supply/Demand Dashboard pages see Common Elements Used When Setting Up and Using the Supply/Demand Dashboard
Field or Control |
Description |
|---|---|
Template ID |
Enter or select a template ID that was previously saved. The template ID selected populates the quadrants that were saved on the Multiple Chart Search page or the Combo-Source Search page. If you have made changes to existing charts, you can enter a new template ID and description, select the Save Current Template check box, and click the Save button. This enables you to create a new template that can be accessed at a later time. |
Use the Quick Cascading Search page (IN_SDA_QCKSRCH_SEC) to change certain search criteria for all the charts on your page.
Navigation:
. Click the Chart / Search Links button and then select Quick Change Search
This example illustrates the fields and controls on the Quick Cascading Search page.
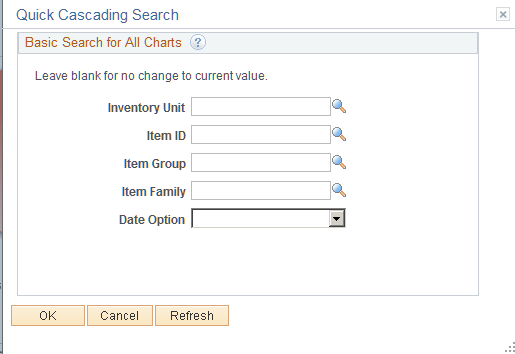
This page enables you to change search criteria for all chart on your page without having to visit each chart to change search or filter criteria. This is a quick way to enter the values, and have them populate across all the charts in your Dashboard.
Field or Control |
Description |
|---|---|
OK |
Click the OK button to return to the Dashboard. If you have made changes, you should click the Refresh button and then the OK button. |
Refresh |
Click the Refresh button to apply the changes. |
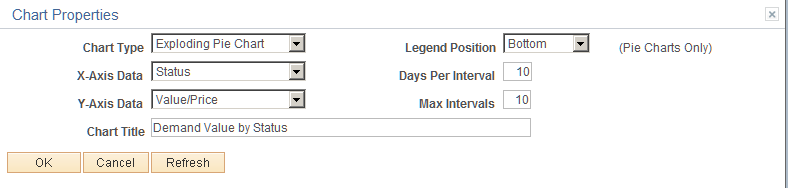
Use the Chart Properties page (IN_SDA_CHTPROP_SEC) to change the properties of a chart.
Navigation:
. Click the Change Chart Properties icon.
This example illustrates the fields and controls on the Chart Properties page.
Field or Control |
Description |
|---|---|
Chart Type |
Select Bar Chart, Exploding Pie Chart, Horizontal Bar Chart, or Pie Chart. |
Legend Position |
Select where you want the color legend to appear. Options include: Bottom, Left, None, Right, Top. |
OK |
Click the OK button to return to the Dashboard. If you have made changes, you should click the Refresh button and then the OK button. |
Refresh |
Click the Refresh button to apply the changes. |
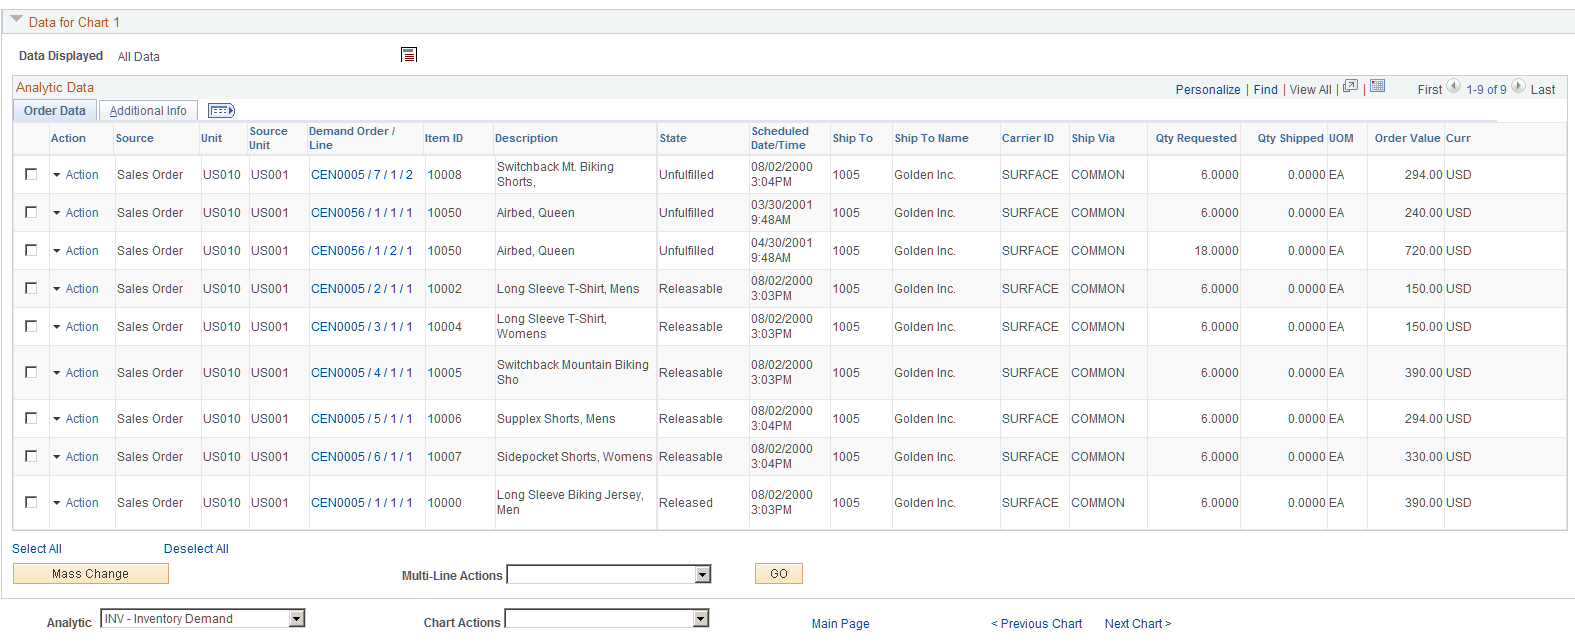
Use the Chart and Chart Detail page (IN_SDA_CHART1, IN_SDA_CHART2, IN_SDA_CHART3, IN_SDA_CHART4) to view a split page that displays a chart and a table for the search criteria.
Note: The actual title of this page is generated based on the value of the Chart Title field for the template.
Navigation:
. Click the View Chart and Data icon.
This example illustrates the fields and controls on the Chart and Chart Detail page (1 of 2).
This example illustrates the fields and controls on the Chart and Chart Detail page (2 of 2).
Field or Control |
Description |
|---|---|
Records Processed |
Hover over this link to view how many records were successfully updated after a mass update. This link is only available after a mass update. |
View Mass Change Data |
Click this link to access the Current Session’s Mass Change page. This enables you to view a detail of the records that were changed after a mass update. This link is only available after a mass update. |
Action |
Click the Action link to display a menu of options that navigates you to other areas in the system. This menu enables you to view more detail prior to taking action or making changes to an individual line as opposed to using the Mass Change feature. The options that are available to a user is based on the security or access of that user or role. |
Mass Change |
Click the Mass Change button after selecting multiple rows to access the Specify Mass Update Values page. Note: Performing mass changes is a secure feature and a user must be granted access to this feature in order to see mass change options. |
Multi-Line Actions |
Select an action to apply to multiple lines. |
Go |
Click the Go button to apply the action selected in the Multi-Line Actions drop down list box. |
Analytic |
Select another analytic option. The system automatically displays the search criteria for the option selected. |
Chart Actions |
Select an action. Options include:
|
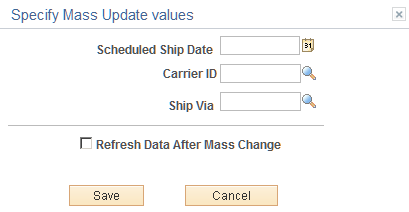
Use the Specify Mass Update values p (IN_SDA_MC_SEC) to perform a mass change to the data being displayed.
Navigation:
. Click the View Chart and Data icon. Select multiple lines and then click the Mass Change button.
This example illustrates the fields and controls on the Specify Mass Update values page.
Field or Control |
Description |
|---|---|
Scheduled Ship Date |
Enter a value that leaves the demand in the current Ship From inventory business unit, but reschedules it the date you enter. |
Carrier ID and Ship Via |
Select a value that changes the carrier and shipping method. This option can be used to expedite a shipment to make up for a missed scheduled ship date. |
Refresh Data After Mass Change |
Select this check box to indicate that the chart and grid are automatically updated and refreshed after you click the Save button. |