Creating Cash Forecast Reports
|
Page Name |
Definition Name |
Usage |
|---|---|---|
|
RUN_TRX5100 |
Enter parameters that you would like to see on the Worksheet Definition Report (TRX5100). |
|
|
RUN_CSH_FCST |
Enter parameters that you would like to see on the Cash Position Report (FCST_RPT). |
|
|
RUN_CPVAR_RPT |
Enter parameters that you would like to see on the Cash Position Variance Report (FCST_VAR_RPT). |
After you have defined your cash worksheet and set up your position source, you can generate reports to analyze the worksheet template or the cash position data. This topic discusses the following cash forecast reports:
Worksheet Definition Report (TRX5100)
Cash Position Report (FCST_RPT)
Cash Position Variance Report (FCST_VAR_RPT)
Worksheet Definition Report
Use the Worksheet Definition report to list detailed information as defined in a specified worksheet template or in all worksheet templates created on or after the date entered. This report lists detailed information for a Worksheet template structure, including reporting currencies, source sets, variance data, forecasting rules, line items, and sources.
Cash Position Report
When you run the Cash Position Report, you choose among business unit, bank code, bank account, and other forecast dimensions to generate an XML Publisher report containing the cash position for each Worksheet Line Item and Source Set.
Cash Position Variance Report
The Cash Position Variance Report shows the variance amount and variance percent between source sets that are defined on the Worksheet Definition page. You must provide variance definitions on the worksheet template to generate variance results. This report can be used to produce actual versus projected comparisons by defining an actuals source set and a projected source set., and sorted by specified criteria including bank, bank account, business unit, or user-defined forecast dimensions.
The Cash Position Variance Report shows the variance amount and variance percent between Source Set 1 and Source Set 2, which are defined in the Variance Definition grid on the Worksheet Definition page. The variance percent is calculated as:
If Source Set 1 and Source Set 2 are not defined on the Worksheet Definition page, the report shows no data.
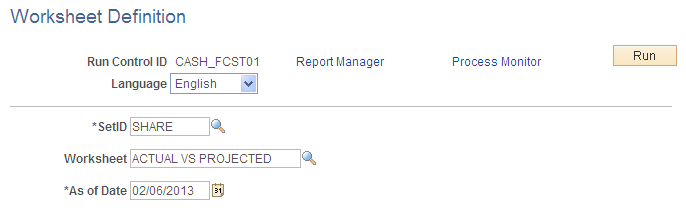
Use the Worksheet Definition (report) page (RUN_TRX5100) to enter parameters that you would like to see on the Worksheet Definition Report (TRX5100).
Navigation:
Click the Worksheet Definition link on the Worksheet Definition page.
This example illustrates the fields and controls on the Worksheet Definition (report) page.
Use the Cash Position Report run control page (RUN_CSH_FCST) to enter parameters that you would like to see on the Cash Position Report (FCST_RPT).
Navigation:
This example illustrates the fields and controls on the Cash Position Report page. You can find definitions for the fields and controls later on this page.
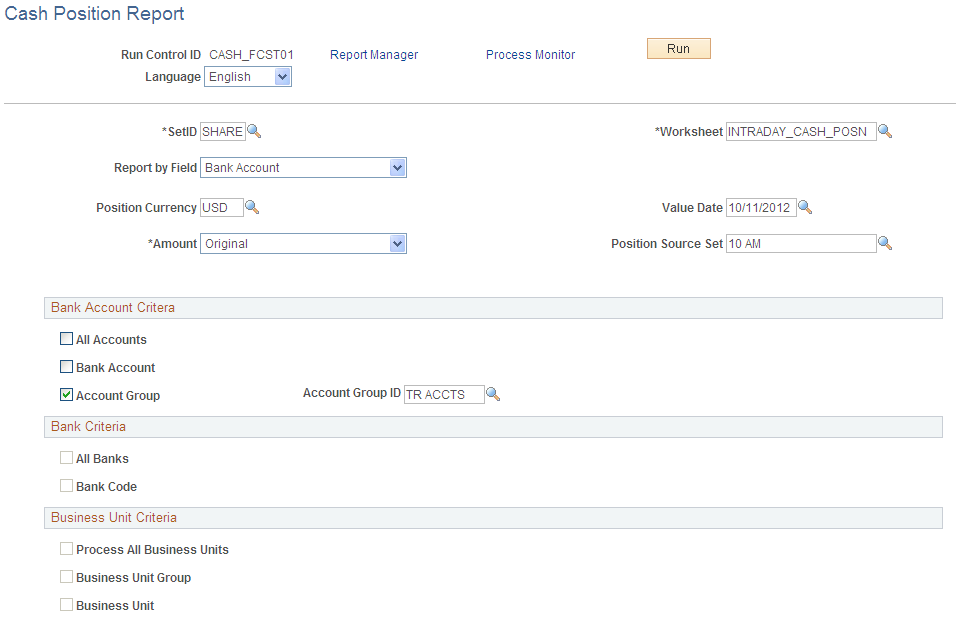
Enter the report parameters and click the Run button.
On the Process Scheduler Request page, select the BI Publisher process FCST_RPT and the desired output format (PDF, RTF, XLS, or HTML) to generate the Cash Position Report.
Field or Control |
Description |
|---|---|
Run Control ID |
Displays the existing or new ID you specified on the search page. |
Language |
Select the language in which the report should be generated. |
SetID |
Enter a SetID. |
Worksheet |
Enter the ID for the worksheet template that you set up on the Worksheet Definition page. |
Report by Field |
Select from these options. Depending on your selection, report parameters on the page will change.
The value you choose in Report by Field is used to categorize worksheet summary lines on the Cash Position Report. |
Position Currency |
Displays the default reporting currency that was defined on the Worksheet Definition page. |
Amount |
Choose from Original or Weighted. |
Position Source Set |
Enter a category for grouping position source data that you defined on the Position Source Set page. |
Use the Cash Position Variance Report page (RUN_CPVAR_RPT) to enter parameters that you would like to see on the Cash Position Variance Report (FCST_VAR_RPT).
Navigation:
This example illustrates the fields and controls on the Cash Position Variance Report page. You can find definitions for the fields and controls later on this page.
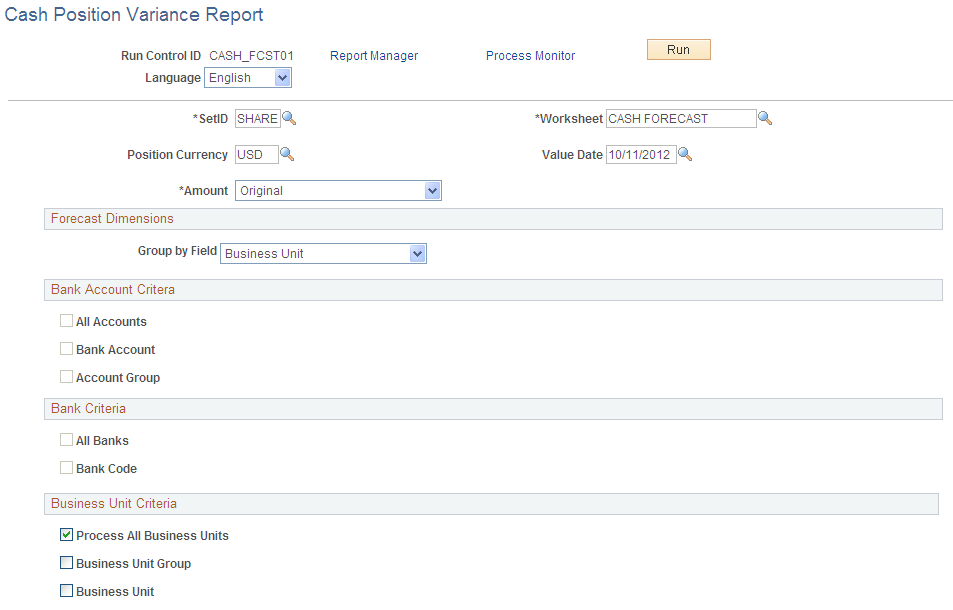
Enter the report parameters and click the Run button.
On the Process Scheduler Request page, select the BI Publisher process FCST_VAR_RPT and the desired output format (PDF, RTF, XLS, or HTML) to generate the Cash Position Variance Report.
Field or Control |
Description |
|---|---|
Run Control ID |
Displays the existing or new ID you specified on the search page. |
Language |
Select the language in which the report should be generated. |
SetID |
Enter a SetID. |
Worksheet |
Enter the ID for the worksheet template that you set up on the Worksheet Definition page. |
Position Currency |
Displays the default reporting currency that was defined on the Worksheet Definition page. |
Value Date |
Enter a payment date value. |
Amount |
Choose from Original or Weighted. |
Forecast Dimensions
Field or Control |
Description |
|---|---|
Group by Field |
Select from these options. Depending on your selection, report parameters on the page will change.
The value you select for Group by Field is used to categorize worksheet summary lines on the Cash Position Variance Report. |