Analyzing Supplier Scorecard
This topic discusses how to analyze Evaluation results and scores in a supplier scorecard.
After an Evaluation has been posted, the Evaluation results and scores may be analyzed by any user who has been granted permission to access the Evaluation Analysis component.
You have two ways with which you can access the scorecard results:
Access Scorecard results using the Supplier Watch List page.
Access Scorecard results using the Analysis tiles on the Fluid Home page for Supplier Scorecard.
|
Page Name |
Definition Name |
Usage |
|---|---|---|
|
PO_SWL_WATCH_FL |
View Evaluation results of suppliers. |
|
|
PTPG_NUI_VWR |
View Overall score of the last five suppliers with posted Evaluations. |
|
|
PTPG_NUI_VWR |
View the trending results for the last five suppliers. |
Use the Supplier Watch List page (PO_SWL_WATCH_FL) to view Evaluation results of suppliers.
Navigation:
This example illustrates the fields and controls on the Supplier Watch List page.
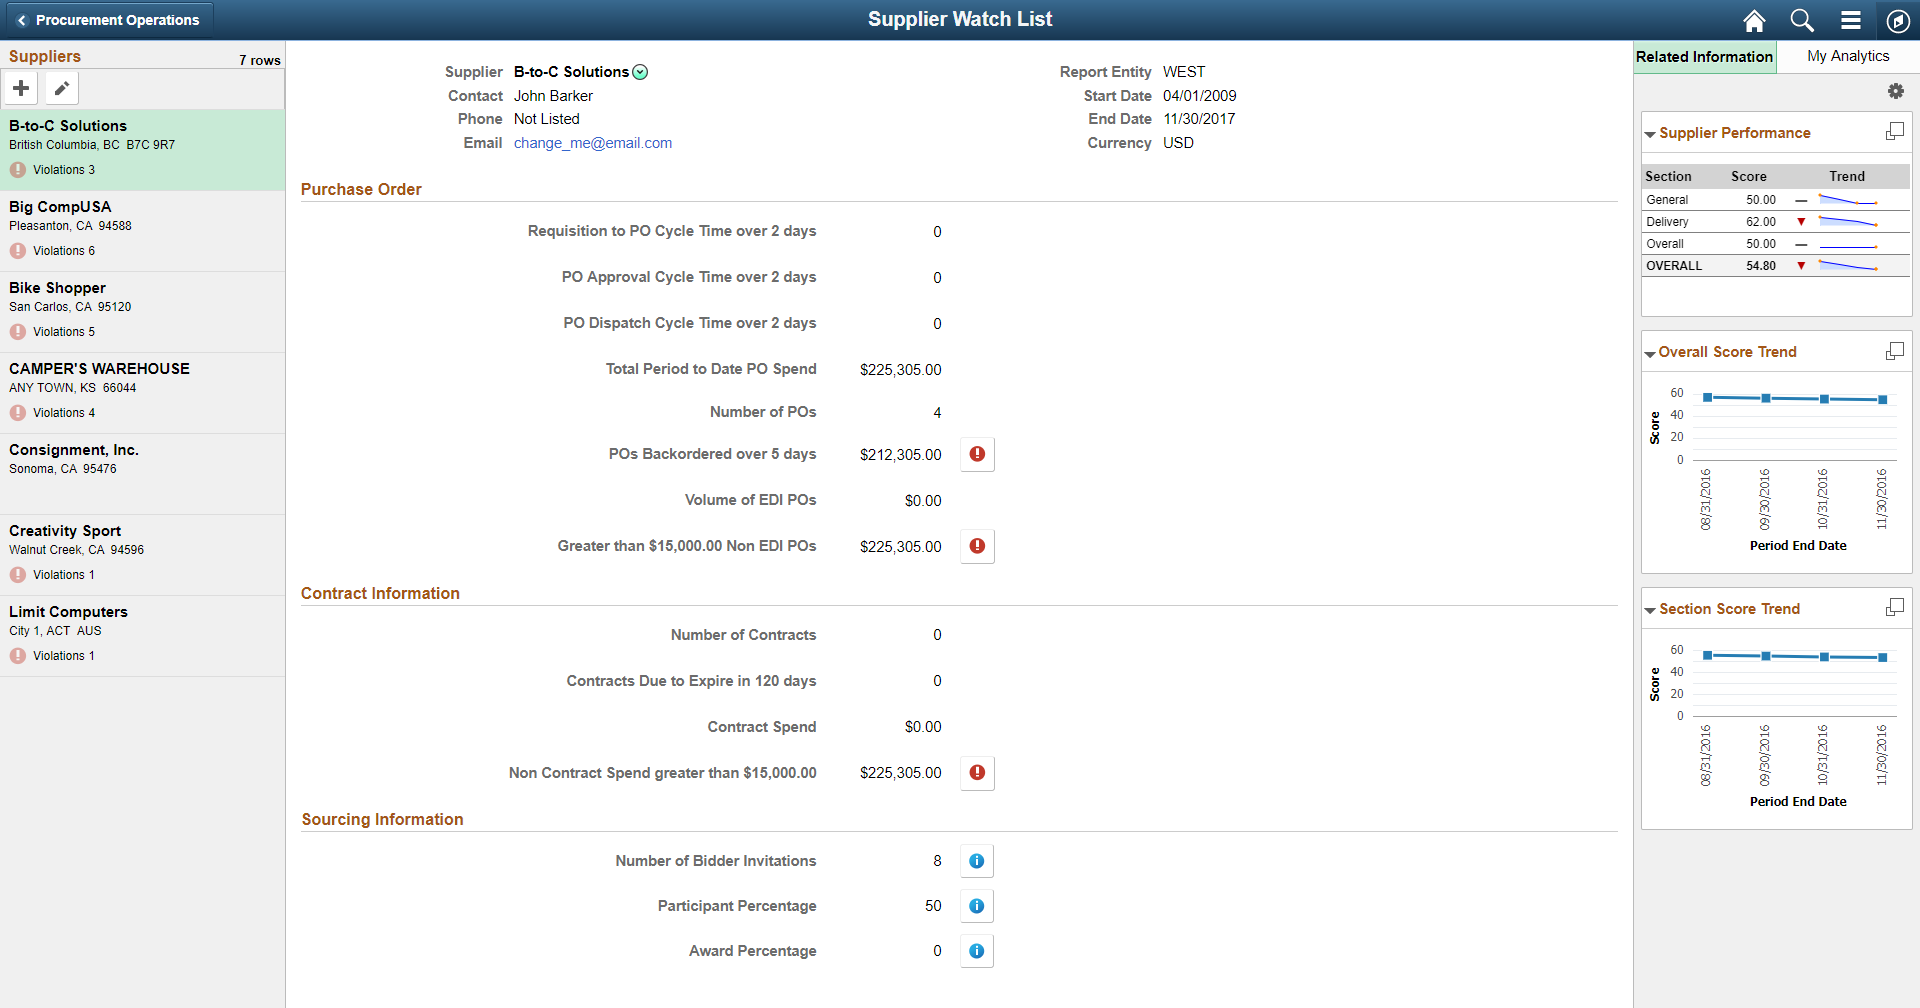
On the Supplier Watch List page, you can maintain list of suppliers you are interested in watching. The most recently posted Evaluation results for the selected supplier are displayed on the Related Information tab. You can further build your analysis using the My Analytics tab.
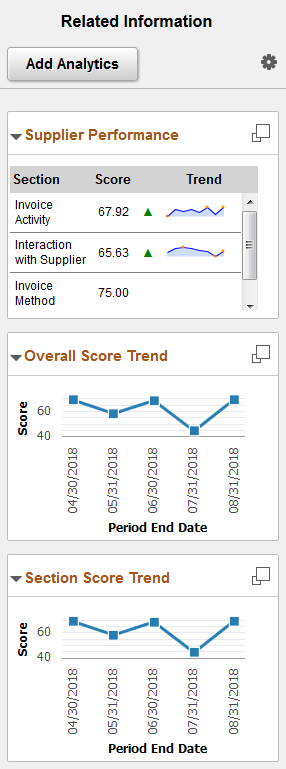
Related Information Tab
The Related Information tab contains these pagelets:
Supplier Performance pagelet
Overall Score Trend pagelet
Section Score Trend pagelet
Pagelets available in the Related Information tab.
The Supplier Scorecard setup pages help determine the data displayed in these pagelets.
See Setting Up Supplier Scorecarding.
Field or Control |
Description |
|---|---|
|
Click to display the full version of the pagelet in a modal window. |
 (Display Supplier Performance in Modal Window)
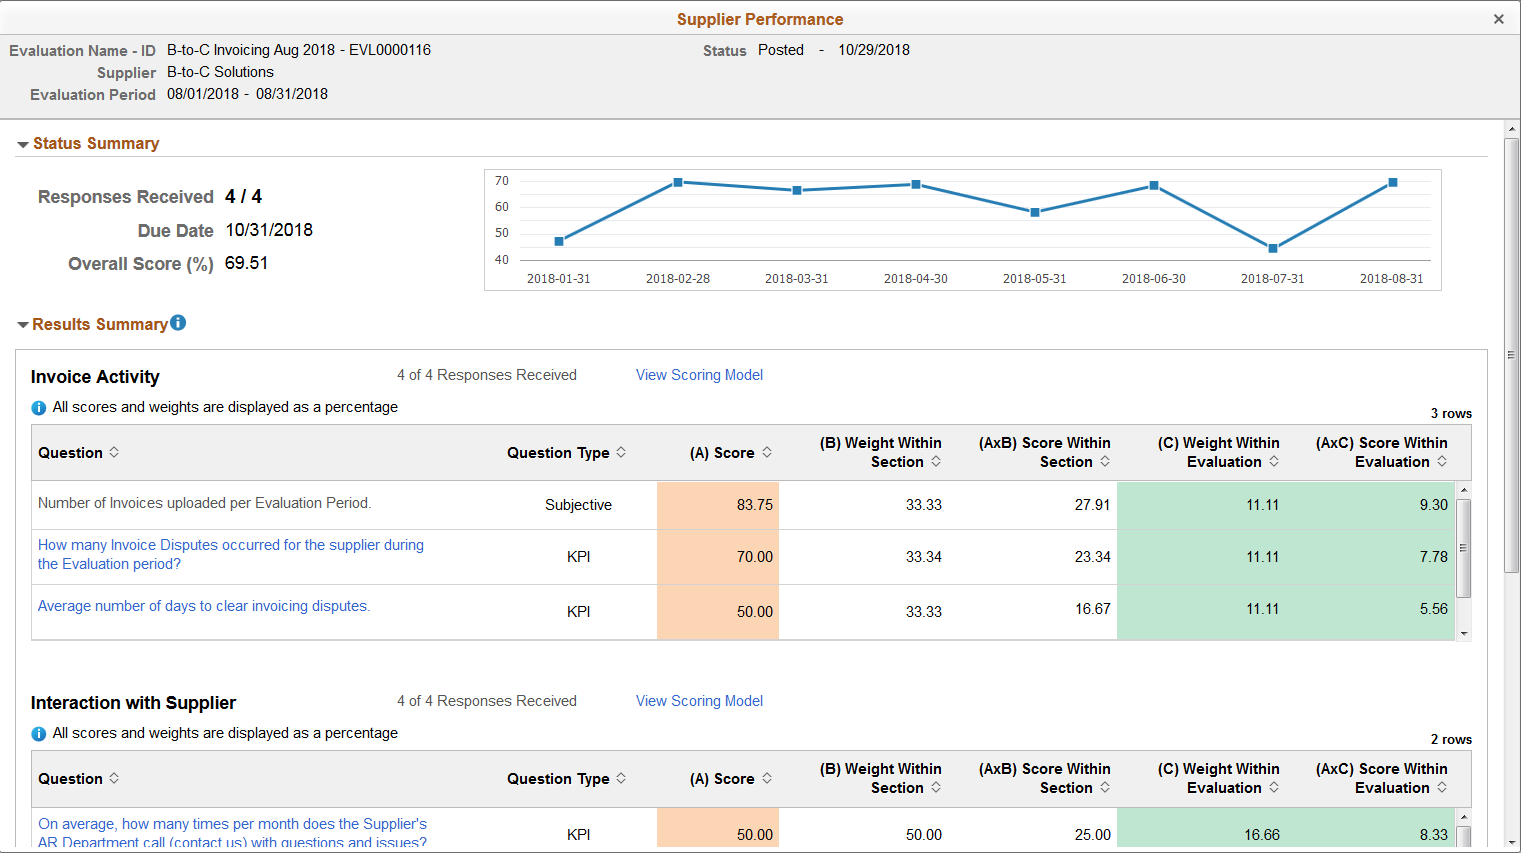
Supplier Performance Page
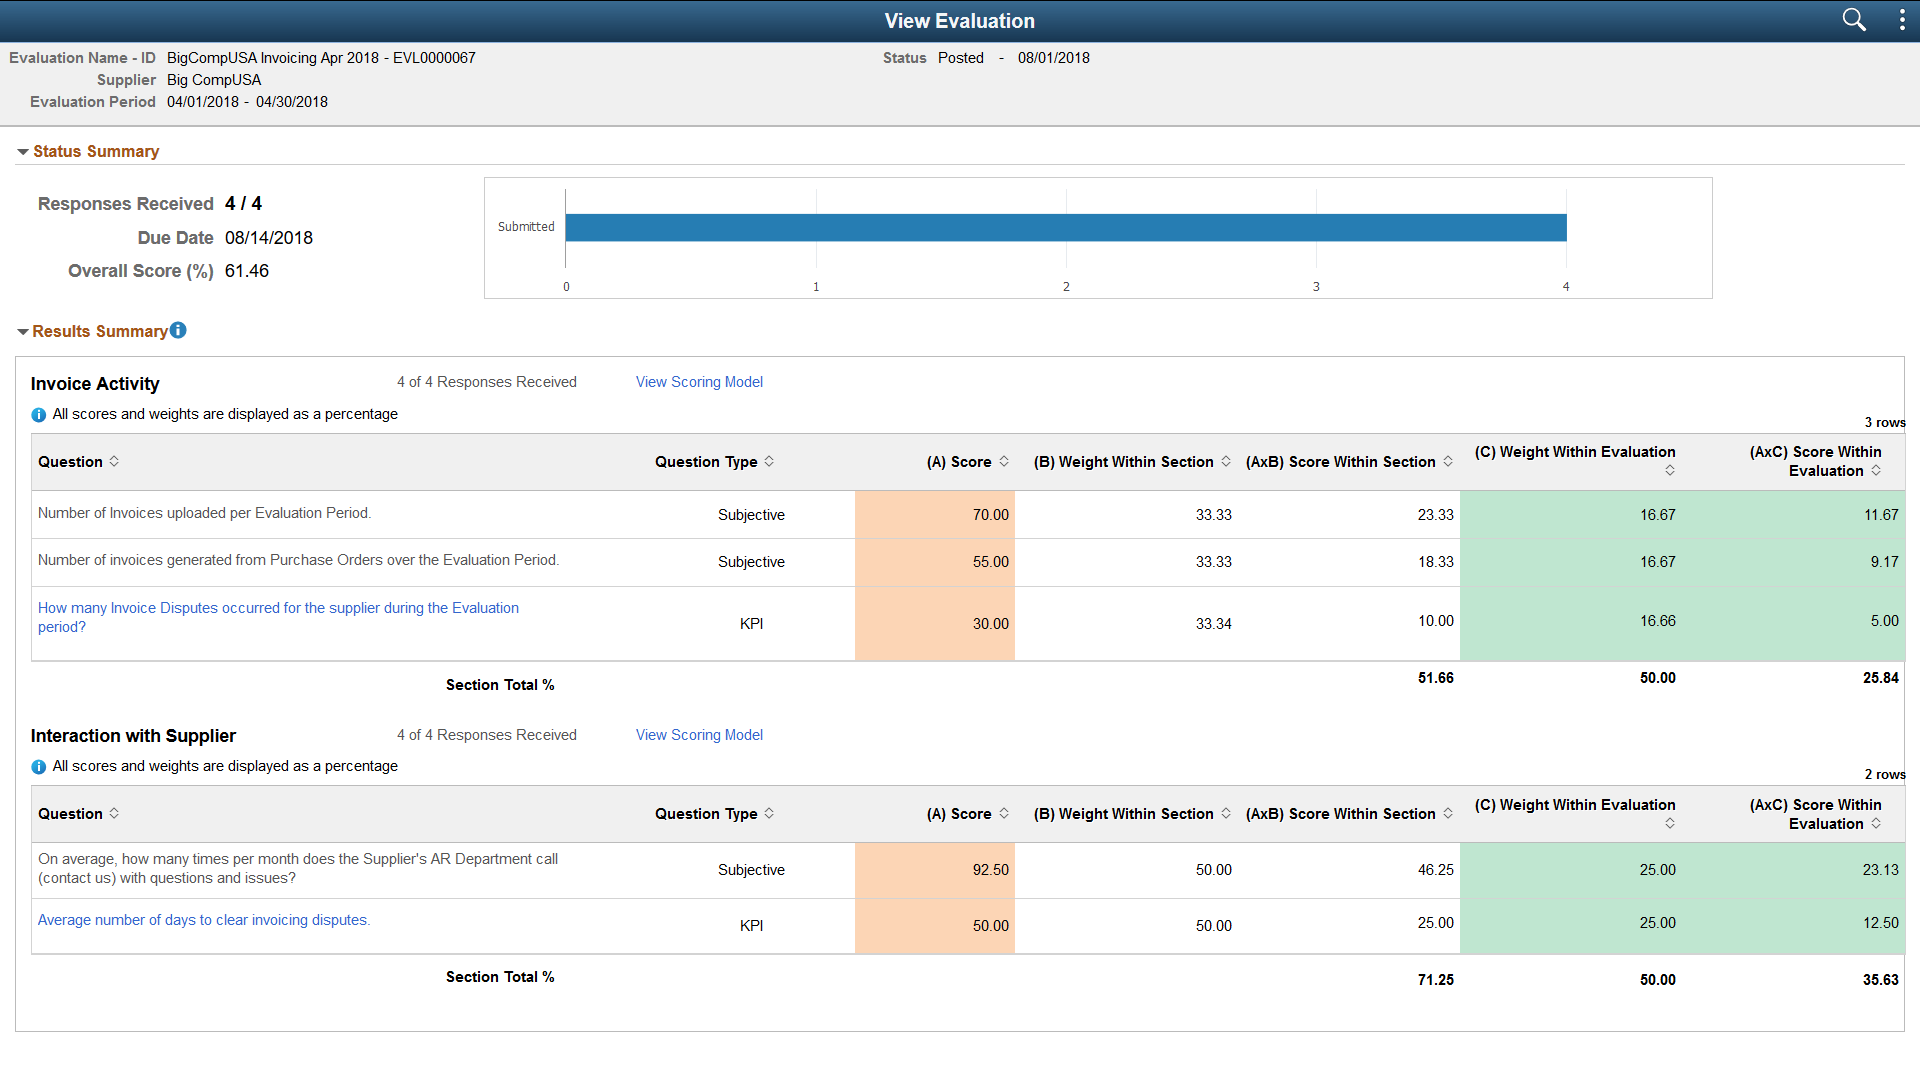
The Supplier Performance page consists of a status summary score trend graph and results summary charts that display the most recently posted Evaluation for the selected supplier.
This example illustrates the fields and controls on the Supplier Performance page.
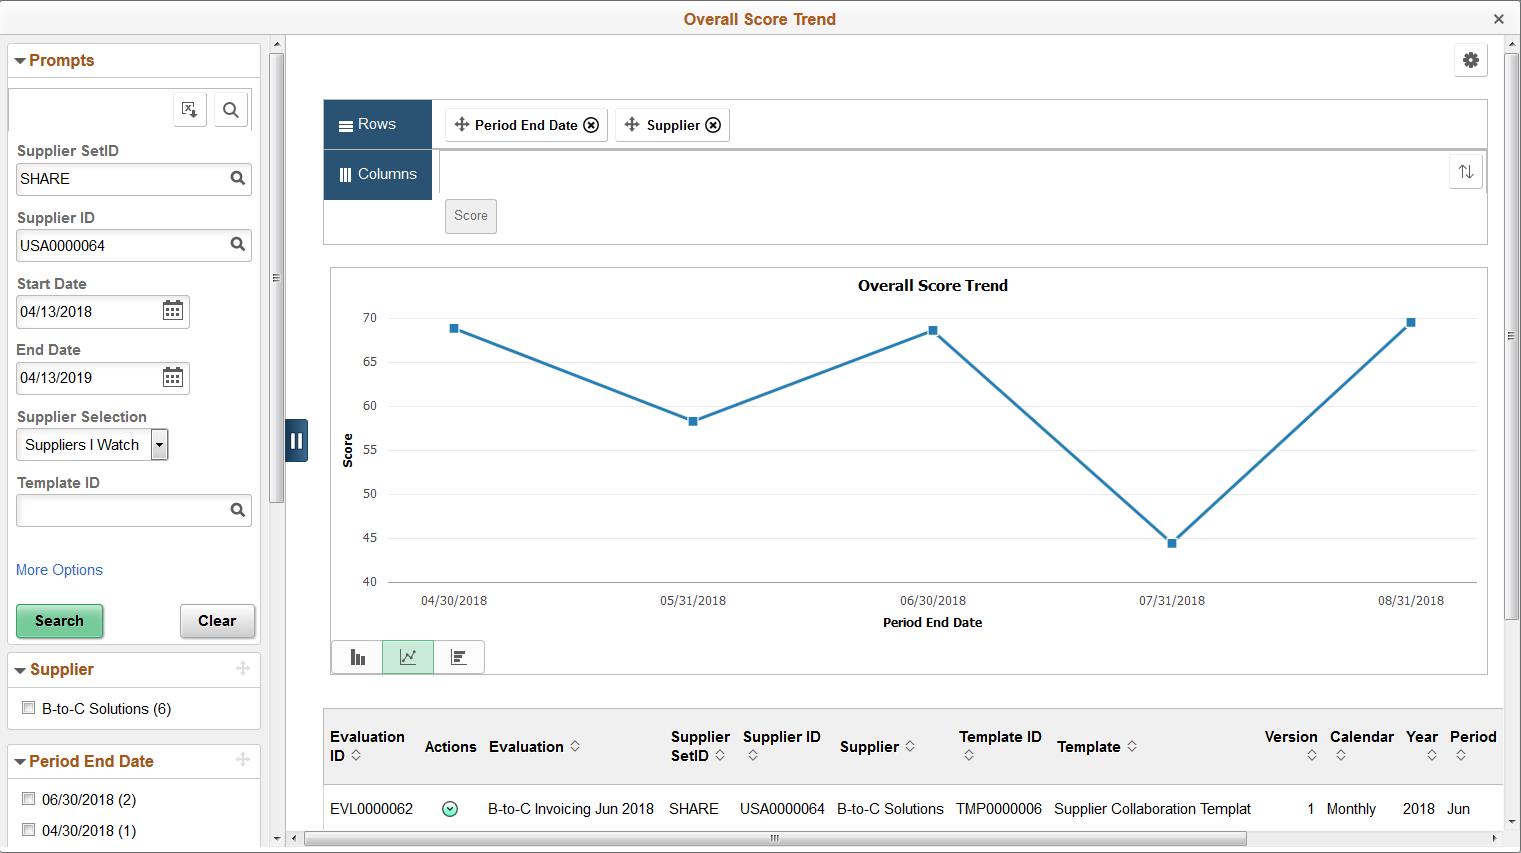
Overall Score Trend Page
The Overall Score Trend page displays the overall score trend graph and detail chart for the selected supplier.
Select the Extend icon for further analysis.
This example illustrates the fields and controls on the Overall Score Trend page.
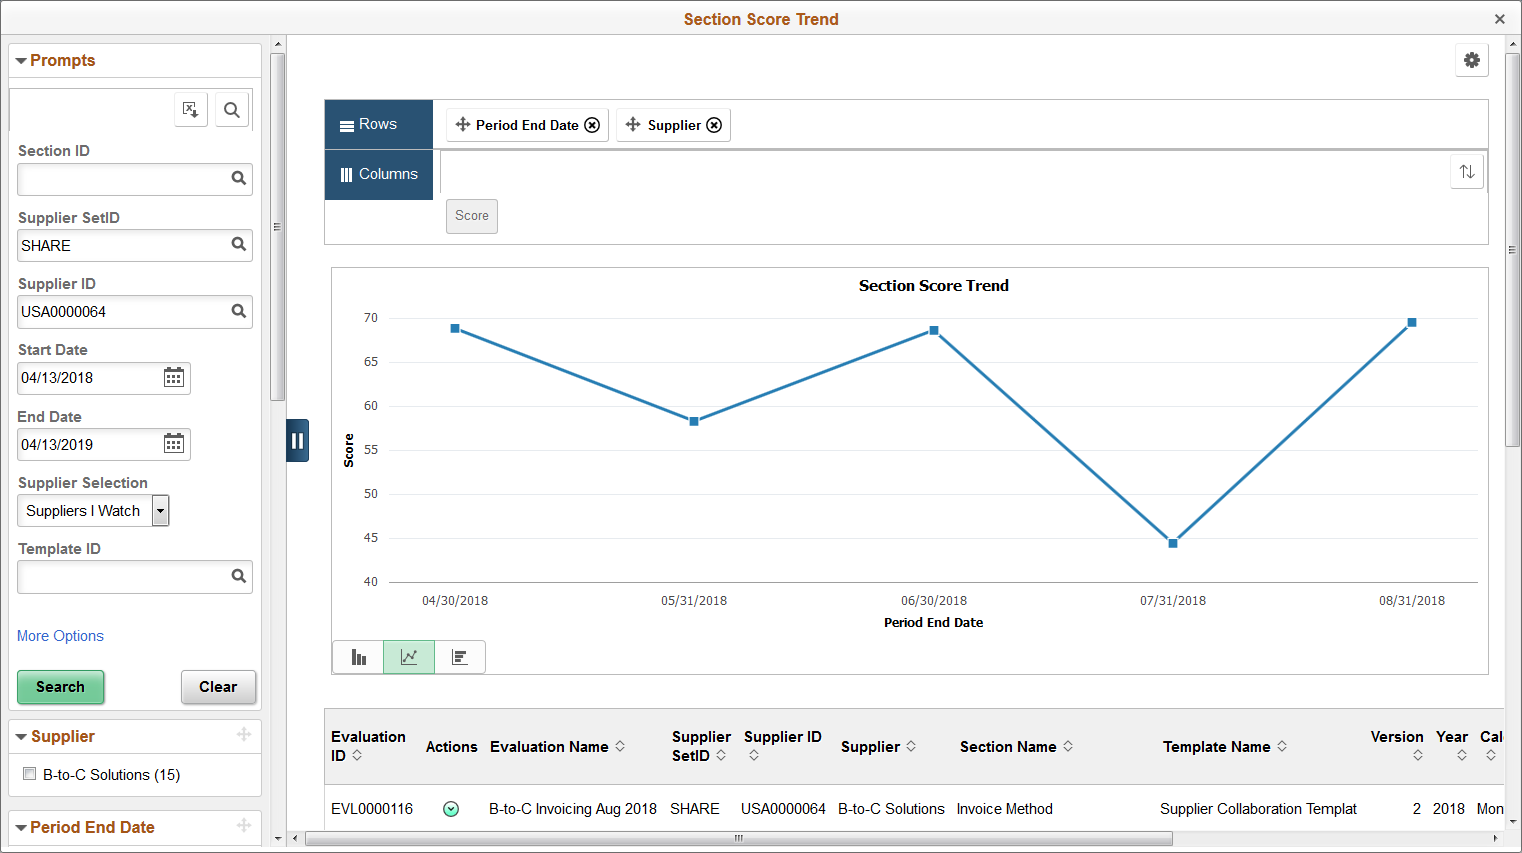
Section Score Trend Page
The Section Score Trend page displays the section score trend graph and detail chart for the selected supplier.
Select the Extend icon for further analysis.
This example illustrates the fields and controls on the Section Score Trend page.
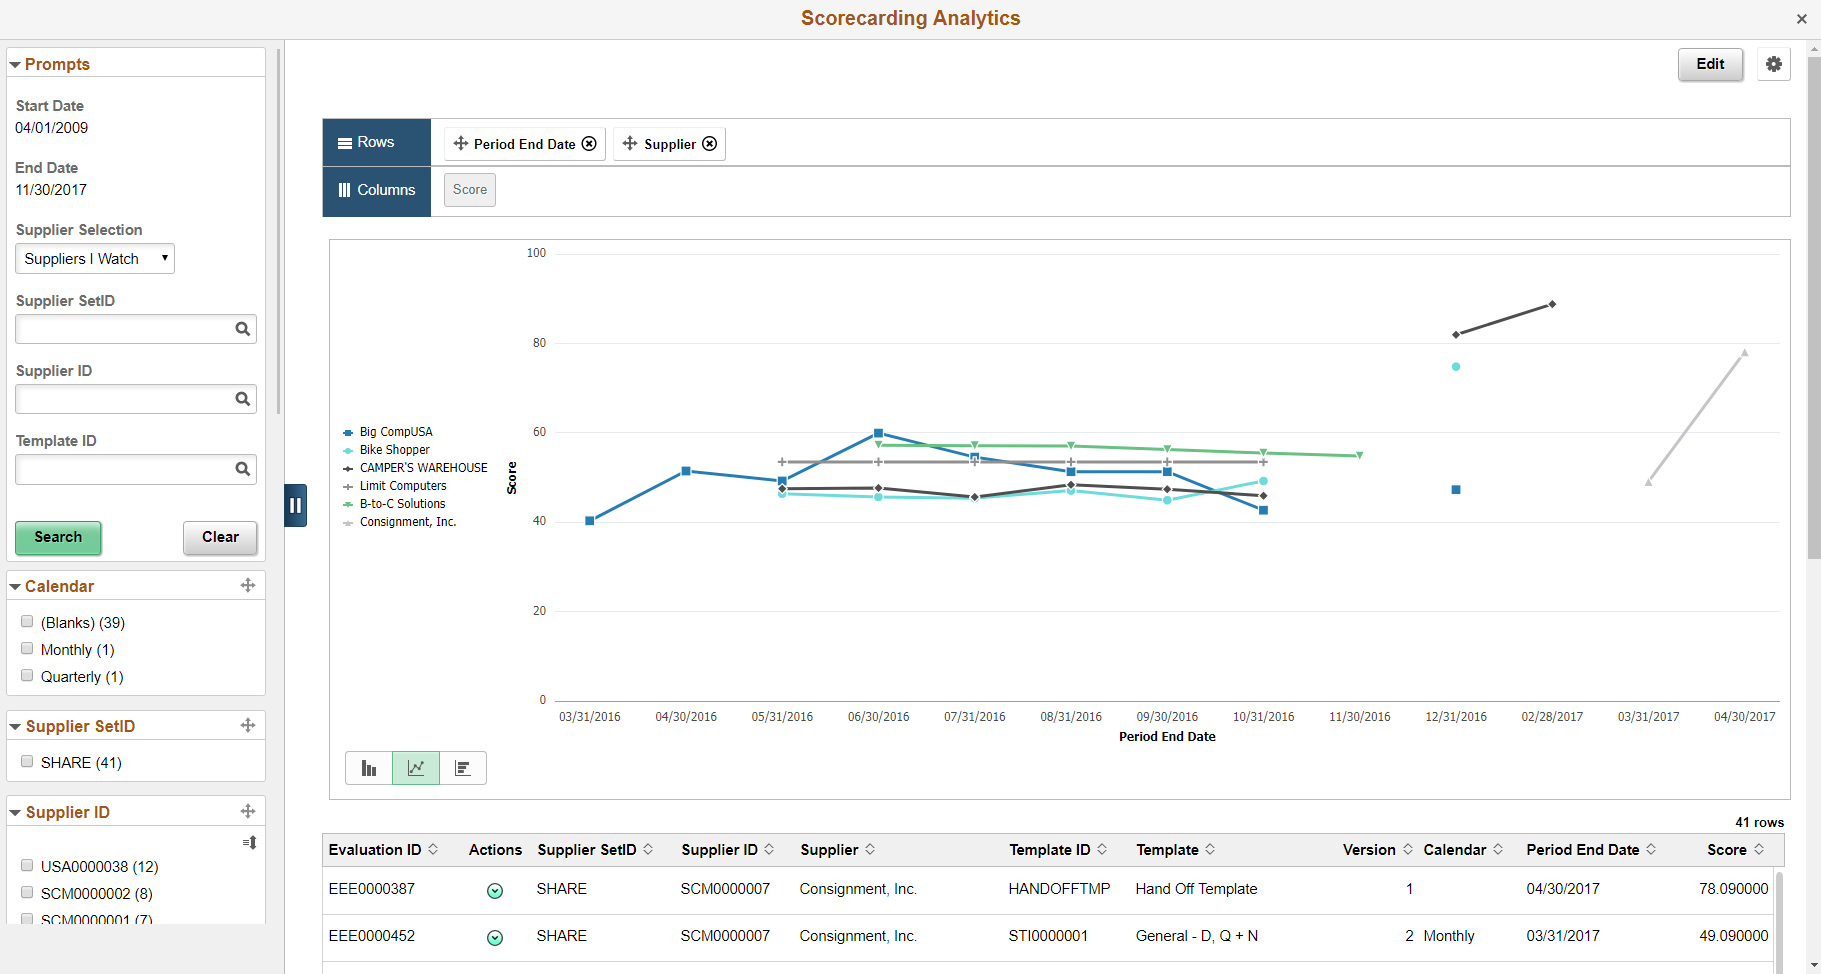
My Analytics Tab
The My Analytics tab helps you to create and execute your own Analytics reports for a supplier you select or for all suppliers on watch. To do this, you must enable Simplified Analytics in the Supplier Watch List.
You can create Analytics for Overall Score Trend and Section Score Trend. After you have created these scorecard analytics, you can analyze and see how the selected supplier compares to the other suppliers on watch.
This example illustrates the fields and controls on the Scorecard Analytics page.
Use the Overall Score Rank page (PTPG_NUI_VWR) to view the first five suppliers by highest score rank, lowest score rank, recently evaluated, and so forth. Default supplier selection criteria is set using the ScoreCarding Defaults page.
Navigation:
This example illustrates the fields and controls on the Overall Score Rank page.
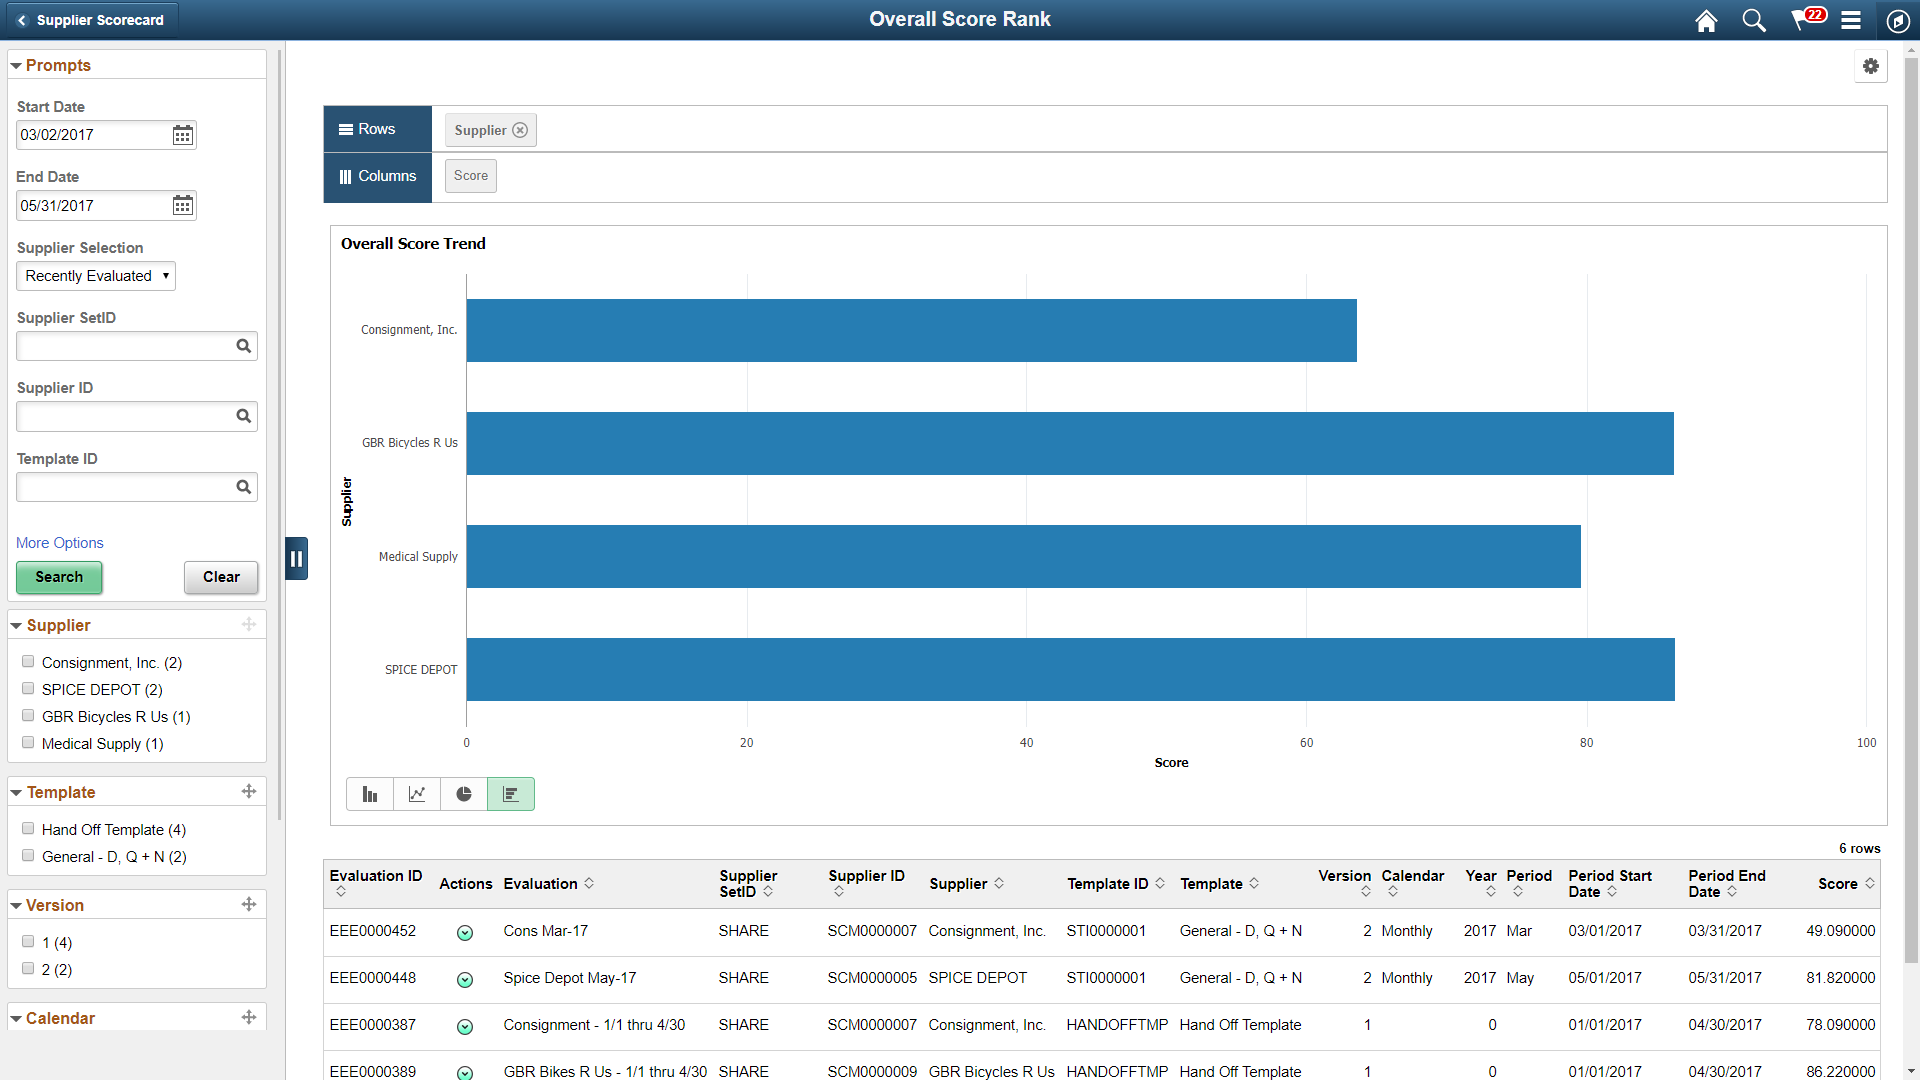
Use the options in the Actions button on the grid to drill down to the details of an Evaluation.
Note: Default supplier selection criteria is set using the ScoreCarding Defaults Page.
Use the Overall Score Trend page (PTPG_NUI_VWR) to view the first five suppliers by highest score trend, lowest score trend, recently evaluated, and so forth. Default supplier selection criteria is set using the ScoreCarding Defaults page.
Navigation:
This example illustrates the fields and controls on the Overall Score Trend page.
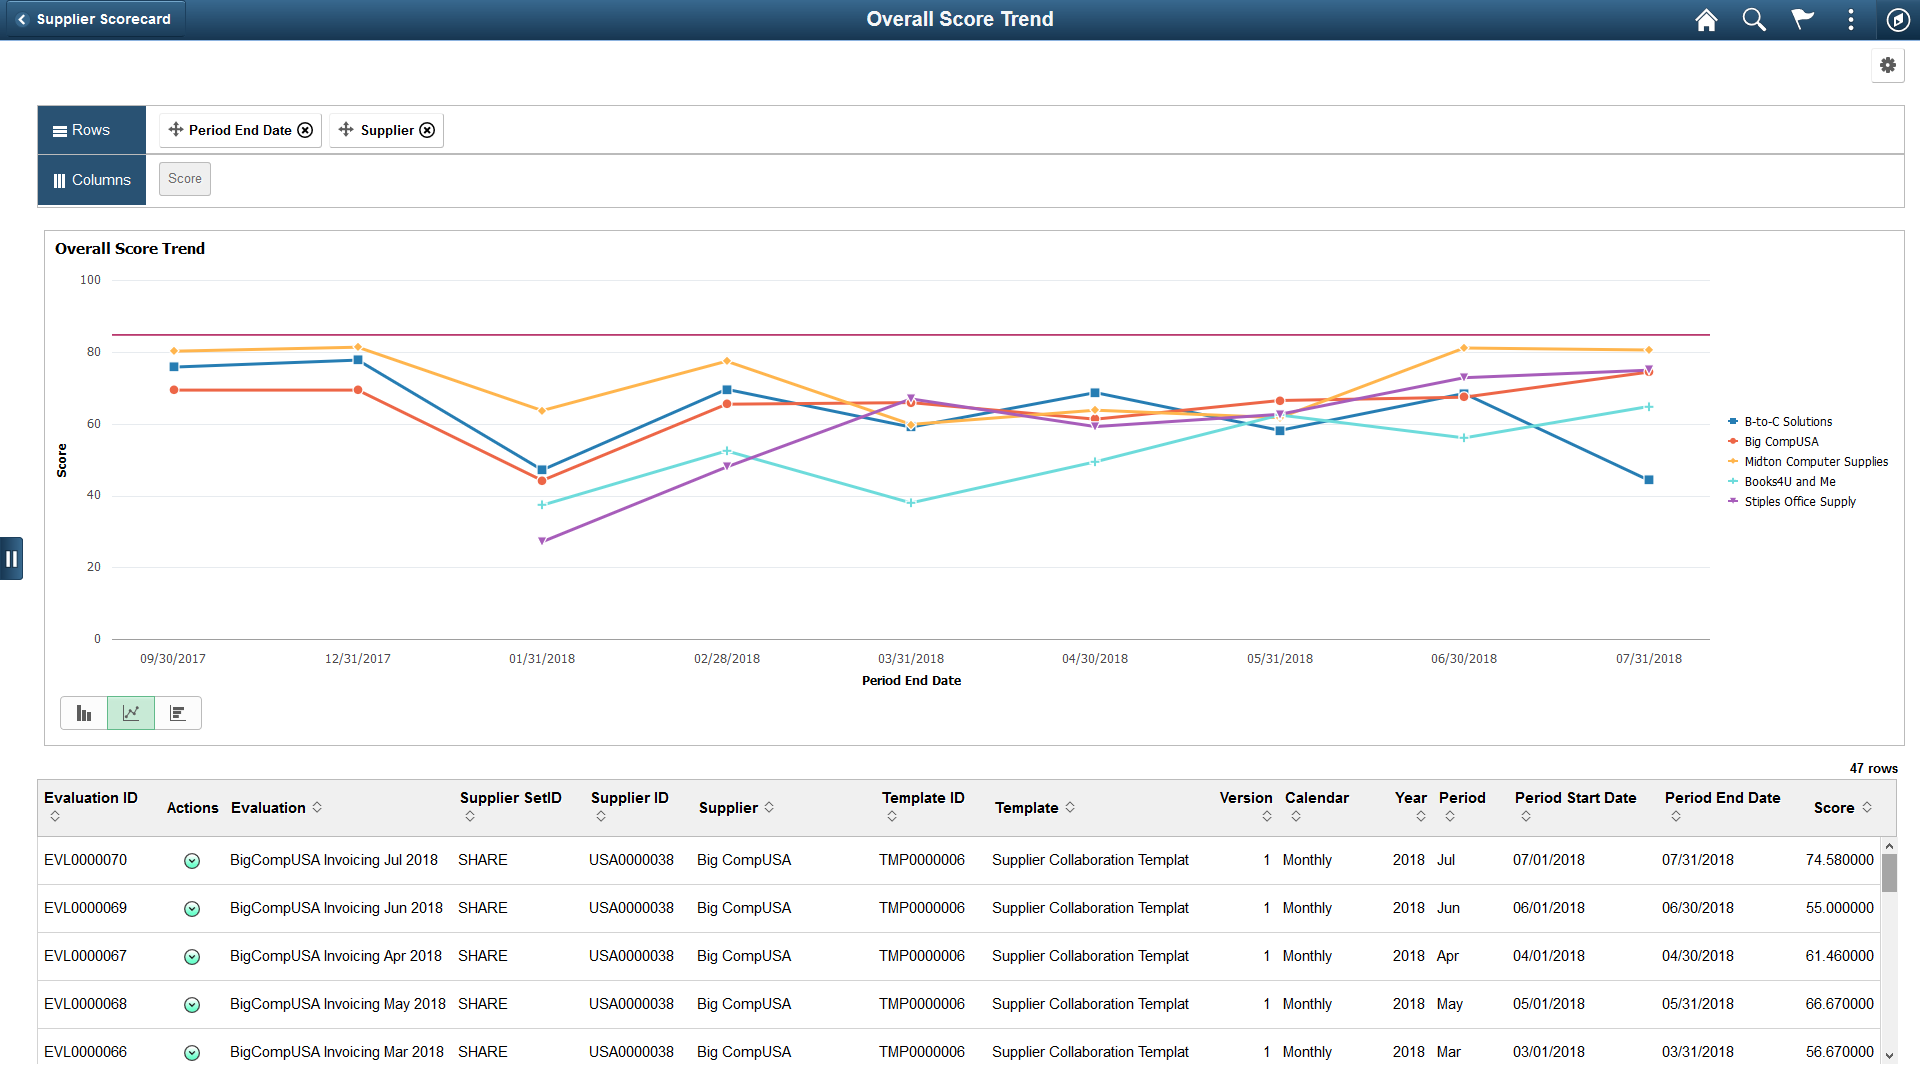
Use the options in the Actions button on the grid to drill down to the details of an Evaluation.
Note: Default supplier selection criteria is set using the ScoreCarding Defaults Page.
This example illustrates the fields and controls on the View Evaluation page.