 Understanding Portfolio Analysis
 This chapter provides an overview of portfolio analysis and discusses how to:
Establish project portfolios.
Establish selection rules.
Establishing project portfolio trees.
Analyze project portfolios.
See Also
Defining Measures and Dimensions
Understanding Portfolio Analysis Several elements within the Project Portfolio Management application play a part in portfolio analysis:
Project portfolios.
A project portfolio tree.
Measures and dimensions.
The Portfolio Analysis component (BC_PORTFLIO_VIEW).
For the purposes of the Project Portfolio Management application, a portfolio defines a group of related projects and project requests, and this documentation uses the term project portfolios to refer to these portfolios. Portfolios are created by using the Portfolio Definition component (BC_PORTFOLIO_DFN).
The steps to set up a project portfolio are:
Create the portfolios, using the Portfolio Definition page.
Using the Portfolio Definition - Dimension Member Selection page, specify which projects and project requests to include in the portfolio, using one of these methods:
Specify each project or project request individually, by selecting its ID.
Define a rule that retrieves the projects.
Use the Dim Member Select component (BC_KPI_FILTER) pages to define the rule.
Create your project portfolio tree.
As you define each node, select the portfolio ID to use for that node.
A project portfolio tree depicts the hierarchical relationship of project portfolios within your organization. For example, you can establish a tree where the root node represents all corporate projects, the next level represents departments or regions, and the lowest level is made up of project portfolios categorized by functional grouping, such as sales projects, finance projects, and so on. You must establish project portfolios before you can define a project portfolio tree.
The PORTFOLIO_PPK tree structure is required for any project portfolio trees that you create. The tree must be a node-oriented (winter) tree. Each tree node within a project portfolio tree must be a defined portfolio. The nodes at the lowest level of the tree represent portfolios of projects and project requests, those at higher levels represent the organizational categories within which you group your project portfolios, and the points at which the project data is summarized. The illustration below shows an example of the project portfolio tree, PORTFOLIO_DEMO, that is delivered with the demo database.
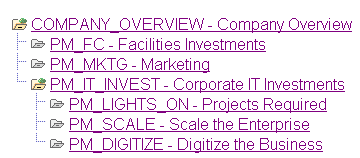
PORTFOLIO_DEMO tree
Note. By definition, every portfolio requires a dimension member (a project request ID or project ID in the case of project portfolios). Therefore, when you define a portfolio that will be used for a summary node, it must have at least one project ID or project request ID associated with it. For portfolio analysis the system considers only the project requests and projects that are associated with nodes at the lowest level of the tree (the terminal nodes). The system excludes any projects and project requests associated with summary level nodes; they don't appear on the Portfolio Analysis page, nor is their data used to compute aggregated results.
Measures and Dimensions
Measures and dimensions are the project and project request data that is available to be analyzed by using the Portfolio Analysis page. Measures are data from numeric-based fields, such as estimated costs and return on investment, while dimensions are data from character-based fields, such as project owner and requesting department. Measures and dimensions are established by using the Define Measures/Dimensions page. These measures and dimensions comprise the list of values that are available to use as data for an analysis chart. Measures and dimensions are established at the system level, and once defined, are available for all users when using the Portfolio Analysis component.
The Portfolio Analysis Component
The Portfolio Analysis component displays a chart and lists the values of the measure and dimension data for the projects and project requests that are associated with the terminal nodes of a project portfolio tree. The component includes a section for configuring the chart, an interactive view of the project portfolio tree, the generated chart, and a grid that contains two tabs—one that displays the values for the charted project portfolios, and one that displays the values for up to four additional measures. These additional measures can include key project metrics that you wish to analyze but choose not to include in the chart; they are established per user by using the Additional Portfolio Measures page.
Using this page, you navigate through the project portfolio tree to view the data associated with the selected node. If the selected node has nodes that are subordinate to it, the data that appears is aggregated from the immediate subordinates of that node using the summarization rules specified for that dimension or measure. If the selected node has no subordinates, then the data that is viewed will be for each of the projects and project requests within that portfolio.
Each user can save their own configured analysis “views”, and specify which view is the default view. To examine a particular set of portfolios or project requests you can also selectively choose which to chart.
The following chart types are provided:
Line.
Bar (two dimensional or three dimensional).
Stacked bar (two dimensional or three dimensional).
Pie (two dimensional or three dimensional).
Bubble.
Each chart type has different data and label requirements and options. For example, a bubble chart uses four labels, as illustrated in the following graphic:
Establishing Project Portfolios To establish project portfolios, use the Portfolio Definition component (BC_PORTFOLIO_DFN).
This section discusses how to:
Define project portfolios.
Specify the project requests and projects to include.
Note. The Portfolio Definition component contains several pages that are not used for project-based portfolios or the Portfolio Analysis component. Information about those pages, and creating scorecard and KPI-based portfolios, is available in the PeopleSoft Enterprise Scorecard 9.0 PeopleBook.
 Pages Used to Establish Project Portfolios
|
Page Name |
Object Name |
Navigation |
Usage |
|
BC_PORTFOLIO_DFN |
Project Portfolio Management, Portfolios, Create/Edit Portfolio, Portfolio Definition |
Create a portfolio definition. |
|
|
BC_PORTFLIO_OBJ |
Project Portfolio Management, Portfolios, Create/Edit Portfolio, Dimension Member Selection |
Specify which projects to include in the portfolio. |
Defining Project Portfolios
Access the Portfolio Definition page.
|
Description |
Enter a description for the project portfolio. |
|
Select a tree. Portfolios have multiple uses in the various Scorecard applications. For the purposes of defining project portfolios to use with the Portfolio Analysis component, this tree has no function, and you can use any tree. In fact, you may prefer to create a tree that has only a single node to assign to all project portfolios to meet the requirement. However, if you intend to use this portfolio as a scorecard portfolio, this tree is used to determine the strategy components in the portfolio. |
Specifying the Project Requests to Include Access the Portfolio Definition - Dimension Member Selection page.
|
Member List Type |
Specify how to define the project request member IDs. Options are: Defined by Dimension Member: Select to specify each project request by its ID, then add rows in the Dimension Members grid and select the project requests to include. Defined by Selection Rule: Select to use a rule that defines which project requests to include. Specify the rule to use in the Selection Rule field. |
|
Selection Rule |
Select the rule that defines which dimension members to select. This field is unavailable for entry unless theMember List Type field is set to Defined by Selection Rule. |
|
View Selection Rule |
Click to access the Dim Member Select page and review the rule. This link is only available when the Member List Type field is set to Defined by Selection Rule. |
|
Create Selection Rule |
Click to access the Dim Member Select page and add a new rule. This link is only available when the Member List Type field is set to Defined by Selection Rule. |
Establishing Selection RulesThis section discusses how to:
Define dimension member selection rules.
Define an advanced rule.
Preview project request IDs.
Pages Used to Establish Selection Rules|
Page Name |
Object Name |
Navigation |
Usage |
|
BC_KPI_FILTER |
|
Define a rule that specifies which project request IDs to include in a portfolio. |
|
|
BC_KPI_FILTER_ADV |
Scorecards, Administration, Portfolio Objects, Dim Member Selection Rule, Advanced Selection |
Extend the selection rule by specifying criteria for fields that are outside of the dimension. |
|
|
BC_KPI_FILTER_VIEW |
Scorecards, Administration, Portfolio Objects, Dim Member Selection Rule, Dim Member Preview |
Preview the list of dimension members that are retrieved by this selection rule. |
Defining Dimension Member Selection Rules Access the Dim Member Select page.
|
Dimension |
Select the dimension from which the rule retrieves members. |
|
Clear Selection |
Click this link to clear the current selection criteria. |
Dimension Selection
Insert rows as needed to compose the criteria used for the rule.
|
Open and Close |
Select the number of opening or closing parentheses needed for the selection criteria. |
|
Field Name |
Select the field to use for the filter criteria. |
|
Comparison Operator |
Select the operator to use as selection criteria. Options are: <: Less than. <=: Less than or equal to. =: Equal to. >: Greater than. >=: Greater than or equal to. Like: Like the comparison value. Valid only for character type fields that have no associated lookup tables. The system programmatically appends a wildcard to the end of the lookup value that you enter. Not =: Not equal to. Not Like: Not like the comparison value. Valid only for character type fields that have no associated lookup tables. The system programmatically appends a wildcard to the end of the lookup value that you enter. |
|
Value |
Enter or select the comparison value. |
|
And/Or |
Select either AND or OR to relate one line to the next of the filter criteria. |
Defining an Advanced Rule Access the Dim Member Select - Advanced Selection page.
To extend the object selection rule to additional dimension fields, insert one or more Additional Selection sections and specify additional data and criteria to further qualify your selection. You may use KPI data or other data that can be associated with the dimension of this rule. For example, you could define an advanced rule to limit your projects to those that have a negative trend.
|
Clear Selection |
Click to clear the current selection criteria. |
Additional Selection
|
Record Type |
Specify the type of record to use. Options are: Associate with Dimension: Select to use records from dimension data for this filter. KPI Data: Select to use KPI records for this filter. Your selection controls which records appear in the selection list for the Additional Record field. |
|
Additional Record |
Select to the record upon which to base your additional criteria. |
|
Relationship to other criteria |
Indicate how this criteria is used with respect to the other criteria, either And or Or. |
Additional Search Fields
Insert rows to specify the criteria. These fields are described in the page description for the Dim Member Select page.
See Defining Dimension Member Selection Rules.
Previewing Project Request IDs
Access the Dim Member Select - Dim Member Preview page.
Preview Parameters
Enter the parameters for viewing the project and project request IDs this rule retrieves by completing the fields and clicking Show Results.
Dimension Members
This grid shows the project requests retrieved by the rule for the specified parameters.
Establishing Project Portfolio TreesThis section discusses how to create project portfolio trees.
Page Used to Establish Project Portfolio Trees
|
Page Name |
Object Name |
Navigation |
Usage |
|
Tree Definition and Properties |
PSTREEDEFN |
|
Use PeopleTools Tree Manager to create a project portfolio tree. |
Creating a Project Portfolio TreeTo create a project portfolio tree:
Using PeopleSoft Tree Manager, create a tree, using the PORTFOLIO_PPK structure.
Set levels to Strictly Enforced.
Add nodes to the tree, selecting the portfolio ID for each node.
Note. You must create the portfolio IDs prior to inserting them as nodes of the tree.
See Also
Establishing Project Portfolios
Enterprise PeopleTools PeopleBook: PeopleSoft Tree Manager
Analyzing Project PortfoliosThis section discusses how to:
Configure the analysis and review results.
Specify the analysis parameters.
View costs and benefits by fiscal year or period.
See Also
Establishing Portfolio Analysis Preferences
Pages Used to Analyze Project Portfolios|
Page Name |
Object Name |
Navigation |
Usage |
|
Portfolio Analysis |
BC_PORTFLIO_VIEW |
|
Analyze important metrics for multiple project requests. |
|
Portfolio Analysis Search |
BC_PORTVIEW_FILTER |
Click Change User Preferences on the Portfolio Analysis page. |
Specify analysis parameters. |
|
Project Period View |
BC_PROJECT_VIEW |
Click the View Projects by Periods link on the Portfolio Analysis page. |
Review estimated costs and benefits per project request, by accounting period or fiscal year. |
Configuring the Analysis and Reviewing Results Access the Portfolio Analysis page.
Note. If the portfolio analysis preference settings have not been established by using the User Portfolio Preferences component, the Portfolio Analysis Search page automatically appears and must be completed before you access the Portfolio Analysis page.
Chart Parameters
Expand this group box to configure the portfolio analysis, or select a previously saved analysis configuration.
|
Analysis |
Select an analysis from the drop-down list to view a previously saved analysis. |
|
Default Analysis |
Select to set the current analysis configuration as the analysis that appears whenever you access this page. |
|
Save Analysis |
After defining the chart parameters, click to save the currently defined analysis. There are several ways to save an analysis configuration:
|
|
Chart Title |
Enter the title for the chart. |
|
Chart Type |
Select the type of chart to generate. Options are: Bar Chart - 2d: Select to generate a two dimensional bar chart. Bar Chart - 3d: Select to generate a three dimensional bar chart. Bubble Chart: Select to generate a bubble chart. Line Chart: Select to generate a line chart. Pie Chart - 2d: Select to generate a two dimensional pie chart. Pie Chart - 3d: Select to generate a three dimensional pie chart. Stacked Bar - 2d: Select to generate a two dimensional stacked bar chart. Stacked Bar - 3d: Select to generate a three dimensional stacked bar chart. |
|
Additional Line Plot and Plot Data |
Select this check box to include an overlay line on the chart, and select the measure to use for its data. This option is available only for bar charts and stacked bar charts. |
|
X Axis |
Select the dimension or measure to use as the data for the X axis. For line and bubble charts, the available values are measures, for the remaining chart types, the available values are dimensions. |
|
X Title |
Enter the X axis title. |
|
Y Axis |
Select the measure to use as data for the Y axis. |
|
Y Title |
Enter the Y axis title. |
|
Y1 Data |
Select the dimension or measure to use as the 2nd set of data to stack vertically on the bars. This option is available only for stacked bar charts. |
|
Y2 Data |
Select the dimension or measure to use as the 3rd set of data to stack vertically on the bars. This option is available only for stacked bar charts. |
|
Y3 Data |
Select the dimension or measure to use the 4th set of data to stack vertically on the bars. This option is available only for stacked bar charts. |
|
Size |
Select the dimension or measure to use as the data for the bubble size. This option is available only for bubble charts. |
|
Color |
Specify which measure's assessment color to use as the bubble color. This option is available only for bubble charts. |
|
X Label 1 |
Enter text for the label. This option is available only for bubble charts. It represents the trend, and appears as the left-most label on the X axis. |
|
X Label 2 |
Enter text for the label. This option is available only for bubble charts. It represents the trend, and appears as the right-most label on the X axis. |
|
Y Label 1 |
Enter text for the label. This option is available only for bubble charts. It is the label that appears lowest on the Y axis. |
|
Y Label 2 |
Enter text for the label. This option is available only for bubble charts. It is the label that appears highest on the Y axis. |
|
Delete |
Click to delete the current saved analysis configuration. |
Portfolio KPI - Measures in Chart
This grid lists the detail values of the measures or dimensions used as chart data, and contains the following columns:
|
<portfolio tree description> |
Lists the description of the portfolio tree used in the analysis. Click the description to access the Portfolio Definition - Dimension Selection page if the row is a node ID from the project portfolio tree, or the Project Request definition page, if the row is a project request ID. |
The first row in the grid is the description of the selected tree node. The remaining rows are either the directly subordinate nodes, or if the selected tree node is the lowest-level node, the project IDs associated with that node. The aggregated values for nodes are controlled by the rules established in the Define Measures/Dimensions page.
See Also
Establishing Portfolio Analysis Preferences
Defining Measures and Dimensions
Specifying the Analysis ParametersAccess the Portfolio Analysis Search page.
|
Business Unit, Scenario ID, Fiscal Year, and Accounting Period |
Select the organization and time period to view. |
|
Portfolio Tree |
Select the project portfolio tree to use for the analysis. This determines which project requests are included. |
|
Change User Preferences |
Click this link to access the User Portfolio Preferences component, where you can modify the settings that determine the default business unit, accounting period, scenario, and portfolio tree that are used by the Portfolio Analysis page. |
|
Add a New Portfolio Tree |
Click this link to access Tree Manager, where you can add a new portfolio tree. |
Viewing Costs and Benefits by Fiscal Year or Period Access the Project Period View page.
|
View By |
Select the time period by which to view project costs and benefits. |
|
Chart Type |
Select Line to view a line chart of the costs and benefits over time. |
|
Estimated Project Request Cost and Estimated Project Request Benefit |
Expand or collapse these grids to view or hide the estimated costs and benefits for each project in the portfolio by accounting period or fiscal year. |