Managing Forecasts
This topic discusses how to:
Select the forecast action.
Roll up and analyze forecasts.
Analyze forecast subtotals.
View details of all forecasts.
Note: Usually, access to the Search Rollup Forecasts component is limited to managers. Depending on access profile limitations, you may not be able to view these menu options and page fields. The views available to a manager depend on the setting of the CORE_RSF_FCAST_SIMPLE functional option.
|
Page Name |
Definition Name |
Usage |
|---|---|---|
|
RSF_FCAST_REVIEW |
Manage and review forecasts. |
|
|
RSF_FCAST_ALLS |
Edit and review forecast details. |
|
|
RSF_FCAST_SUMMARY |
Analyze forecast subtotals. |
|
|
Select Columns to Display Page |
RSF_FCAST_FILTER |
Select filters for data to display for the subtotals view. |
|
Forecast Page |
RSF_FCAST_CHART |
Display summary data on a chart. |
Field or Control |
Description |
|---|---|
Forecast View |
Select a view for the page. Values are Charts, Combined Forecasts, Interactive Reports, Manager Review, and Subtotals. |
View as |
Enter a sales user for the forecast view. |
Forecast of |
Select either Forecast or Shadow. |
View Currency |
Select the currency in which to express the forecast amounts. The default is the sales user's default currency. |
Use the Forecast page (RSF_FCAST_REVIEW) to manage and review forecasts.
Navigation:
Select Manager Review as the forecast view.
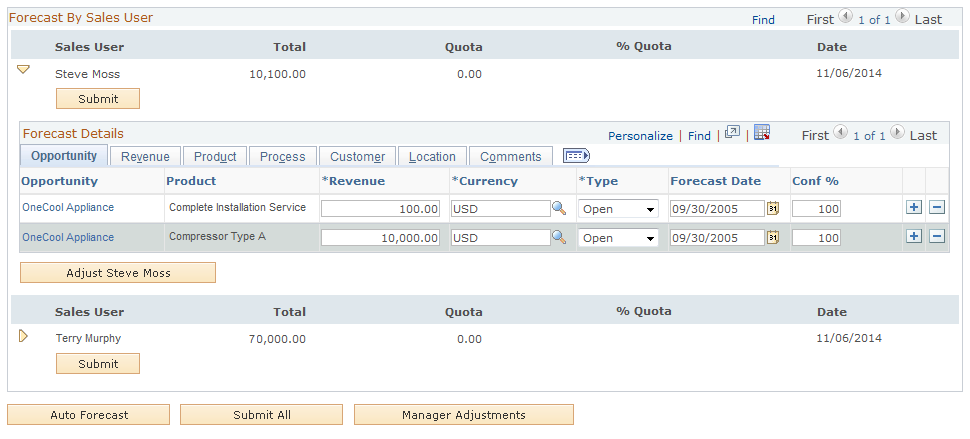
This example illustrates the fields and controls on the Forecast page displaying data in manager review (1 of 2).
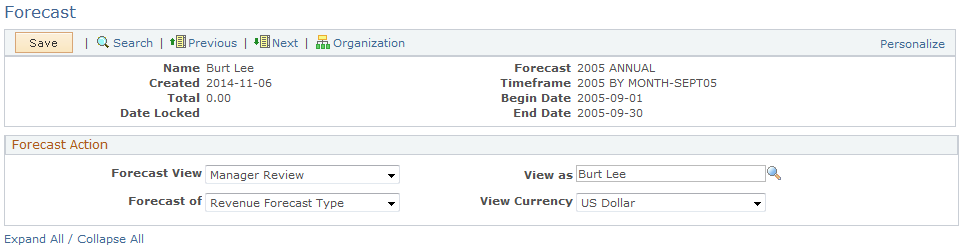
This example illustrates the fields and controls on the Forecast page displaying data in manager review view (2 of 2).
Note: The system displays forecast amounts in the default currency of the sales user who accesses the forecast, not in the default currencies of the sales users whose forecasts are listed.
Field or Control |
Description |
|---|---|
Expand All / Collapse All |
Click this link to display forecast details and view or adjust data for all sales users who are listed on the page. If the details are displayed, click this link to hide forecast details for all sales users. Note: You can display or hide the details for an individual sales user by clicking the triangle next to the user. |
Submit |
Click this button for each forecast that you want to submit. After you have submitted the forecast for a sales user, the Submit button becomes unavailable and changes to Submitted. A submitted forecast cannot be edited. |
Revenue |
Enter the amount of revenue that is anticipated from the sale. |
Currency |
Enter the currency code. |
Forecast of |
Select a user-defined forecast type. See Forecast Type Page. |
Forecast Date |
Enter the estimated date that the sale will occur. |
Conf % (confidence percentage) |
Enter a whole number which specifies the probability that the forecast will became an actual sale. |
Adjust <sales user> |
Click this button to add a row and make adjustments to a particular sales user's forecast data if it has not previously been submitted. |
Auto Forecast |
Click to generate a forecast for each direct report who has opportunity activity but does not already have a forecast listed. You cannot automatically generate the same forecast for an individual more than once. |
Submit All |
Click to submit all forecasts. You cannot edit forecasts after they have been submitted. |
Manager Adjustments |
Click this button to add a row and make adjustments to the overall forecast total. The system inserts manager adjustments under the manager's name. |
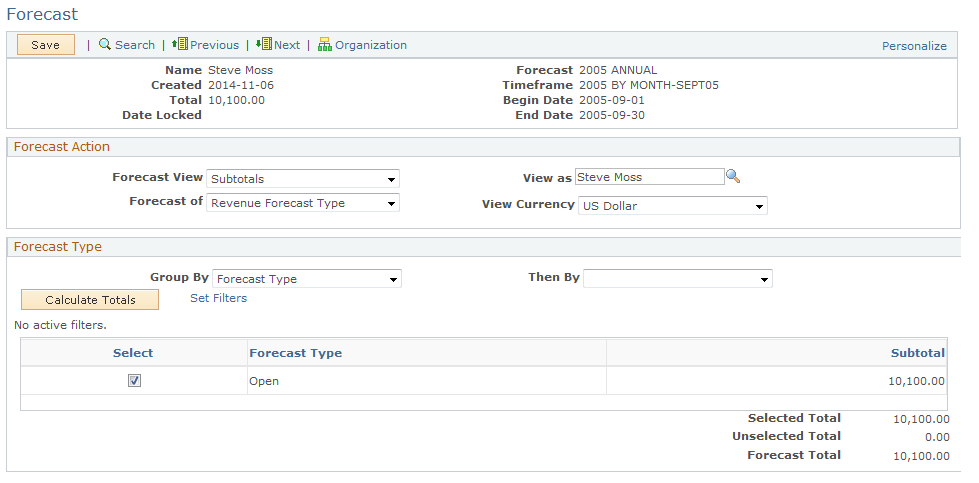
Use the Forecast page (RSF_FCAST_SUMMARY) to analyze forecast subtotals.
Navigation:
Select Subtotals as the forecast view.
This example illustrates the fields and controls on the Forecast page displaying data in subtotals view.
Field or Control |
Description |
|---|---|
Group By and Then By |
You can use subtotals to generate and view a forecast's subsets. For example, suppose that the overall forecast is for November 2004 and you want to know the confidence levels that make up the forecast and you want to know those levels by region. In that case, you would select Confidence % in the Group By field and Region in the Then By field. Note: You must enter a value in the Group By field to use subtotals. |
Calculate Totals |
After you have selected the subtotal groupings, click this button to calculate the subtotals for the groupings. |
Set Filters |
Click this link to access the Select Columns to Display page, where you can filter the data to be displayed. |
Select |
Select the check box next to each item that you want to group into a separate subtotal. The sum for the selected items appears as the selected total, and the sum of items that are not selected is the unselected total. For example, suppose that 10 rows appear and you select this check box for the first, third, and fifth rows. The selected total is the sum of the first, third, and fifth rows, and the unselected total is the sum of the seven rows that you did not select. |
Filtering Data
Access the Select Columns to Display page (Select the Set Filters link on the Forecast page.
This example illustrates the fields and controls on the Select Columns to Display page.
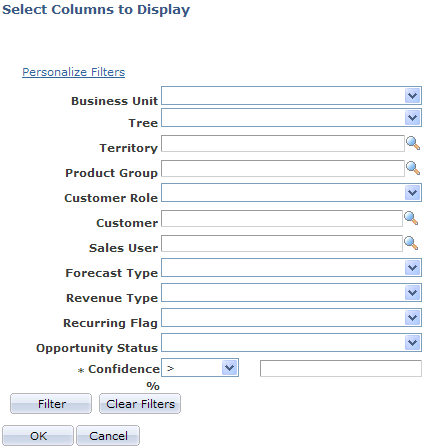
After you select values to use as filters for the data displayed for the subtotals view, click the Filter button to filter the data. You can choose to use other available filters by clicking the Personalize Filters link.
Use the Forecast page (RSF_FCAST_ALLS) to edit and review forecast details.
Navigation:
Select Combined Forecasts as the forecast view.
This example illustrates the fields and controls on the Forecast page displaying data in combined forecasts view.
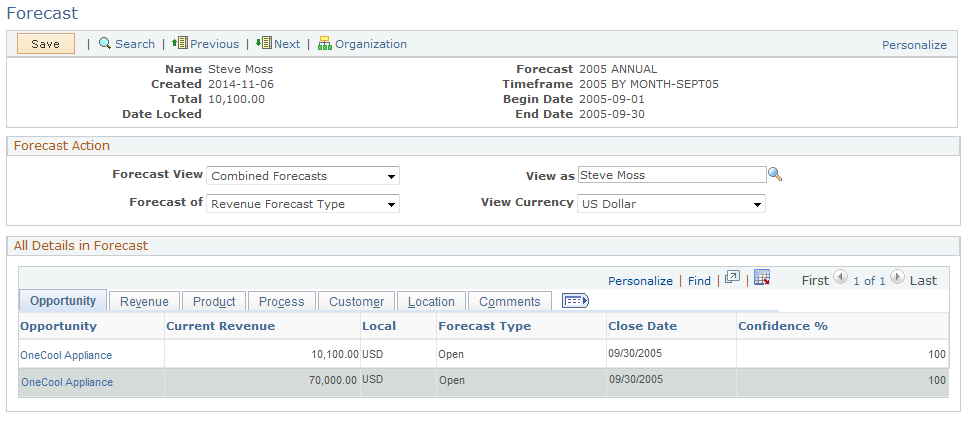
Select Combined Forecasts as the forecast view.
This view enables the manager to see information for all the sales users' opportunities. The manager can sort the data to view, for example, the opportunities with the highest revenue. Also, the manager can click the Download button to download the opportunities to a spreadsheet.