Monitoring OpenSearch System Metrics and Indexing Metrics
PeopleSoft Search Framework delivers three dashboards and each dashboard displays several visualizations that provide you real-time data as well as historical data. These visualizations enable you to analyze data and act upon any errors if any. For example, you can use the historical data to view the indexing process and analyze any failed transaction and rectify it, if needed.
This topic aims to provide you information on the dashboards that are delivered by PeopleSoft Search Framework. For information on the other capabilities of OpenSearch Dashboards, such as building dashboards, using Discover, using Visualize, etc., refer to the OpenSearch Dashboards documentation [2.3.0], which is available on www.opensearch.org.
After configuring the monitoring server as discussed in the Configuring the Monitoring Server topic, you can deploy the delivered system monitoring dashboards and visualizations.
This topic discusses the following:
Deploy the system-monitoring visualizations.
View the dashboards and visualizations.
Create a system-monitoring visualization.
The Monitoring Visualizations page lists the dashboards that are delivered by PeopleSoft. Some of the delivered dashboards pertain to PeopleSoft Health Center that monitors the health and performance of PeopleSoft systems. Refer to Understanding PeopleSoft Health Center for a description of the dashboards.
Use the Monitoring Visualizations page to deploy the delivered system-monitoring and indexing-metrics dashboards and visualizations so that you can view the dashboards and visualizations. See Delivered Dashboards and Visualizations for a list of delivered dashboards and visualizations.
You can also use the Monitoring Visualizations page to import a system-monitoring or indexing-metrics dashboard or visualization that you have created in OpenSearch Dashboards. For more information on creating system-monitoring dashboards and visualizations, refer to Creating a Monitoring Visualization.
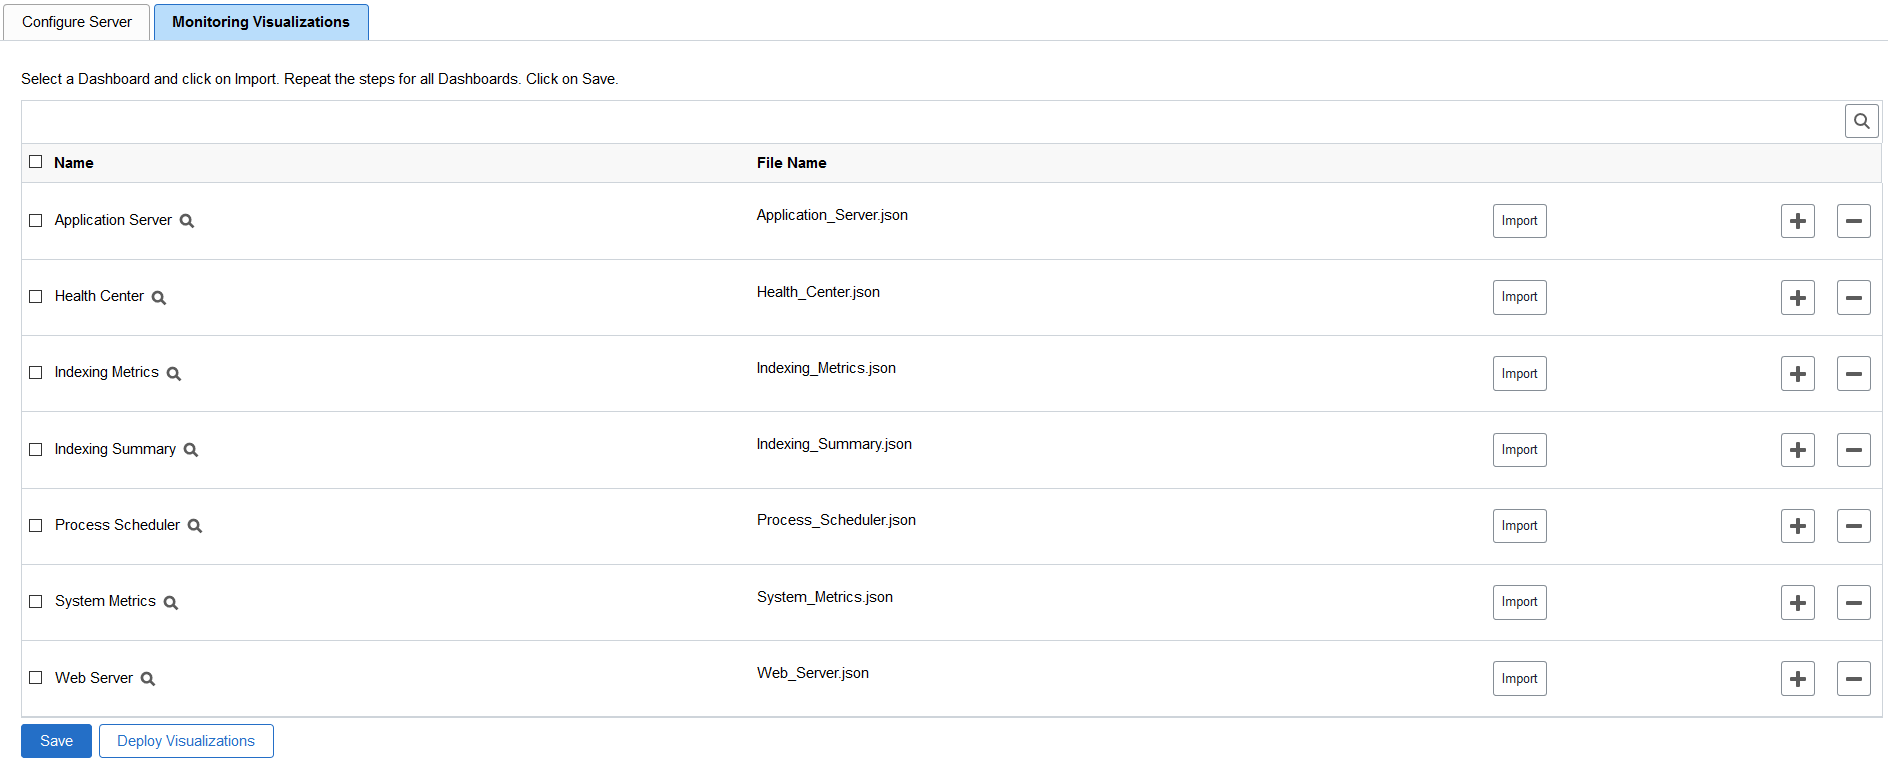
Access the Monitoring Visualizations page by selecting , and then select the Monitoring Visualizations tab.
This example illustrates the Monitoring Visualizations page. You can find definitions for the fields and controls later on this page.
Field or Control |
Description |
|---|---|
Name |
Select the Name check box if you want to select all the dashboards. |
Import |
If you create a dashboard and visualization in OpenSearch Dashboards, the dashboard is listed on this page. Select the dashboard you created and select the Import button to import the dashboard with the associated visualization into PeopleSoft. You would use the Import option when you make any changes to the dashboards. New or modified dashboards need to be imported to PeopleSoft. The import option on the Monitoring Visualizations page should be used only to import the system-monitoring, indexing-metrics, and PeopleSoft Health Center dashboards. To import application data dashboards, see Importing a Dashboard. |
Deploy Visualizations |
To use the delivered system monitoring and indexing metrics dashboards, you should deploy the dashboards (and the associated visualizations) to OpenSearch Dashboards. On successful deployment of dashboards, the following message is displayed: Visualizations indexed successfully. |
Save |
Select Save when you import a dashboard that you’ve created or modified. Note: When you deploy a visualization or dashboard, you do not need to select Save. |
Note: PeopleSoft Health Center delivers the Application Server, Health Center, Process Scheduler, and Web Server dashboards.
PeopleSoft Search Framework delivers the following dashboards and visualizations.
Note: Oracle recommends that you do not edit or delete the delivered dashboards and visualizations.
Indexing Metrics dashboard provides statistics of the transactions and segments and displays the following visualizations:
Transaction Status
Transaction/Segment Count
Segment History
Transaction History
Indexing Summary provides data of the indexing count and time taken for indexing and displays the following visualizations:
IndexCount/Process
IndexTime/Process
Index Count
System Metrics provides an overview of the health of the system and displays the following visualizations:
CPU (%) Utilization
Disk Space Utilization
JVM (%) Utilization
Total Indexed Documents
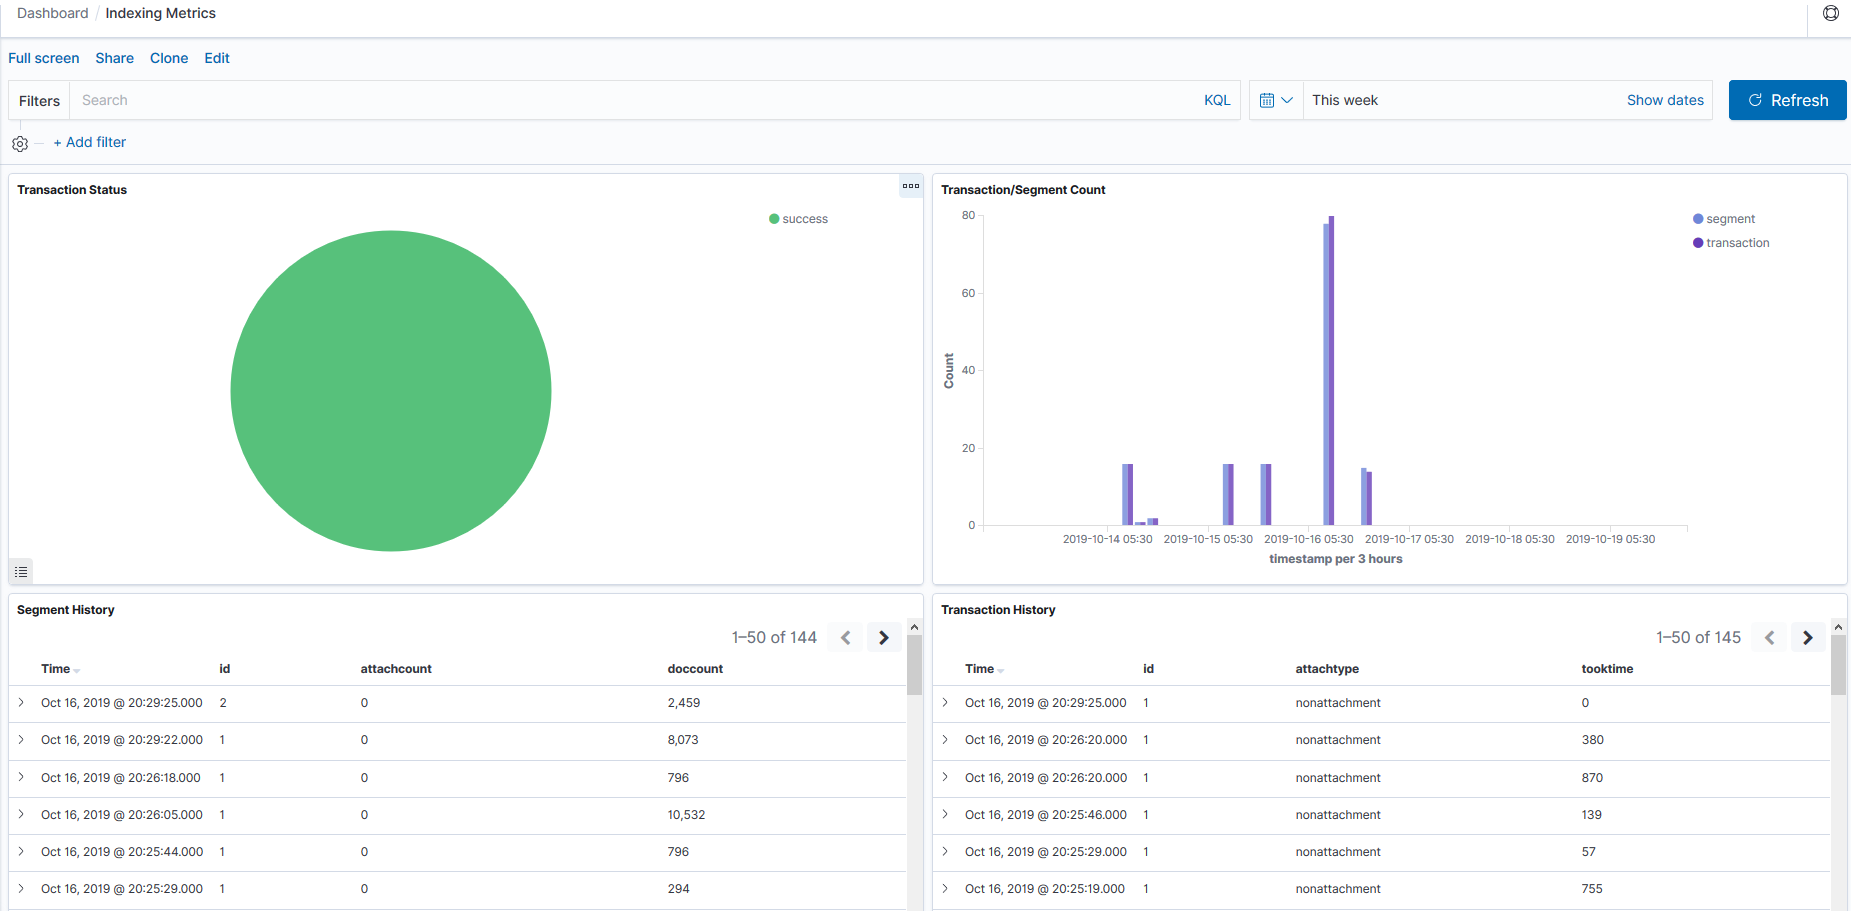
Access the Indexing Metrics dashboard by selecting Dashboard, and then selecting Indexing Metrics from the list of dashboards.
The Indexing Metrics dashboard provides statistics on the transactions and segments during indexing.
This example illustrates the visualizations on the Indexing Metrics dashboard. You can find definitions for the visualizations later on this page.
Field or Control |
Description |
|---|---|
Transaction Status |
Displays the status of transactions as a pie-chart. The transaction statuses are:
Selecting any of the slices from the pie-chart enables you to view only the transactions in the selected status in the Transaction Status visualization and the Transaction History visualization displays only the transactions of the selected status, thus enabling you to drill down to each transaction and view details of the transaction, such as process instance, index name, etc. For example, to drill down to the transactions that are in Error status and to understand why the transaction is in Error status, you can perform the following steps:
|
Transaction/Segment Count |
Displays the count of transactions and segment at a specific time period in the form of a vertical bar chart. |
Segment History |
Displays the segment history and includes the attachment count and document count in each segment. |
Transaction History |
Displays the transaction history and includes the attachment type (attachment or non attachment) in each transaction and the time taken for each transaction. |
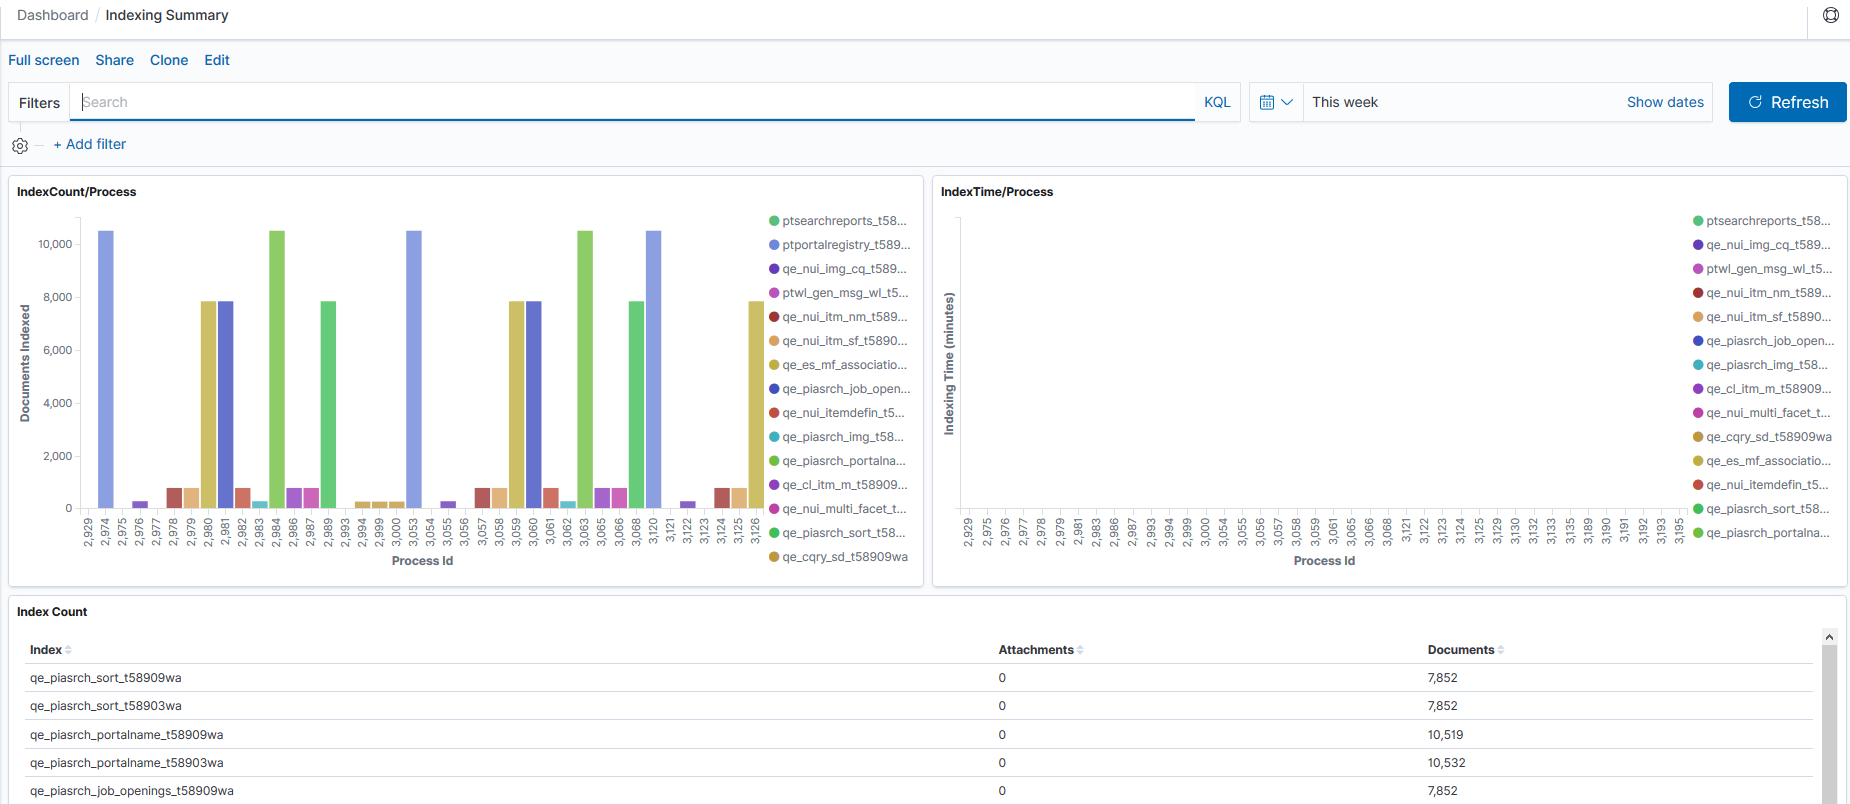
Access the Indexing Summary dashboard by selecting Dashboard, and then selecting Indexing Summary from the list of dashboards.
The Indexing Summary provides data on the indexing count and time taken for indexing.
This example illustrates the visualizations on the Indexing Summary dashboard. You can find definitions for these visualizations later on this page.
Field or Control |
Description |
|---|---|
IndexCount/Process |
Displays the documents indexed for an index and the process instance ID as a vertical bar chart. If you want to view a particular index, you can use the Search area (at the top of the page) to enter the index name. For example, if you want to obtain information on the ep_ap_payments index, you enter indexname:ep_ap_payments*. |
IndexTime/Process |
Displays the time taken for indexing documents for each index and the process instance ID as a vertical bar chart. If the document count is low, but the time taken is considerably high, then you should correlate with the System Metrics dashboard to observe whether the system was unstable. |
Index Count |
Displays the count of attachments and documents for each index in a tabular format. |
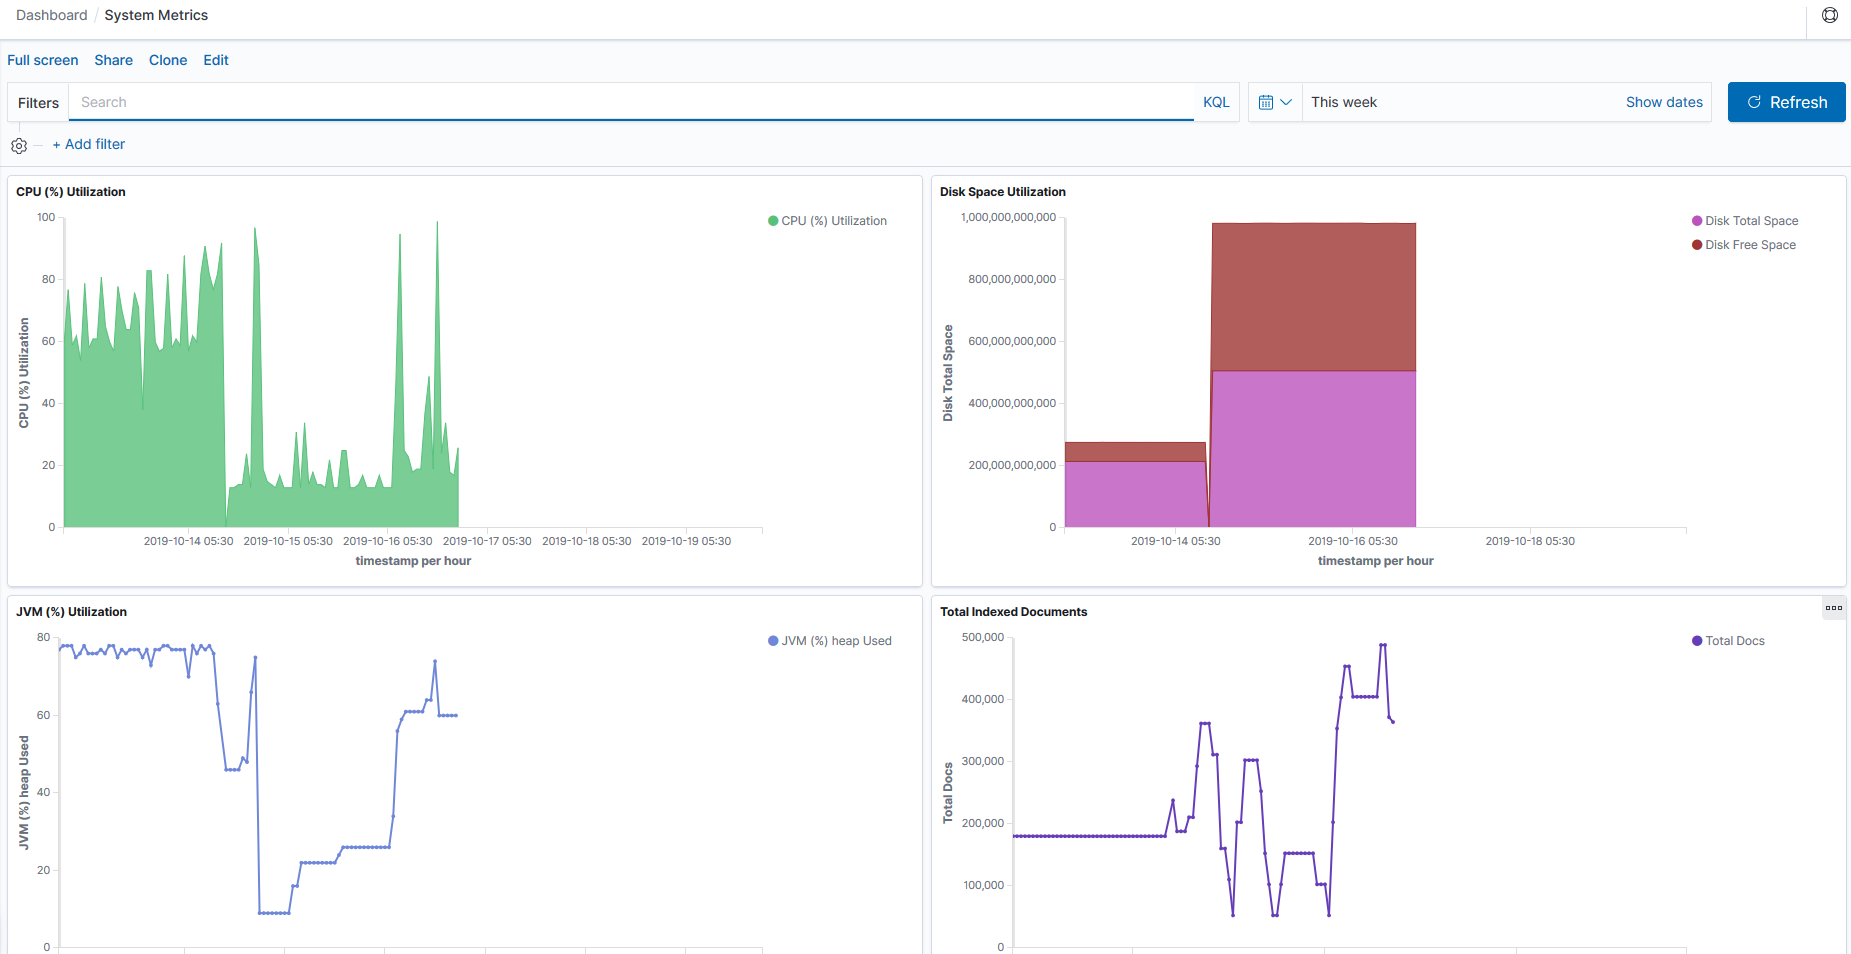
Access the System Metrics dashboard by selecting Dashboard, and then selecting System Metrics from the list of dashboards.
The System Metrics dashboard provides an overview of the system health, that is, you can view the real-time health of the system and also view the health of the system over a specific period of time in the past.
This example illustrates the visualizations on the System Metrics dashboard. You can find definitions for the visualizations later on this page.
Field or Control |
Description |
|---|---|
CPU (%) Utilization |
Displays the CPU utilization over a specific period of time by the OpenSearch server in the form of an area chart. |
Disk Space Utilization |
Displays the total disk space and the free space available for use in the form of an area chart. The total memory is displayed in bytes. |
JVM (%) Utilization |
Displays the total JVM percent used by the OpenSearch server in the form of a vertical bar chart. |
Total Indexed Documents |
Displays the total number of indexed documents over a specific period of time in the form of a line chart. |
Search Framework delivers three dashboards and each dashboard contains two or more visualizations. Oracle recommends that you do not modify the delivered dashboards and visualizations. Each of these visualizations are built on index patterns, which must not be modified. The delivered visualizations monitor the important aspects of search, that is, indexing and system health. However, if your business requirements demand to include any other attributes (fields), you may use the delivered index patterns and build new visualizations.
This topic describes how you can use the delivered index patterns and build visualizations of your choice.
Creating a visualization involves the following high-level steps:
Clone an existing dashboard.
Create a visualization.
Cloning a Dashboard
To clone an existing dashboard, complete the following steps:
Access the Insights home page using the Insights menu under Reporting Tools.
In the left pane, select Dashboard.
From the list of dashboards, select a dashboard.
From the top-right corner, select Clone.
Alternatively, select Edit, and then select Save.
Enter a name for the cloned dashboard, and then select Confirm Clone.
The selected dashboard is cloned and it displays the same visualizations as the original dashboard. Now, you need to create visualizations for the new dashboard.
Creating a Monitoring Visualization
To create a visualization, complete the following steps:
Select Visualize, and then select the plus (+) icon to add a visualization.
On the Select visualization type page, select a chart type.
Choose a chart type to display the visualization, such as, tabular form, pie chart, bar chart, and so on. To know more about the chart types, refer to OpenSearch Dashboards documentation [2.3.0], Building data visualizations.
Choose a delivered index pattern: psft_es_index_metrics or psft_es_system_metrics.
In the Data tab, specify the Y-axis and the X-axis.
The attributes that are indexed by PeopleSoft are displayed as aggregations in the drop-down list.
Select the Metrics & Axes tab, and select values as required.
Select the Panel Settings tab, and specify the display settings of the visualization.
After ensuring that you’ve selected or entered the appropriate values, select the Apply changes button, which is next to the Panel Settings tab.
The right pane displays the new visualization as a chart or in a tabular format depending upon the type that you selected.
From the top-right corner, select Save.
Enter a name for the new visualization, and then select Save.
Select Edit, and then select Add.
The Add Panels page displays a list of visualizations, which includes your newly created visualization.
Select the newly created visualization to add to your dashboard.
Use the Add Panels page to remove existing visualizations from your dashboard.
On the visualization panel that you want to remove, select the gear icon, and then select Delete from dashboard.
From the top-right corner, select Save.
In this manner, you can create more visualizations to add to your dashboard.
If you need to monitor attributes that are not covered by the delivered index patterns and visualizations, it is advisable that you create index patterns that suit your requirements and build visualizations on it. To know more about creating index patterns and creating visualizations, refer to the OpenSearch Dashboards documentation [2.3.0], which is available on www.opensearch.org.