Configuring the Monitoring Server
Use the Configure Server page to establish a connection between OpenSearch Dashboards and the OpenSearch server where you want to index the system metrics, indexing metrics, and application data.
Access the Configure Server page by selecting .
This example illustrates the fields and controls on the Configure Server page. You can find definitions for the fields and controls later on this page.
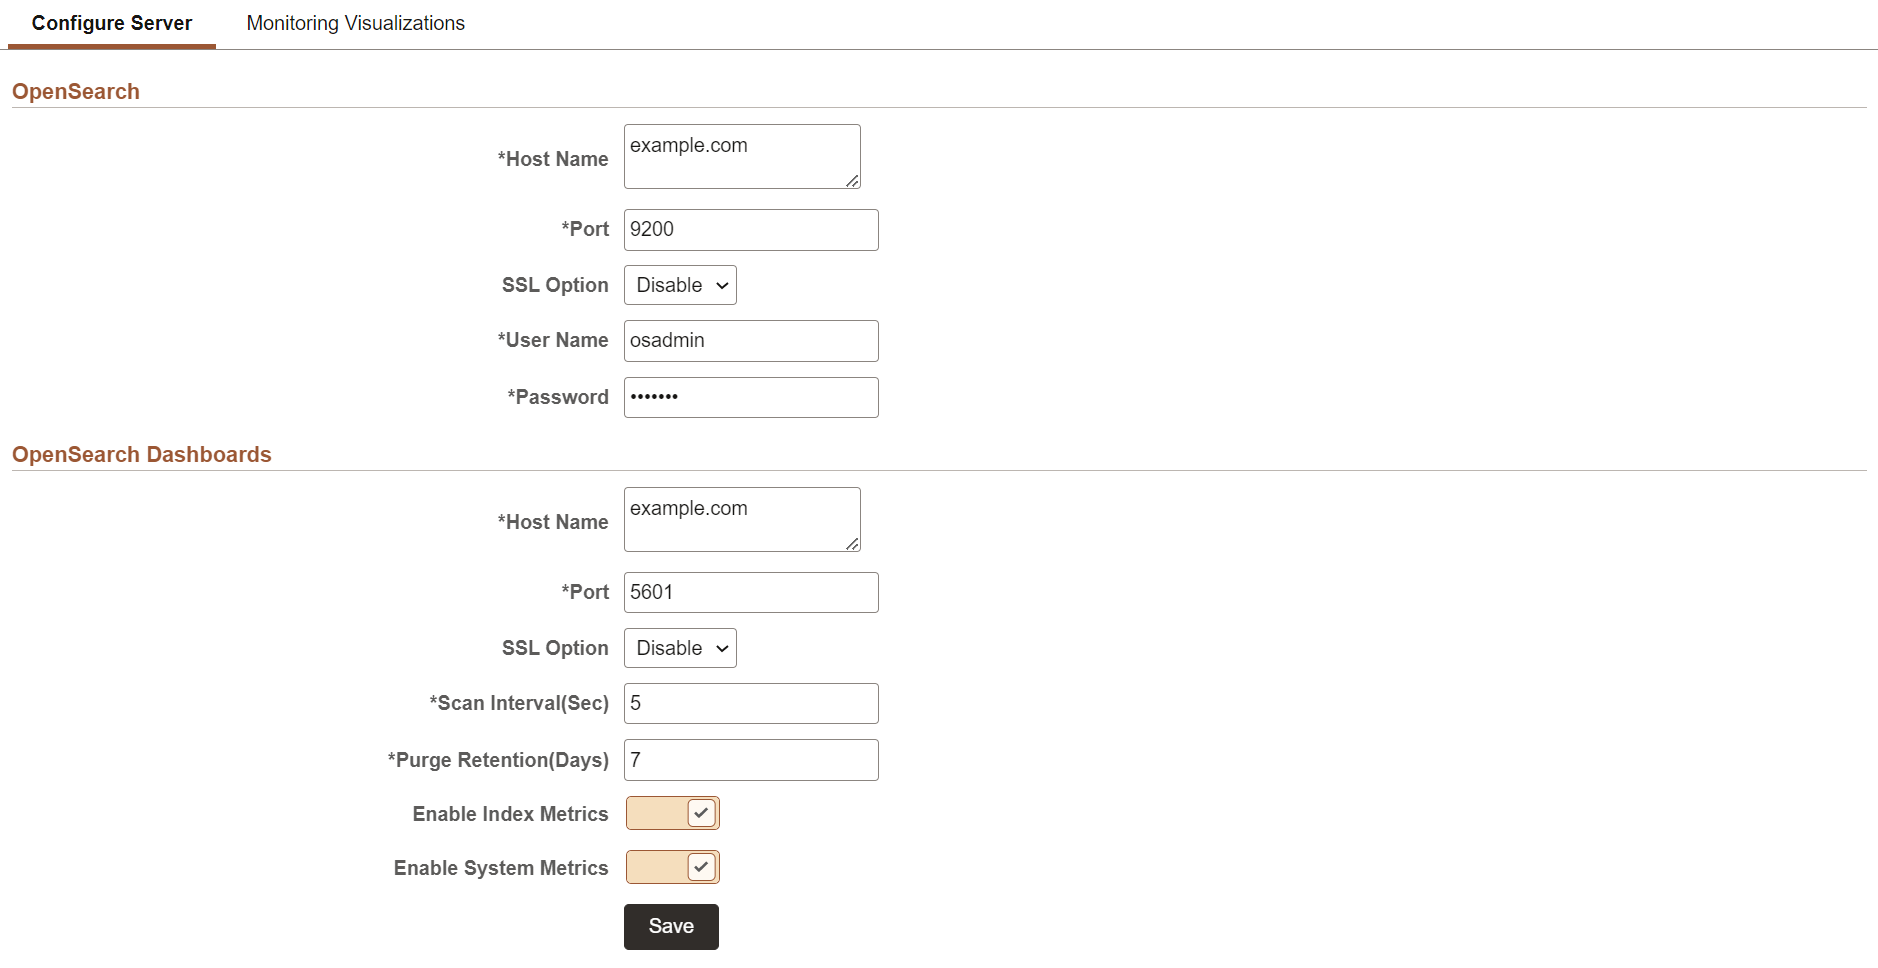
OpenSearch
|
Field or Control |
Description |
|---|---|
|
Host Name |
Enter the OpenSearch server where you want to index the system and indexing metrics. Note: This should be the OpenSearch server for monitoring purpose mapped to OpenSearch Dashboards during installation of OpenSearch Dashboards. You can use the same OpenSearch server where the application data is indexed or you can use a standalone server for the sole purpose of metric analysis. You can also specify the server in the opensearch_dashboards.yml file. |
|
Port |
Enter the OpenSearch server port that you specified during installation of OpenSearch. |
|
SSL Option |
Select an option based on whether SSL is enabled or disabled on the OpenSearch server. The default is Disable. |
|
User Name |
Enter the user ID for the OpenSearch admin user. The default is osadmin. |
|
Password |
Enter the password associated with the user name. |
OpenSearch Dashboards
|
Field or Control |
Description |
|---|---|
|
Host Name |
Enter the OpenSearch Dashboards server including the domain, which you want to set up as a monitoring server. The host name value can be a DNS name or an IP address |
|
Port |
Enter the OpenSearch Dashboards server port that you specified during installation of OpenSearch Dashboards. |
|
SSL Option |
Select an option based on whether SSL is enabled or disabled on the OpenSearch Dashboards server. The default is Disable. |
|
Scan Interval(Sec) |
Specify the time interval (in seconds) when system metrics will be retrieved from the OpenSearch server. For example, if you enter 10, system metrics will be retrieved every 10 seconds. The lowest time interval is 5 seconds, that is, you cannot specify a time interval lower than 5 seconds. Note: When you set the value for this property, you should consider the performance of the system. |
|
Purge Retention Period(Days) |
Specify the number of days to store the metrics data. For example, if you enter 7, the metrics data will be retained for 7 days. |
|
Enable Index Metrics |
Select Yes if you want indexing metrics to be collected for viewing and analyzing in the Indexing Metrics dashboard. The default is No. When you set it to Yes, the indexing metrics are sent to the configured server. PeopleSoft Search Framework delivers the following index for indexing metrics: ptsf_es_index_metric_yyyy_mm, where yyyy and mm indicates the year and month of the indexed data. The naming convention of the index ensures that the files do not grow too large over a period of time and also ensures that you can easily clean up the index files, if required. |
|
Enable System Metrics |
Select Yes if you want system metrics to be collected for viewing and analyzing in the System Metrics dashboard. The default is No. When you set it to Yes, the orcl-monitor-plugin starts indexing the system metrics data of the OpenSearch server, which is configured as the primary search server on the Search Instance page. PeopleSoft Search Framework delivers the following index for system metrics: ptsf_es_system_metric_yyyy_mm, where yyyy and mm indicates the year and month of the indexed data. The naming convention of the index ensures that the files do not grow too large over a period of time and also ensures that you can easily clean up the index files, if required. |
|
Save |
When you select Save:
Note: To save the configurations, the OpenSearch and OpenSearch Dashboards servers must be running instances. |