SparkChart Class Properties
In this section, the SparkChart class properties are presented in alphabetical order.
Description
Use this property to specify an Integer value (0 or greater) indicating how long (in milliseconds) the spark chart animation should last.
If this property is not specified, it defaults to 0.5 seconds.
This property is read/write.
Description
Use this property to specify the animation type for the spark chart.
You can specify either an Integer or constant value for this property. The values are:
|
Numeric Value |
Constant Value |
|---|---|
|
0 |
%Animation_None |
|
1 |
%Animation_Auto Note: The automatic animation is determined by the charting engine and varies by chart type. Note: %Animation_Auto is the default value. |
This property is read/write.
Description
Use this property to specify a Float value indicating the height of the chart as a proportion of its width.
If the aspect ratio is not defined, a default value of 1 is used on fluid pages.
Note: AspectRatio is ignored on classic pages; instead, the height is determined by the height of the chart page control defined in Application Designer or by the Height and Width properties.
This property is read/write.
Example
&oSpChart.AspectRatio = 0.8;Description
Use this property to specify the gap between spark chart bars as a Number value from 0 to 1 inclusive. This property is valid for bar charts and floating bar charts only. When the value is 0, there is no gap between spark chart bars; when the value is 0.5, the gap width is 50% of the total bar width. For example:
&oSpChart.barGapRatio
= 0;

&oSpChart.barGapRatio
= 0.5;

&oSpChart.barGapRatio
= 0.9;
The default value is 0.
This property is read/write
Description
Use this property to specify the primary color for spark line charts, area charts, or line with area charts.
The following lists all the values you can specify. You can use either the numeric or constant value.
|
Numeric Value |
Constant Value |
Description |
|---|---|---|
|
-1 |
%ChartColor_Series_Default Note: %ChartColor_Series_Default is the default value. |
Default color as selected by the charting engine. |
|
0 |
%ChartColor_Black |
Black |
|
1 |
%ChartColor_Blue |
Blue |
|
2 |
%ChartColor_Cyan |
Cyan |
|
3 |
%ChartColor_DarkGray |
Dark gray |
|
4 |
%ChartColor_Gray |
Gray |
|
5 |
%ChartColor_Green |
Green |
|
6 |
%ChartColor_LightGray |
Light gray |
|
7 |
%ChartColor_Magenta |
Magenta |
|
8 |
%ChartColor_Orange |
Orange |
|
9 |
%ChartColor_Pink |
Pink |
|
10 |
%ChartColor_Red |
Red |
|
11 |
%ChartColor_White |
White |
|
12 |
%ChartColor_Yellow |
Yellow |
|
13 |
%ChartColor_Red_Orange |
Red-orange |
|
14 |
%ChartColor_Yellow_Green |
Yellow-green |
|
15 |
%ChartColor_Blue_Violet |
Blue-violet |
|
16 |
%ChartColor_Purple |
Purple |
|
17 |
%ChartColor_Yellow_Orange |
Yellow-orange |
This property is read/write.
Description
Use this property to specify a Boolean value indicating whether the spark chart is interactive—that is, whether the user can click on (or touch) the spark chart to trigger an action. The default value is False.
The source of interactivity on a spark chart can come from one of two places:
A URL set in the chart’s SparkChartURL property.
FieldChange PeopleCode on the record field that holds the chart area (that is, the Application Designer chart control).
If both a URL is set in the SparkChartURL property and FieldChange PeopleCode exists on the record field of the chart control, the URL will take precedence over the PeopleCode.
This property is read/write.
Description
Use this property to specify the style for spark line charts and line with area charts.
You can specify either an Integer or constant value for this property. The values are:
|
Numeric Value |
Constant Value |
Description |
Example |
|---|---|---|---|
|
0 |
%SparkLineStyle_Solid Note: %SparkLineStyle_Solid is the default value. |
Solid line |
|
|
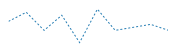
1 |
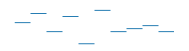
%SparkLineStyle_Dashed |
Dashed line |

|
|
2 |
%SparkLineStyle_Dotted |
Dotted line |
|
This property is read/write.
Description
Use this property to specify the style for spark line charts, line with area charts, and area charts.
You can specify either an Integer or constant value for this property. The values are:
|
Numeric Value |
Constant Value |
Description |
Example |
|---|---|---|---|
|
0 |
%SparkLine_None |
No line |

|
|
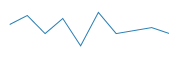
1 |
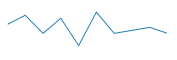
%SparkLine_Straight Note: %SparkLine_Straight is the default value. |
Straight line |
|
|
2 |
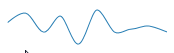
%SparkLine_Curved |
Curved line |
|
|
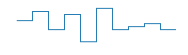
3 |
%SparkLine_Stepped |
Stepped line |
|
|
4 |
%SparkLine_Segmented |
Segmented line |
|
This property is read/write.
Description
Use this property to specify the line width for spark line charts and line with area charts as a Number value. For example:
&oSpChart.lineWidth=
1;
&oSpChart.lineWidth=5;

The default value is 1.
This property is read/write.
Description
Use this property to specify a valid URL as a String value. If IsDrillable is true, then the user is redirected to this URL after clicking on (or touching) the spark chart.
This property is read/write.
Description
Use this property to specify the title for the spark chart as a String value. The title is displayed as a tooltip for the spark chart and is generated as part of the chart information for accessibility purposes.
If no value is specified, then the spark chart title is automatically generated.
This property is read/write.
Description
Use this property to specify the style for spark line charts.
You can specify either an Integer or constant value for this property. The values are:
|
Numeric Value |
Constant Value |
Description |
Example |
|---|---|---|---|
|
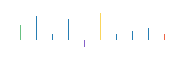
0 |
%SparkChart_Bar |
Bar spark chart |

|
|
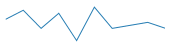
1 |
%SparkChart_Line Note: %SparkChart_Line is the default value. |
Line spark chart |
|
|
2 |
%SparkChart_Area |
Area spark chart |

|
|
3 |
%SparkChart_LineWithArea |
Line with area spark chart |

|
|
4 |
%SparkChart_FloatingBar |
Floating bar spark chart Note: See the FloatValue property for more information on floating bar charts. |

|
This property is read/write.
Description
On a classic page, use this property to specify a Number value indicating the width of the gauge in pixels.
Note: On a fluid page, the combination of the AspectRatio, Height, and Width properties are used to determine the size of the gauge.