Administering Analytic Servers
This topic discusses how to administer analytic server domains and instances.
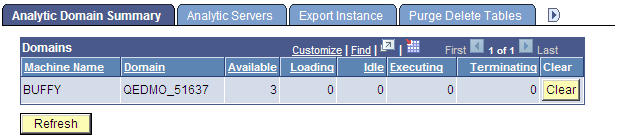
Use the Analytic Server Administration - Analytic Domain Summary page (PTATADMIN_SUMMARY) to view the current status of the application server domains, which are attached to the current database, running with PSANALYTICSRV. Each active domain is listed along with its machine name, domain name, and the total number of availability, loading, idle, executing, terminating, and clear
Navigation:
This example illustrates the fields and controls on the Analytic Server Administration - Analytic Domain Summary page. Definitions for the fields and controls appear following the example.
Field or Control |
Description |
|---|---|
Machine Name |
Displays the network name of the computer on which the listed domain is running. |
Domain |
Displays the name of each active domain. Note: If a domain has been unexpectedly terminated, it might still be listed here. You can click the Clear button to remove the outdated information from the display. |
Available |
Displays the total number of analytic server instances running in the domain. |
Loading |
Displays the number of available analytic server instances in the domain that are currently being loaded. |
Idle |
Displays the number of available analytic server instances in the domain that are allocated to analytic instances, but aren't actively processing them. |
Executing |
Displays the number of available analytic server instances in the domain that are allocated to analytic instances, and are actively processing them. |
Terminating |
Displays the number of analytic server instances in the domain that are marked as terminated, but haven't yet been shut down. |
Clear |
Click to remove the row from the display when the domain has been unexpectedly terminated. Warning! Use the Clear button with caution, and only if you're certain that the domain has been unexpectedly terminated. Clearing the domain information for servers that are still running produces errors in those servers. |
Refresh |
Click to retrieve information about any newly started domains that have PSANALYTICSRV running. |
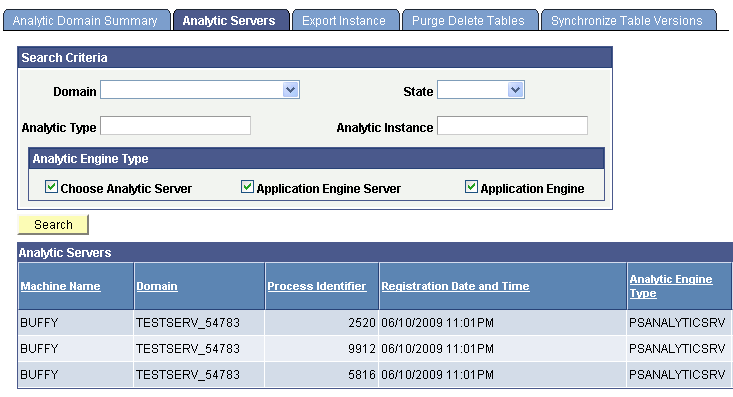
Use the Analytic Server Administration - Analytic Servers page (PTATADMIN_SERVERS) to administer analytic server instances.
Navigation:
This example illustrates the fields and controls on the Analytic Server Administration - Analytic Servers page (1 of 3). Definitions for the fields and controls appear following the examples.
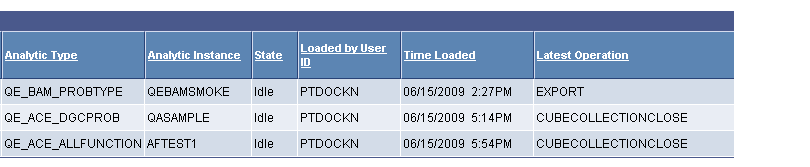
This example illustrates the fields and controls on the Analytic Server Administration - Analytic Servers page (2 of 3). Definitions for the fields and controls appear following the examples.
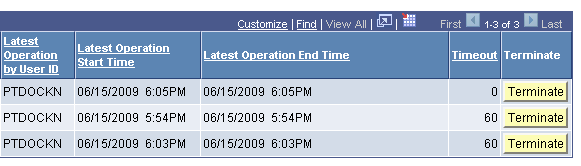
This example illustrates the fields and controls on the Analytic Server Administration - Analytic Servers page (3 of 3). Definitions for the fields and controls appear following the example.
Search Criteria
Field or Control |
Description |
|---|---|
Search |
Click to retrieve status information about all analytic server instances that are running in application server domains that are attached to the current database. You can use the Search Criteria section to limit the information returned based on various criteria. |
Domain |
Select the name of an active application server domain for which you want to retrieve information. |
State |
Select a server state to limit the search to analytic server instances with the selected state. You can select from the following states:
|
Analytic Type |
Select an analytic type from the set of analytic types defined in the current database. This limits the search to analytic server instances that have analytic instances of the selected analytic type loaded. |
Analytic Instance |
Select an analytic instance from the set of analytic instances defined in the current database. This limits the search to analytic server instances that have the selected analytic instance loaded. |
Analytic Engine Type |
Specify the process types for which you want to get status information. Select one or more of the following:
All three types are selected by default. |
Analytic Servers
This section displays a row of status information retrieved for each analytic server instance that's returned by the search. In addition to the fields documented in the previous section, each row displays the following information.
Field or Control |
Description |
|---|---|
Machine Name |
Displays the network name of the computer on which the listed analytic server instance is running. |
Process Identifier |
Displays the operating system process ID for the listed analytic server instance. |
Registration Date and Time |
|
Loaded by User ID |
Displays the user ID of the user whose activity resulted in the allocation of this analytic server instance. |
Time Loaded |
Displays the date and time that this analytic server instance loaded its analytic instance. |
Latest Operation |
Identifies the last operation that was applied to this analytic instance. |
Latest Operation By User ID |
Displays the user ID of the last user to access this analytic instance. |
Latest Operation Start Time |
Displays the date and time that the last operation on this analytic instance started. |
Latest Operation End Time |
Displays the date and time that the last operation on this analytic instance completed. |
Timeout |
Displays the timeout interval in minutes that's specified for this analytic instance. Timeout values are defined for analytic instances by the TimeOut parameter of the PeopleCode AnalyticInstance class Load method. A value of 0 indicates an unlimited lifespan for this analytic instance. |
Terminate |
Click to indicate that the server instance should be shut down. |