Chart
These are the actions associated with the Chart step type. The following actions are deprecated but PeopleSoft still provides support for them:
ChartGetType
GetText
SectionCount
Description
Performs a mouse click on a clickable area of the chart. PTF recognizes the following HTML ID properties:
|
HTML ID Property |
Usage |
|---|---|
|
tag |
Returns an HTML SVG tag for the target clickable area. The tags are:
|
|
fill |
Returns RGB values of an HTML object. It is recorded if the tag attribute has no unique identifier. |
|
index |
Returns the specific HTML object based on the HTML source. It returns a number value. It is recorded when multiple elements are present with same attributes. |
Example
|
Type |
Action |
Recognition |
Parameters |
Value |
|---|---|---|---|---|
|
Chart |
ChartClick |
tag=polygon|fill=rgb(83,110,209)|index=2 |
Description
Gets the property value of an HTML object and
assign to the prop=value parameter. Also
stores it to the variable in ret=&variable.
Different business charts like Charts, Status Meter Gauges, LEG Gauge, Rating Gauge, and Spark Charts support different properties, for example Charts support the following properties:
FootNote
GroupCount
MainTitle
SeriesCount
SubTitle
Type
XAxisTitle
YAxisTitle
Note: Get_Property on a Charts business chart does not support object oriented properties of a chart such as series and so on.
See Get_Property.
Example
The example is for Get_Property action for JET Chart type.
|
Type |
Action |
Recognition |
Parameters |
Value |
|---|---|---|---|---|
|
Chart |
Get_Property |
chart=2DBar |
idx=0;prop=XAxisTitle;ret=&xtitle |
Description
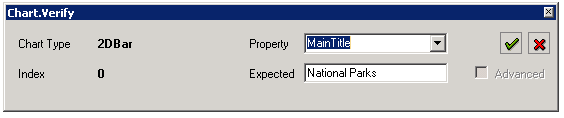
Compares the value in the browser to the expected value, and adds a pass or fail log entry for the validation.
When you drag the Verify icon and drop it on a chart on the browser page, the chart is highlighted and the Chart.Verify dialog box opens.
Chart.Verify dialog box appears where you enter the required properties of the chart.
Parameter |
Description |
|---|---|
Chart Type |
Populated from the HTML tag. |
Index |
Populated from the HTML tag. It is the index value of a chart object when there are more than one chart on the same page. |
Property |
Select from the available properties for a particular Chart Type. |
Expected |
Displays the value to be verified which depends on the Property field. It is populated when a property is selected. The field in some instances may remain blank if there is no value to be verified. |
Example
The table illustrates the Verify action for Chart step type.
|
Type |
Action |
Recognition |
Parameters |
Value |
|---|---|---|---|---|
|
Chart |
Verify |
chart=2DBar |
idx=0;prop=MainTitle |
National Parks |
|
Chart |
Verify |
chart=2DBar |
idx=0;prop=ReferenceArea(1).Description |
Reference Area2 |
|
Chart |
Verify |
chart=2DBar |
idx=0;prop=DateSeries(1) |
GLACIER |
Description
Returns the chart type from a displayed chart.
Parameters
Parameter |
Description |
|---|---|
chart=value; |
The index for the chart image on the page. |
ret=&variable; |
The return value. |
Description
Returns the text value for the specified chart section.
Parameters
Parameter |
Description |
|---|---|
chart=value; |
The index for the chart image on the page. |
idx=value; url=value; alt=value; |
The section recognition string. It can be the section index, the section URL, or the alternative text. |
ret=&variable; |
The return value. |
Example
This is an example of the GetText action for a Chart step type:
|
Type |
Action |
Recognition |
Parameters |
Value |
|---|---|---|---|---|
|
Chart |
GetText |
chart=0 |
idx=3;ret=&chart_val |
|
|
Log |
Message |
The value for index 3 is &chart_val |
|
|
|
Chart |
GetText |
chart=0 |
idx=2;ret=&chart |
|
|
Log |
Message |
The value for index 2 is &chart_val |
|
|
Description
Counts the number of regions in a chart.
Parameters
Parameter |
Description |
|---|---|
chart=value |
The index for the chart image on the page. |
ret=&variable |
The variable to store the return value. The Chart.SectionCount returns the real value (not zero-based). If you are using this variable in combination with zero-based indexes, such as a For loop, you may need to subtract 1. |
Example
This example illustrates using the SectionCount action with a loop to retrieve the text for each section.
|
Type |
Action |
Recognition |
Parameters |
Value |
|---|---|---|---|---|
|
Browser |
Start_Login |
|
|
|
|
Browser |
FrameSet |
TargetContent |
|
|
|
Page |
Prompt |
QE_CHART_MENU.QE_CHART2.GBL |
urltype=default |
update |
|
Text |
Set_Value |
Name=QE_CHART_RECORD_QE_CHART_CATEGORY |
|
CAR SALES |
|
Page |
PromptOk |
|
|
|
|
Chart |
SectionCount |
chart=0 |
ret=&chart_count |
|
|
Log |
Message |
ChartCount => &chart_count |
|
|
|
Loop |
For |
&var=0 to Subtract(&chart_count|1) |
|
|
|
Chart |
GetText |
chart=0 |
idx=&var;ret=&chart_value |
|
|
Log |
Message |
ChartValue => &chart_value |
|
|
|
Loop |
Next |
|
|
|