Reviewing Diagnostic Information
The generated report appears similar to the following:
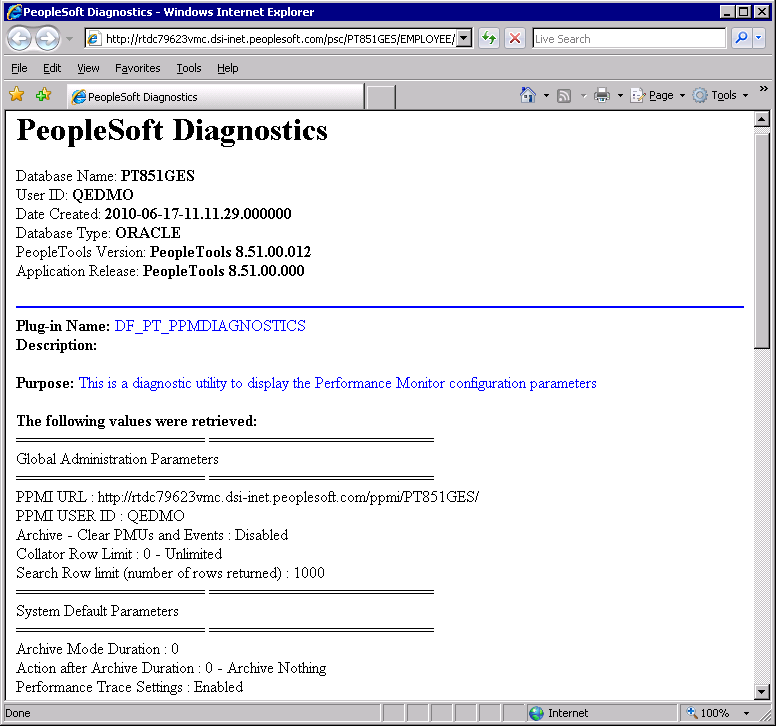
This example illustrates the fields and controls on the Sample Performance Monitor diagnostic plug-in output.
The Performance Monitor diagnostic report displays the following settings, grouped by where they appear in the PeopleTools interface.
|
Diagnostic Report Section |
Configuration Parameters Displayed |
|---|---|
|
Global Administration Parameters |
PPMI URL PPMI USER ID Archive - Clear PMUs and Events Collator Row Limit Search Row limit (number of rows returned) |
|
System Default Parameters |
Archive Mode Duration Action after Archive Duration Performance Trace Settings PMU Timeout (in days) Agent Event Sample Rate (sec) Agent Buffering Interval (sec) Agent Filter level Agent PMU sample rate (1/X) Agent Heartbeat Interval (sec) Agent Maximum Buffer size (bytes) |
|
System Definitions |
Database Name Tools release Archive Mode Duration (days) Archive Mode Operation Performance Trace Settings PMU Timeout (in days) Agent Event Sample Rate (sec) Agent Buffering Interval (sec) Agent PMU sample rate (1/X) Agent Heartbeat Interval (sec) Agent Maximum Buffer size (bytes) Agent Filter Levels (Server/Filter Level) |
|
Specify Monitor |
Monitor URL |
|
IB Information (Integration Broker) |
IB Gateway URL Number of IB Gateway Connectors |
|
Web Profile Information |
Configured Webprofile Webprofile Buffer Limit Webprofile PPM Agent Enabled status |
|
Security |
Permission List for the current user |