Viewing Broadcast, Chat, and Event Logs
To view broadcast, chat, and event logs, use the Broadcast Log (MCF_BCAST_LOG_CMP), Chat Log (MCF_CHAT_LOG_CMP), and Event Log (MCF_EVENTLOGL_CMP) components.
The broadcast log page displays detailed information about any broadcast messages that were sent.
Access the Broadcast Message Log page using the following navigation path:
You can also access the Broadcast Message Log page by searching by message number, queue ID, or REN cluster ID.
This example illustrates the details of a broadcast message on the Broadcast Message Log page.
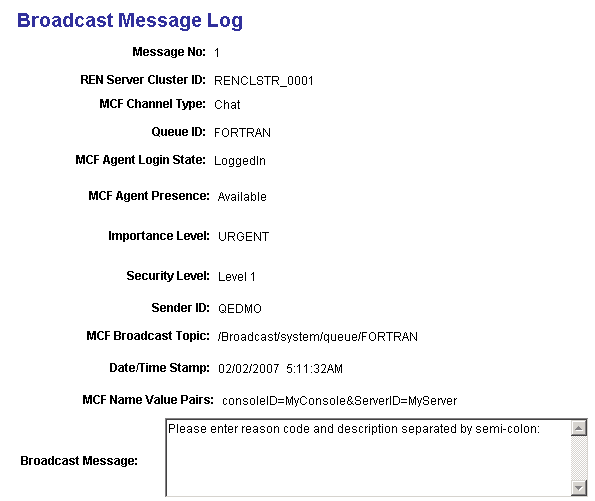
Note: To view the broadcast logs, set log_broadcast to Yes on the Cluster Tuning page. For this parameter to take effect, click Refresh logging parameters on the Cluster Notify page.
Access the Chat page using the following navigation path:
This example illustrates a chat log on the Chat page.
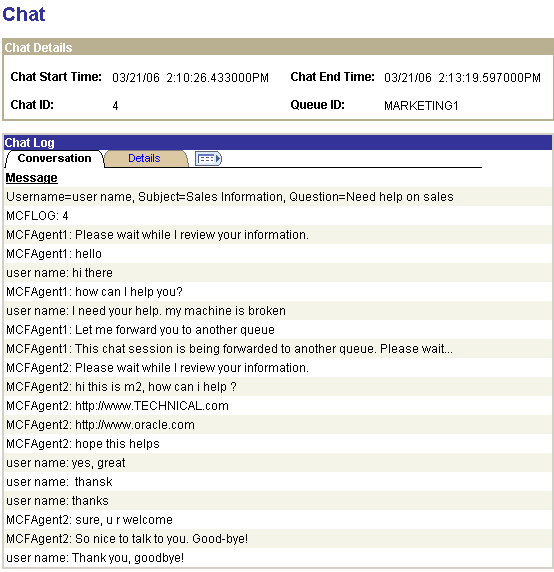
If enabled, this log records the contents and events of every chat session.
To enable chat logging, set log_chat_ses to yes on the Cluster Tuning page. For this parameter to take effect, click Refresh logging parameters on the Cluster Notify page.
Details Tab
Access the Details tab of the Chat Page using the following navigation path:
This example illustrates details of a chat log on the Chat page.
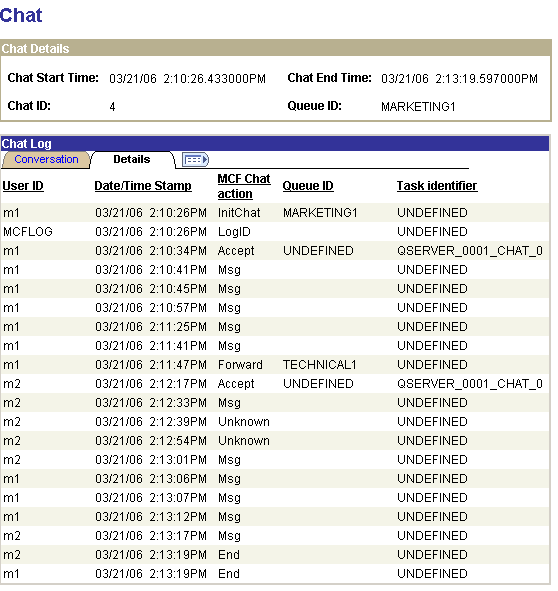
The Details tab displays detailed information about the selected chat conversation.
Access the Event Log page using the following navigation path:
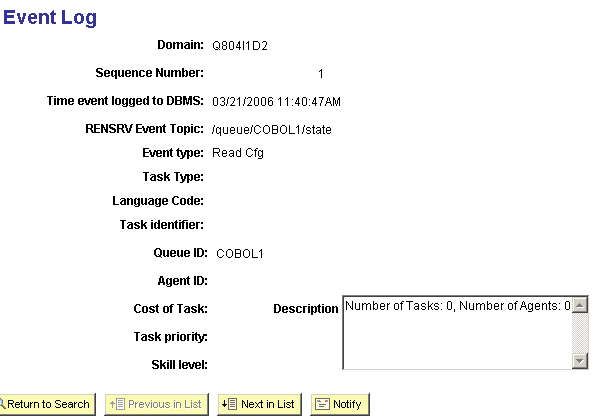
This example illustrates the fields and controls on the Event Log page. You can find definitions for the fields and controls later on this page.
Field or Control |
Description |
|---|---|
Domain |
The application server domain on which this event occurred. |
Time event logged to DBMS |
The time that this event was recorded in the database. |
Event Type |
The type of event, as described in the table that follows. |
Task Type |
The type of task for this event: chat, email, or generic. CTI events are logged in the CTI event log. |
The event log records PeopleSoft MultiChannel Framework events sent to the real-time event notification (REN) server, excluding chat content (which is logged in the chat log). The event log can be used for debugging as well as for system monitoring. For example, you can determine when agents log in and log out, or when the queue server was first notified of newly enqueued events.
Data displayed in the event log depends on the event type. Not all fields apply to every event.
To enable logging of state broadcast events, set logDMPQ to yes on the Cluster Tuning page. For this parameter to take effect, click Refresh logging parameters on the Cluster Notify page.
Time is displayed and searched on in the format MM/DD/YYYY HH:MM:SSA/PM.
The following table lists possible event types:
|
Name |
Translate Table Value |
REN MultiChannel Framework Topic |
Description |
|---|---|---|---|
|
Accepted |
ACPD |
/agent/<agentID>/accepted Agent 's list of accepted tasks |
Agent's list of accepted tasks |
|
Accept |
ACPT |
/queue/agents/accept |
Agent accepts an assigned task. |
|
Bcst Admin |
BCST |
/queue/admin/statedump |
Broadcast universal queue information |
|
Contact |
CNCT |
/queue/contact |
Real-time contact (for example, chat) |
|
DB Cntct |
DBCT |
/queue/dbcontact |
Database management system contact (such as email or generic) |
|
Dump Q |
DMPQ |
/queue/<queueID>/state |
Dump queue state information to log |
|
Done |
DONE |
/queue/agents/dequeue |
Done (dequeue) |
|
Forward |
FWD |
/queue/agents/forward |
Forward |
|
Notify |
NTFY |
/agent/<agentID>/notify |
Notify agent of assigned task. |
|
Presence |
PRES |
/queue/agents/presence |
Agent's presence change |
|
Restrt Ack |
RACK |
/queue/agents/restartack |
Restart acknowledgement |
|
Read Cfg |
READ |
/uqsrv/reread/defaults |
Reread defaults |
|
Restart |
RSRT |
/queue/<queueID>/restart |
Restart |
|
Unknown |
UNKN |
UNKNOWN |
Unknown REN server event |
|
Unassign |
USGN |
/agent/<agentID>/unassign |
Unassign |
The following table lists event logs:
|
Name |
Translate Table Value |
REN MultiChannel Framework Topic |
Required Argument Value |
Meaning |
|---|---|---|---|---|
|
Abandon |
ABAN |
/chat/<userID>/<chatID> |
ps_type=abandon |
Abandoned chat session |
|
End |
END |
/chat/<userID>/<chatID> |
ps_type=end |
End chat session |
|
Login |
LGIN |
/queue/agents/loginstate |
ps_state=login |
Log on |
|
Logout |
LGOT |
/queue/agents/loginstate |
ps_state=logout |
Log out |
|
Message |
MSG |
/chat/<userID>/<chatID> |
ps_type=msg |
Message |
|
Push URL |
PUSH |
/chat/<userID>/<chatID> |
ps_type=pushurl |
Push URL |
|
Timeout |
TOUT |
/chat/<userID>/<chatID> |
ps_type=timeout |
Timeout chat session |
Diagnostic PSUQSRV and PSMCFLOG traces are written to the log directory of each application server domain. The trace level is determined by the LogFence setting in the domain configuration. You can set the LogFence parameter with PSADMIN configuration of the application server domain. The following table lists LogFence setting values:
|
LogFence Setting |
Tracing Level |
|---|---|
|
1 |
Fatal errors |
|
2 |
Errors |
|
3 |
Warnings |
|
4 |
Level 1 Diagnostic: Logs the queues that the universal queue is servicing, logs new queues that are added, and logs agent logon and logout. |
|
5 |
Level 2 Diagnostic: Logs most debugging information, except periodic events (such as timer check and heartbeat). |
|
6 |
Level 3 Diagnostic: Logs everything, including periodic events. |