Understanding Log Analyzer
Log Analyzer for Application Engine is an User Interface tool that helps you format the Application Engine log file to easily get log information about:
Application Engine call structure
SQL information
PeopleCode information
You can launch the Log Analyzer tool by executing runTraceAnalyzer.bat file located at PS_HOME\bin\client\winx86\AELogAnalyzerTool.
This image illustrates the Application Engine call structure in Log Analyzer:
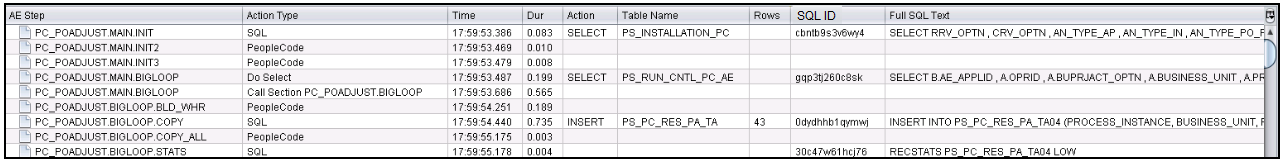
By using the Log Analyzer for Application Engine, you can display the application engine call structure as a tree structure in a table panel. The table panel displays the following log information:
Term |
Definition |
|---|---|
AE Step |
The Application Engine Step column displays the Application Engine steps executed in the AE process. |
Action Type |
The Action Type column displays the Application Engine action type performed in the Application Engine step. Application Engine action types can be any one of the following:
|
Time |
The Time column displays the time at which the Application Engine action was executed. |
Duration |
Displays the duration of the action. |
Action |
The action column displays the SQL action that was performed in the Application Engine step. SQL actions can be any one of the following:
|
Table Name |
The Table Name column displays the name of the table in which the action was performed. |
Rows |
The Rows column displays the number of rows that were updated by the action. |
SQL ID |
The SQL ID column displays the performance details of the Application Engine step. The SQL ID column displays a unique identifier of the SQL statement when run on Oracle databases. This is useful for Application Engine SQL performance analysis. Note: SQL ID is specific to Oracle database so this column is only displayed when we are analyzing an AET file generated against an Oracle database. |
Full SQL Text |
The Full SQL Text column displays the full SQL text that was run for the SQL action. |
By using the Log Analyzer feature, you can access the SQL information for any Application Engine step that was executed. See SQL Traces for more information.
You can load the .TRC file of the AE program to access the corresponding PeopleCode information associated to the selected node.
Note: ‘Trace start of programs’ must be enabled to access PeopleCode Information using Log Analyzer for AE.
You can use the Log Analyzer feature to access filtered information about the AE process.
This example illustrates the fields and controls on the Filter Option in Log Analyzer:
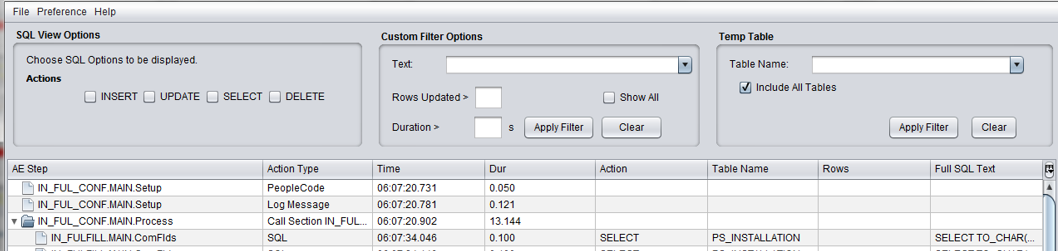
The AE process information can be filtered by:
SQL statement action
Text
Duration
Rows updated
Temporary Table Data
|
Filter by |
Action |
|---|---|
|
SQL Statement action |
Displays filtered information about the AE process based on the following SQL statement actions:
|
|
Text |
Displays filtered information about the AE process based on text. |
|
Duration |
Displays filtered information about the AE process based on duration of the steps. |
|
Rows updated |
Displays filtered information about the AE process based on the number of rows that were updated in the AE process. |
|
Temporary table data |
Displays filtered information about the AE process with temporary table data. |