Using Auto Enrollment Analytics for Managing Previews and Errors
The Time and Labor Auto Enrollment Analytics enable administrators or managers to quickly analyze the time enrollments and select the transactions that they wish to load to the base tables.
The enrollment process updates the time reporter data for all hires (single or concurrent employment instances), rehires, terminations, job data changes and other configured human resource actions. While Job data changes, it triggers auto enrollments using the auto enrollment framework. You can also use the Setting Up Auto Enrollment to load Auto Enrollment data for the new hires and existing employees.
Using Time and Labor preview mode of auto enrollment feature, you can preview the enrollment information in the Fluid Interface.
When the preview mode is selected, Auto Enrollment will not post the Time and Labor Enrollments determined by the enrollment rule processing. A staging table gets populated with the enrollment information for review and you can select the transactions that you wish to load to the base tables.
Auto Enrollment Previews and Error Tabs
The following pagelets are delivered for the Absence Analytics Dashboard.
|
Pagelet |
Usage |
|---|---|
|
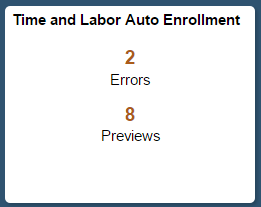
Tap the Time and Labor Auto Enrollment tile to navigate the Auto Enrollment page. This tile displays the count of number of errors and enrollments that are ready for preview. |
|
|
Analyze the time and labor enrollment entries which are ready for preview. |
|
|
Analyze the time and labor schedule assignments which are ready for preview.. |
|
|
Analyze and review the error data and take corrective actions by making use of several detailed actions which are available on the Pivot grid |
|
|
Analyze and review the errors which are encountered during schedule assignments. |
Field or Control |
Description |
|---|---|
|
Refresh the Pivot grid reports and details to view the relevant and latest data. |
|
Use this Options Menu to perform the actions like View Pivot Grid, Update Filters, Export Data, Chart Options, and Save. |
|
Show filters on the left panel to display the Enrollment Group, Location, Business Unit, Department and Company. |
|
Select to hide the filters. |
|
Perform the action of Posting, Mark for Processing or Rejecting enrollments at an employee level (one transaction at a time). The user can view the Enrollment Group and Notify the recipients using different delivery methods. |
|
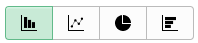
Click to display data in the chart type represented by the icon. Available chart types include vertical bar, line, pie and horizontal bar. |
|
Activate and perform the actions related to multiple transactions. |


For more information on pivot grid functionality, see the product documentation for PeopleTools: Pivot Grid.
Use Time and Labor Auto Enrollment tile to navigate the Auto Enrollment page. This tile displays the count of number of errors and enrollments that are ready for preview.
This example illustrates Time and Labor Auto Enrollment tile.
Tap the Time and Labor Auto Enrollment page to navigate to Auto Enrollment page and navigate to the enrollment data preview and errors tabs and to view the pivot grid reports.
The preview and error reports are:
Preview Time and Labor
Preview Schedule Assignment
Errors Time and Labor
Errors Schedule Assignment
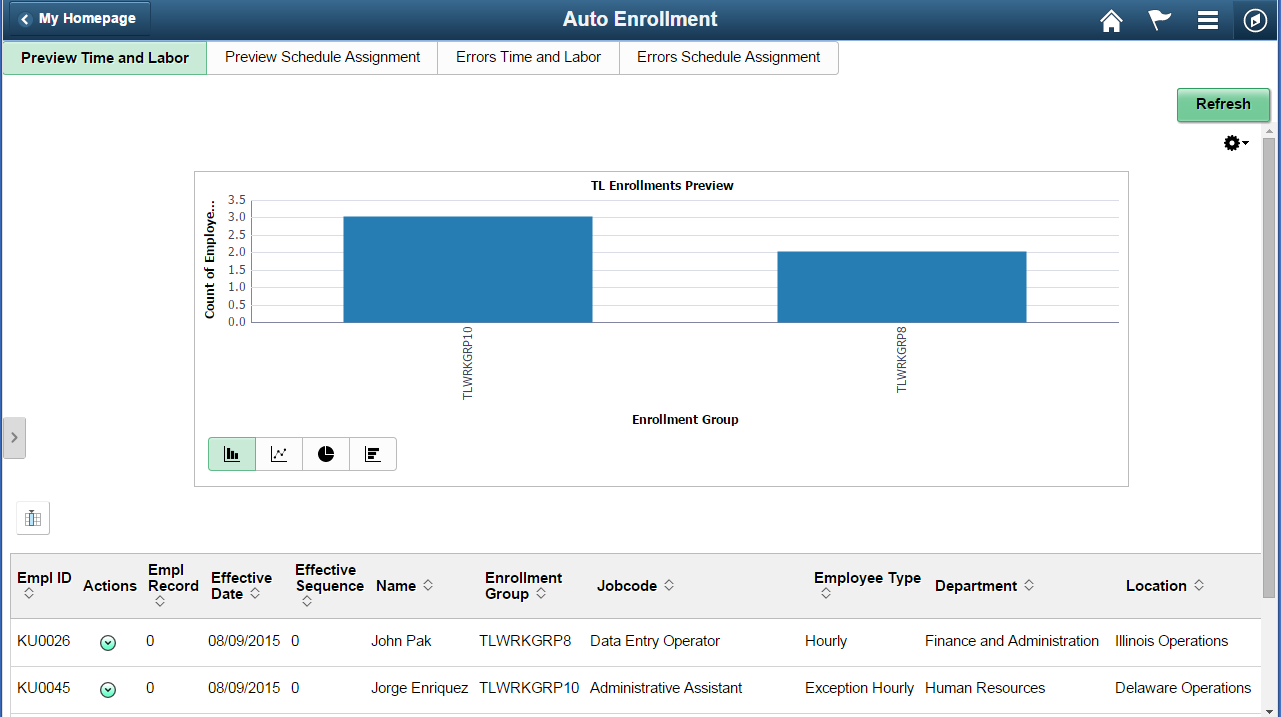
The Pivot grid report lists all the employees for whom enrollments are ready for preview in a bar chart. Enrollment Groups are listed on the X-Axis and the count of number of employees matching different Enrollment Group criteria are represented on the Y-Axis. The Pivot grid report shows all employee details in a grid located below the chart.
The Preview Time and Labor Report is the default Auto Enrollment landing page.
Navigation:
Tap the Preview Time and Labor tab on the Auto Enrollment Page.
This example illustrates the fields and controls on the Preview Time and Labor page.
Field or Control |
Description |
|---|---|
|
Perform the action of Posting, Mark for Processing or Rejecting enrollments at an employee level (one transaction at a time). The user can view the Enrollment Group and Notify the recipients using different delivery methods. |
Select anywhere on the chart to drill down the data. By default, you can use the drill down options like Position, Union Code, Employee Type and Job code.
The Details grid shows the field values - Employee ID, Employee Record, Effective date, Effective Sequence, Name, Employee Type, Department, Location, Jobcode, Union Code, Position, Business Unit, Company, Supervisor ID, Run Control ID, Process Status and Enrollment Group for which the employee has become eligible.
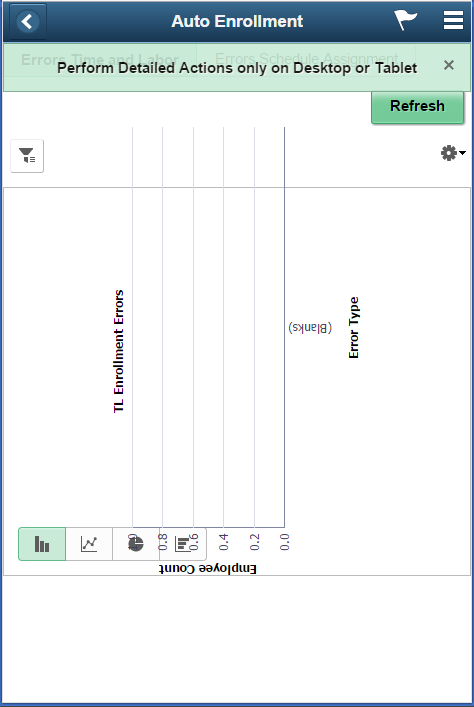
Note: You can perform Detailed Actions only by using Desktop or Tablet. The detailed actions cannot be performed using mobile (Small Form Factor) devices.
This example illustrates the Auto Enrollment Landing page when logged in using mobile devices.
At any point of time, you have access to configure various pivot grid report options and can add any additional Job data fields to the details grid, drill down options or the filter criteria by modifying the underlying PS Query.
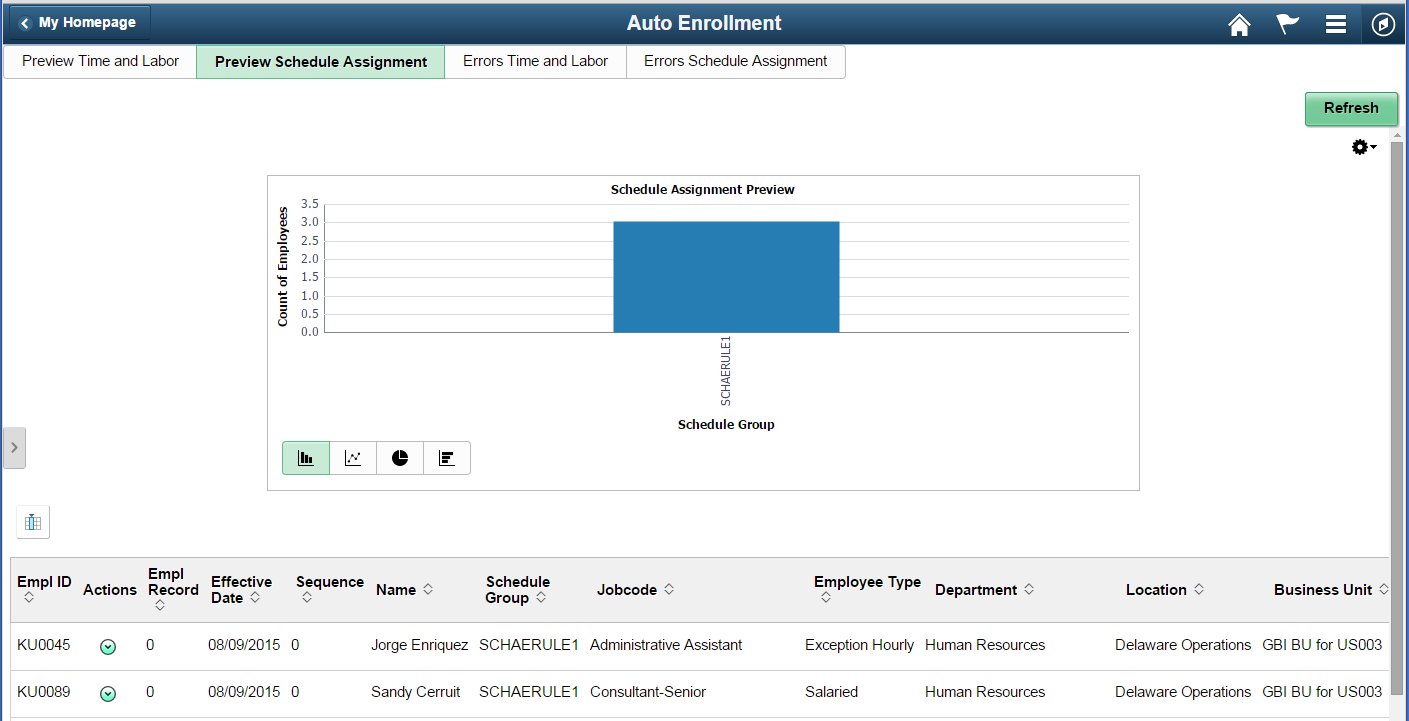
The Pivot grid report displays the schedule assignment in a bar chart. Enrollment Groups are listed on the x-axis and the count of number of employees matching different Enrollment Group criteria are represented on the y-axis. The Pivot grid report shows all employee details in a grid located below the chart.
Navigation:
Tap the Preview Schedule Assignment tab on the Auto Enrollment page.
This example illustrates the fields and controls on the Preview Schedule Assignment page.
Field or Control |
Description |
|---|---|
|
Perform the action of Posting, Mark for Processing or Rejecting enrollments at an employee level (one transaction at a time). The user can view the Schedule Group and Notify the recipients using different delivery methods. |
Select anywhere on the chart to drill down the data. By default, you can deliver the drill down options Position, Union Code, Employee Type and Job code.
The Details grid shows the field values - Employee ID, Employee Record, Effective date, Sequence, Name, Employee Type, Department, Location, Jobcode, Union Code, Position, Business Unit, Company, Supervisor ID, Run Control ID, Process Status and Enrollment Group for which the employee has become eligible.
At any point of time, you have access to configure various Pivot grid report options and can add any additional Job data fields to the details grid, drill down options or the filter criteria by modifying the underlying PS Query.
The pivot grids which shows the error data encountered by auto enrollment is available under Auto Enrollment Page as a separate tab. This report is for employees who have data changes. The administrator who has access to this page can view the error data and take corrective actions by making use of several detailed actions which are available on the pivot grid.
The errors encountered during batch processing and real time processing are logged to the same error table and the user can use the same pivot grid report for reviewing the errors in either of these cases.
The pivot grid report displays the schedule assignment in a bar chart. Enrollment Groups are listed on the x-axis and the count of number of employees matching different Enrollment Group criteria are represented on the y-axis. The pivot grid report shows all employee details in a grid located below the chart.
The Auto Enrollment page shows two types of error reports. They are errors for Time and Labor enrollments and Errors for Scheduled Assignment.
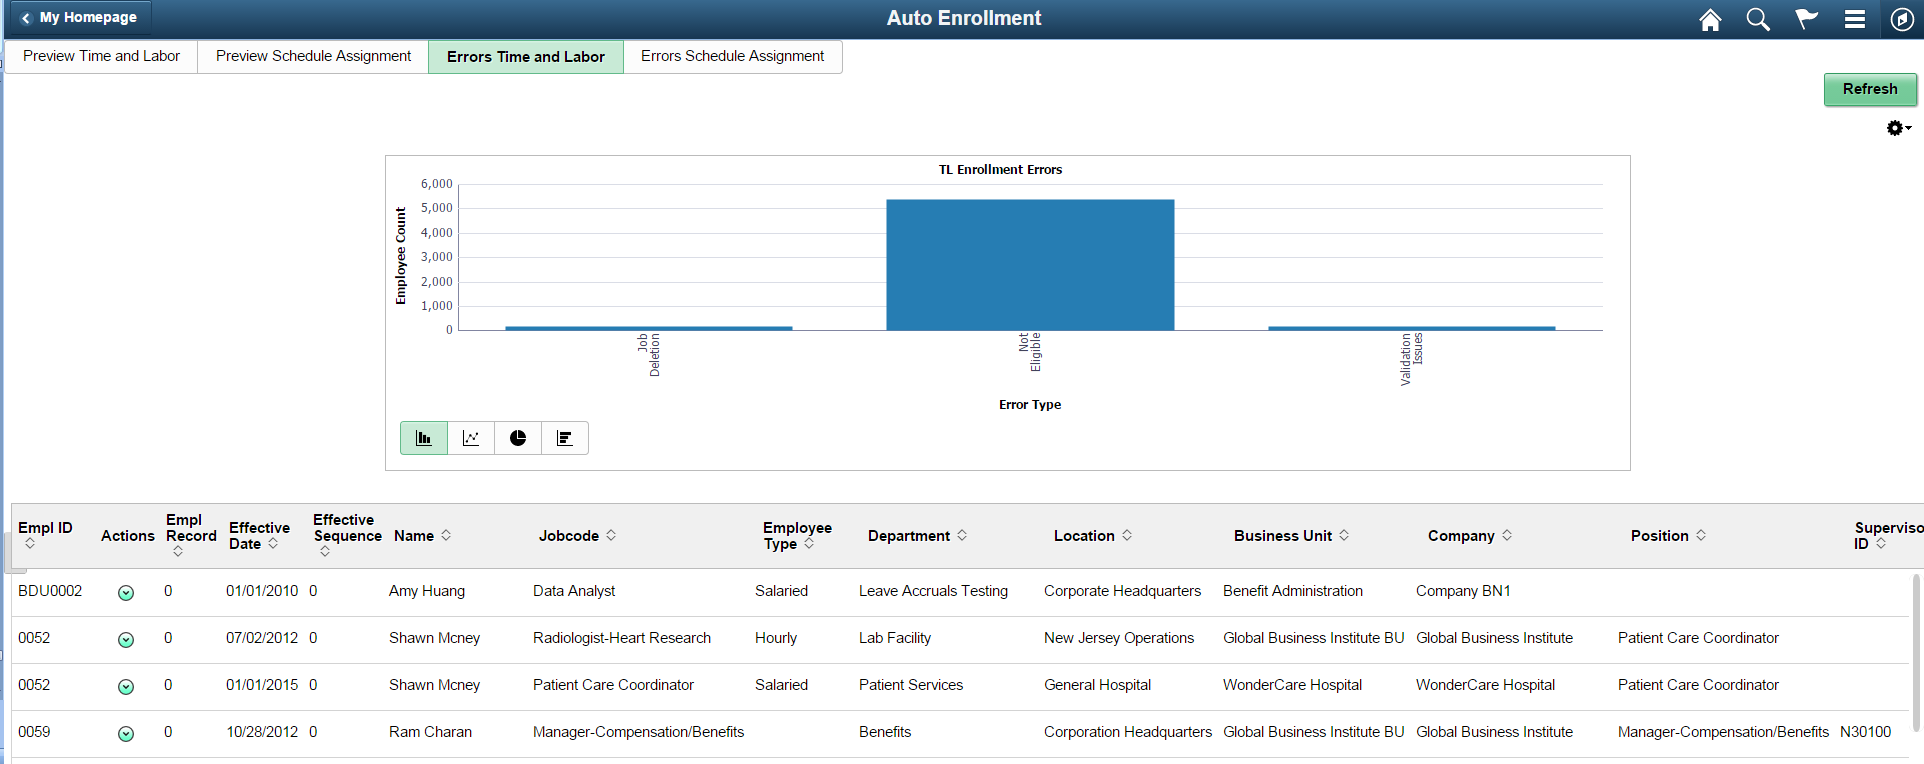
Errors encountered during time reporter data enrollments are classified into following error categories Job Deletion, Not Eligible Eligibility errors, Validation Issues and Retro Errors.
The bar chart is depicted with Error Type on the x-axis and employee count on the y-axis. The Pivot grid report shows all employee details in a grid located below the chart.
Navigation:
Tap the Errors Time and Labor tab on the Auto Enrollment page.
This example illustrates the fields and controls on the Errors Time and Labor page.
Field or Control |
Description |
|---|---|
|
Preview Error Detail and Job Data as required. The user can view the Enrollment Group and Notify the recipients using different delivery methods. |
Select anywhere on the chart to drill down the data. By default, you can deliver the drill down options Position, Union Code, Employee Type and Job code.
The Details grid shows the information about the employee for whom error exists and field values for Employee ID, Employee Record, Effective date, Effective Sequence, Name, Employee Type, Department, Location, Jobcode, Union Code, Position, Business Unit, Company, Supervisor ID, and Error Type, and Error Open Since.
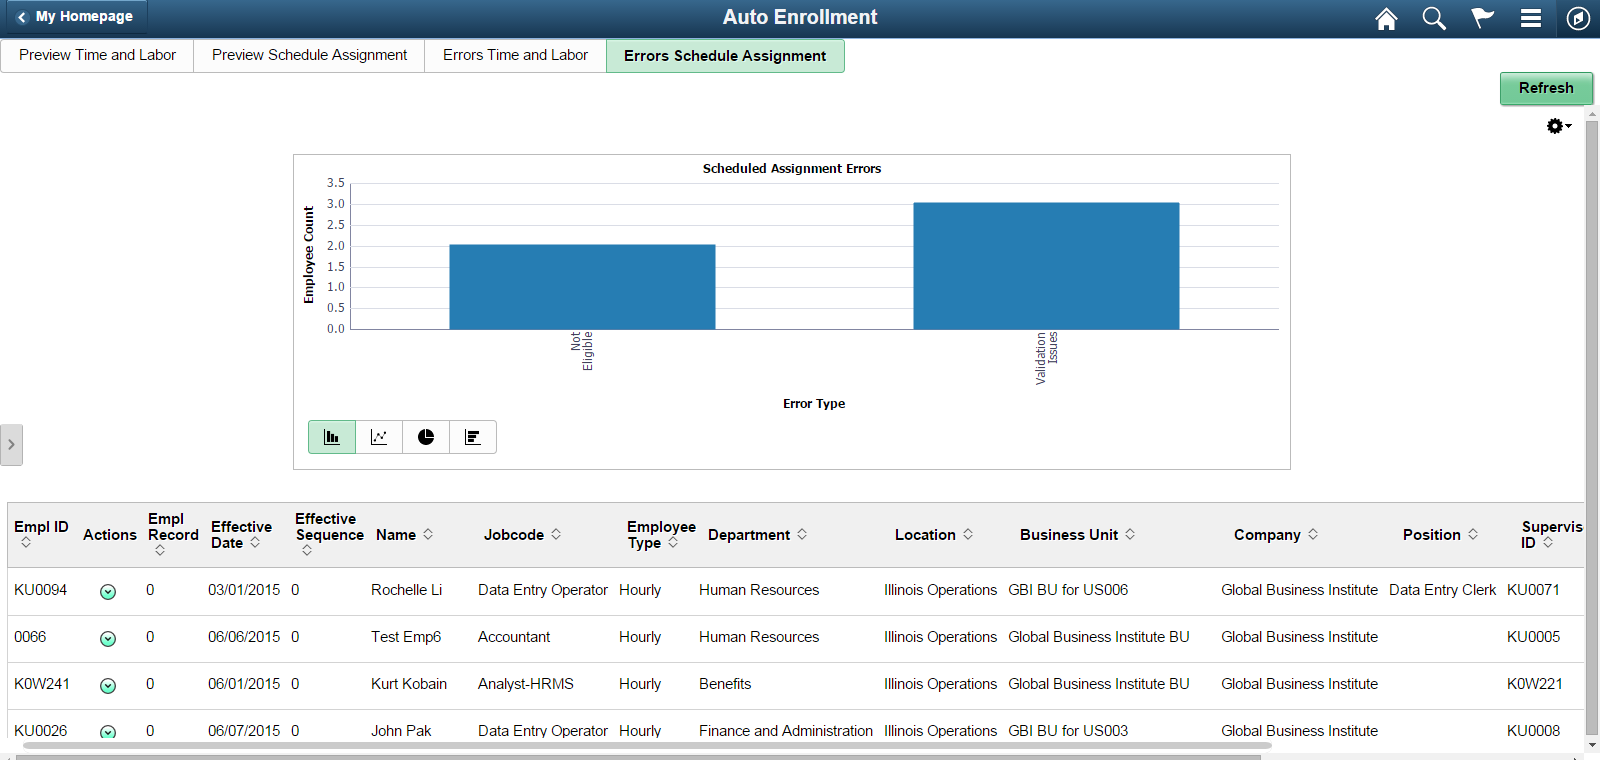
Errors which are encountered during schedule assignments are classified into the following categories Eligibility Error, Not Eligible, and Validation Issues.
This bar chart is depicted with Error Type on the x-axis and the employee Count on the y-axis.
Navigation:
Tap theErrors Schedule Assignment tab on the Auto Enrollment page.
This example illustrates the fields and controls on the Errors Schedule Assignment page.
Field or Control |
Description |
|---|---|
|
Preview Error Detail and Job Data as required. The user can view the Schedule Group and Notify the recipients using different delivery methods. |
Select anywhere on the chart to drill down the data. By default, you can use the drill down options Position, Union Code, Employee Type and Job code.
Note: Schedule assignments are done only at the time of hire or during first time enrollments, and thus Error type of Retro and Job Deletion are not applicable for Schedule Assignments
The Details grid shows the information about the employee for whom error exists and field values for Employee ID, Employee Record, Effective date, Effective Sequence, Name, Employee Type, Department, Location, Jobcode, Union Code, Position, Business Unit, Company, Supervisor ID, and Error Type, and Error Open Since.