Generating Reports for Analysis
The analytic reports provide assistance to do the analysis of data and determine eligibility for Affordable Care Act. You can also do the analysis on where the data is missing or inaccurate.
|
Page Name |
Definition Name |
Usage |
|---|---|---|
|
ACA_THRESHOLD_INST |
Configure the threshold levels. The configurations are found at this page. |
|
|
ACA_THRESHOLD |
Displays the analytics that is used to monitor variable (hourly) employees who have payable hours within a set number of ‘threshold’ hours (employer defined on run control). |
|
|
ACA_FULL_PART_TIME |
Displays employees with a full/part time status change whose effective date falls within the date parameters in the run control. |
|
|
ACA_HIRE_REHIRE |
Displays those employees who have an action of hire or rehire in Job with an effective date that falls within the date parameters in the run control. |
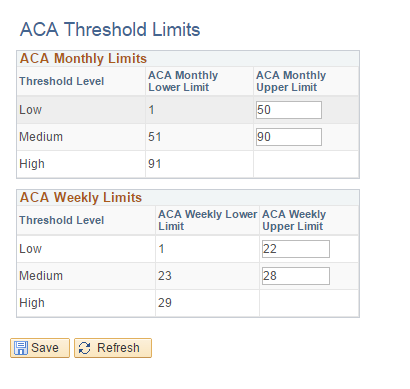
Use the ACA Threshold Limits page (ACA_THRESHOLD) to enter the monthly and weekly limits for payable hours used in calculating the threshold value for each level – Low, Medium and High
Navigation:
This example illustrates the fields and controls on the ACA Threshold Limits Page. You can find definitions for the fields and controls later on this page.
Field or Control |
Description |
|---|---|
ACA Monthly Lower Limit |
The lowest amount of Monthly average hours for a threshold level. |
ACA Monthly Upper Limit |
The highest amount of Monthly average hours for a threshold level. |
ACA Weekly Lower Limit |
The lowest amount of Weekly average hours for a threshold level. |
ACA Weekly Upper Limit |
The highest amount of Monthly average hours for a threshold level. |
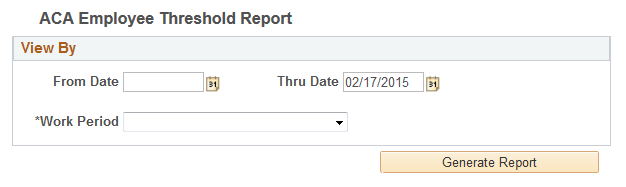
Use the ACA Employee Threshold Report page (ACA_THRESHOLD) to display variable (hourly) employees who have payable hours within a set number of ‘threshold’ hours defined on the ACA Threshold Limits table.
Navigation:
This example illustrates the fields and controls on the ACA Employee Threshold Report Page (1 of 2). You can find definitions for the fields and controls later on this page.
Field or Control |
Description |
|---|---|
From Date |
Enter the start date of the period which should be analyzed. |
Thru Date |
Enter the end date of the period which should be analyzed |
Work Period |
The work period from the ACA Employee Eligibility record. Possible values are Monthly or Weekly. This determine which employees are being brought into the results. |
This example illustrates the fields and controls on the ACA Employee Threshold Report Page (2 of 2). You can find definitions for the fields and controls later on this page.
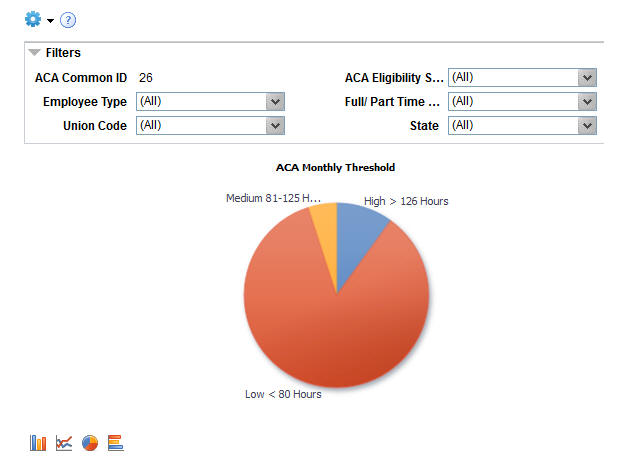
By default, the pivot grid displays a pie chart displaying the percentage of units per ACA Employee threshold.
Examples of what administrator can use this pivot grids to determine are:
The ACA Eligibility status of each employee for a given Threshold level.
The ACA Monthly or Weekly Average for a given threshold level.
The Location of the employee with the Company Name.
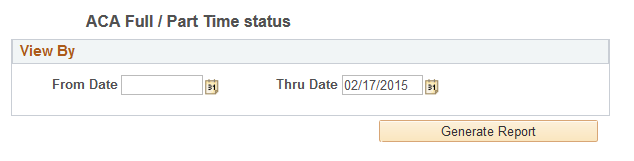
Use the ACA Full/Part Time Status page (ACA_FULL_PART_TIME) to displays those employees who went between Full-Time and Part-Time within the specified time period.
Navigation:
This example illustrates the fields and controls on the ACA Full/Part Time Status Page ( 1 of 2). You can find definitions for the fields and controls later on this page.
Field or Control |
Description |
|---|---|
From Date |
Enter the start date of the period which should be analyzed. |
Thru Date |
Enter the end date of the period which should be analyzed |
This example illustrates the fields and controls on the ACA Full/Part Time Status Page ( 2 of 2). You can find definitions for the fields and controls later on this page.
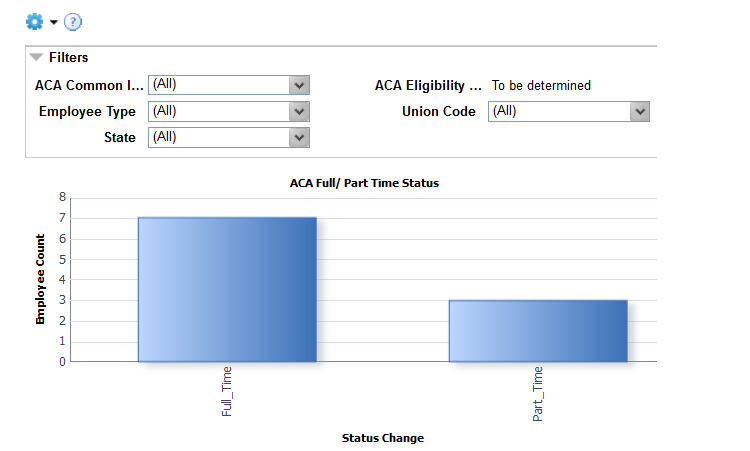
By default, the pivot grid displays a bar chart of the Employee Count for the employee status of full time and part time.
Examples of what administrator can use this pivot grids to determine are:
The status of an employee and the corresponding effective date.
The current standard hours and the previous standard hours.
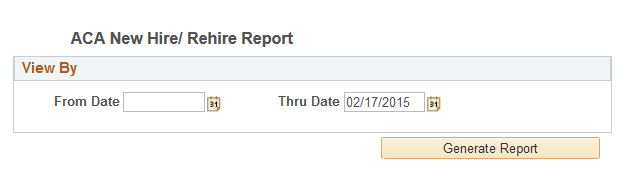
Use the ACA New Hire/Rehire Report page(ACA_HIRE_REHIRE) to display those employees who have an action of hire or rehire in Job with an effective date that falls within the date parameters in the run control.
Navigation:
This example illustrates the fields and controls on the ACA New Hire/Rehire Report Page (1 of 2). You can find definitions for the fields and controls later on this page.
Field or Control |
Description |
|---|---|
From Date |
Enter the start date of the period which should be analyzed. |
Thru Date |
Enter the end date of the period which should be analyzed |
This example illustrates the fields and controls on the ACA New Hire/Rehire Report Page (2 of 2). You can find definitions for the fields and controls later on this page.

By default, the pivot grid displays a bar chart of the Employee Count for the new Hire and Rehire.
Examples of what administrator can use this pivot grids to determine are:
The Employee Job Title and the corresponding Pay Group.
The standard hours and the corresponding Business Unit of the employee.