Viewing the Compensation Pagelets
These topics discuss the compensation pagelets.
The Base Salary History pagelet displays the compensation history for an employee.
This example illustrates the fields and controls on the Base Salary History pagelet. You can find definitions for the fields and controls later on this page.
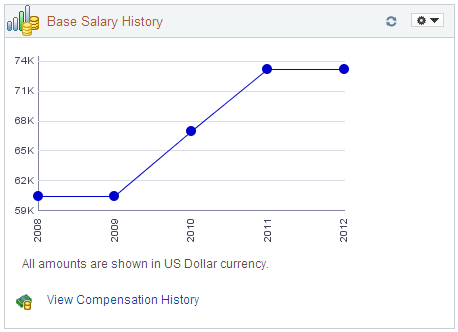
Use this pagelet to view salary change history. The pagelet displays the last five years of compensation. Pause over the graph line points to view the exact employee’s salary for a specific year.
Note: In order for the pagelet to display data, it may be necessary to modify the access type for the View Compensation History (HR_SS_MG_COMP_HIST) component on the Direct Reports Configuration page by navigating to
Field or Control |
Description |
|---|---|
|
Click this link to open the Compensation History page in self service and view the employee's salary, variable cash, and variable noncash information. |

The Current Salary pagelets displays the salary range for an employee’s job and where the employee falls within that range.
This example illustrates the fields and controls on the Current Salary pagelets. You can find definitions for the fields and controls later on this page.
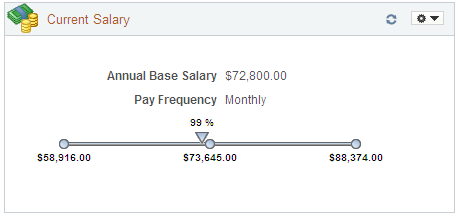
The pagelet displays the minimum, midpoint, and maximum of the salary grade for this employee’s job. The arrow icon that runs across the salary range bar indicates the employee’s compa-ratio. The percentage that appears is in comparison to the midpoint of the range. You can pause over the arrow icon to view the employee’s actual salary.
The Total Rewards pagelets displays the composition of an employee’s compensation and rewards package.
This example illustrates the fields and controls on the Total Rewards pagelets. You can find definitions for the fields and controls later on this page.
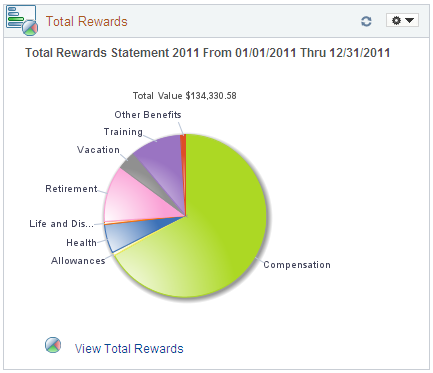
Use this pagelet to view a summary chart depicting a graphical representation of compensation and benefit summary information. The pagelet displays the most recent total rewards information for the employee.
The top of the pagelet displays the employee’s total rewards value amount. Pause over various pie slices in the graphic to see the amount associated with each rewards component and its percentage of the reward. Click each individual pie slice to view more details about that reward. For example, a health benefit may represent 10 percent of your total reward, and by clicking the Health pie slice, you can see that the benefit is comprised of health and dental insurance.
Field or Control |
Description |
|---|---|
|
Click this link to open the View Total Rewards page. Review compensation and benefit summary information for a particular reward period. |

Note: The Total Rewards pagelet will display data only when the Total Rewards feature has been implemented.