Viewing Ratings Summaries
This topic provides an overview on ratings distribution, lists prerequisites, and discusses how to:
View rating distribution summaries.
View rating distribution details.
|
Page Name |
Definition Name |
Usage |
|---|---|---|
|
EP_DISTRIB_SUM |
View the preliminary, actual, and desired rating distributions for a group of employees and document type. |
|
|
EP_DISTRIB_DTL |
View details for employees that fall into the selected rating category or point spread on the rating distribution bar chart. |
The ratings distribution summary report is the most reliable if the documents for everyone in the ratings distribution group are no longer in the In Progress status, and that an overall summary rating was entered or calculated on all documents. Additionally, because the rating distribution reports include preliminary ratings, you should ensure that all preliminary ratings are entered.
Before you can view a rating distribution summary you must:
Define the desired rating distribution on the Setup Rating Distribution page.
Build the data collection from which the rating distribution is generated on the Create Summary Data page.
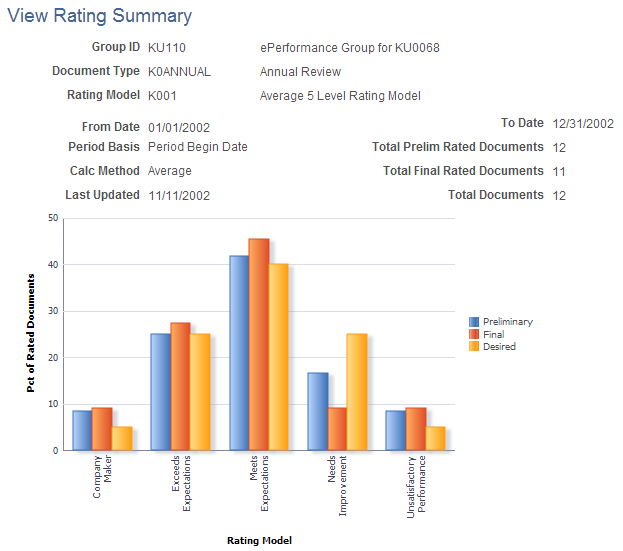
Use the View Rating Summary page (EP_DISTRIB_SUM) to view the preliminary, actual, and desired rating distributions for a group of employees and document type.
Navigation:
This example illustrates the fields and controls on the View Rating Summary page.
Field or Control |
Description |
|---|---|
Group ID |
The group ID for the employees whose rating results appear on the page. |
Rating Model |
The rating model that is used to quantify and evaluate employee performance. |
Calc Method calculation method) |
The method that is used to calculate ratings. Values are: Summary, Average, and Review Band. Note: The document template defines the calculation method. |
Last Updated |
The date on which the document rating distribution data that appears on the page was last calculated. Note: To calculate the data, you must run the Create Summary Data process. |
Total Prelim Rated Documents (total preliminary rated documents) |
The total number of documents for which preliminary ratings were defined. |
Total Final Rated Documents |
The total number of documents with final rating results. |
Bar Chart Data
The information that the bar chart represents depends on the method that is used to calculate the overall ratings:
If the calculation method is Average or Review Band:
The vertical axis shows the percentage of completed documents.
The horizontal axis shows qualitative rating categories, for example: Company Maker or Exceeds Expectations.
If the calculation method is Summation:
The vertical axis shows the percentage of documents that fall into each point range that is defined on the Desired Rating Distribution page.
The horizontal axis shows each from and to point range that is defined on the Desired Rating Distribution page.
For both calculation methods, the bar chart compares preliminary, actual, and desired results. Preliminary results come from the Preliminary Ratings page; actual ratings come from the Manager Evaluation page; desired results come from the Desired Rating Distribution Table page.
Click a preliminary or actual bar to access the Rating Distribution Details page, where you can view detailed information for the selected rating category or point spread.
Use the Rating Distribution Detail page (EP_DISTRIB_DTL) to view details for employees that fall into the selected rating category or point spread on the rating distribution bar chart.
Navigation:
Click a bar on the View Rating Summary page.
This example illustrates the fields and controls on the Rating Distribution Detail page.

This page lists detailed information for the employees within the rating category or point spread that you selected on the Rating Distribution Summary page.
Field or Control |
Description |
|---|---|
Calculation Method |
The calculation method that is used to calculate the overall ratings. Values are Average, Review Band, and Summation. |
Approval Status |
The code for the approval status:
|