Analyzing Expense Variance
You use the expense variance pages to analyze expense variance by department, manager, purchase order, or supplier.
|
Page Name |
Definition Name |
Usage |
|---|---|---|
|
SPR_EXPVAR_DASH_PG |
View expense variance summary graphs and data. Modify parameters that are used to create the graphs. Access detail pages. |
|
|
Expense Variance - Department Details Page |
SPR_EXPVARDR_PG |
View detailed expense variance information for a selected department. |
|
Expense Variance - Manager Details Page |
SPR_EXPVARMR_PG |
View detailed expense variance information for a selected manager. |
|
Expense Variance - Purchase Order Details Page |
SPR_EXPVAROR_PG |
View detailed expense variance information for a selected purchase order. |
|
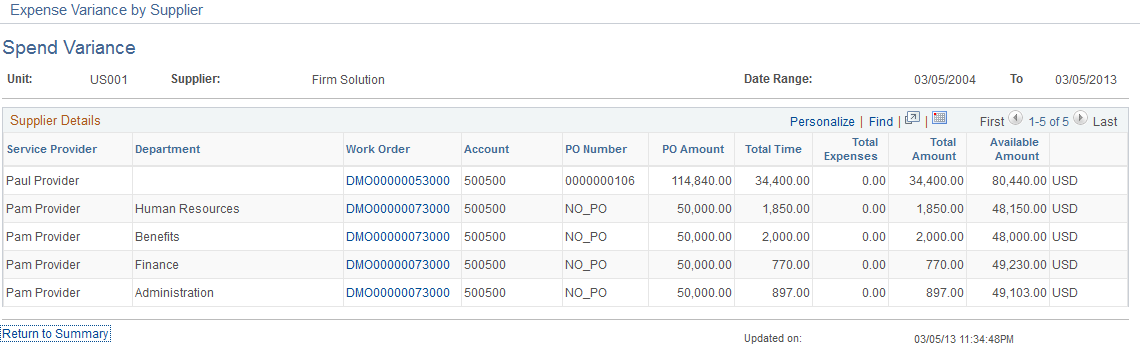
Expense Variance - Supplier Details Page |
SPR_EXPVARSR_PG |
View detailed expense variance information for a selected supplier. |
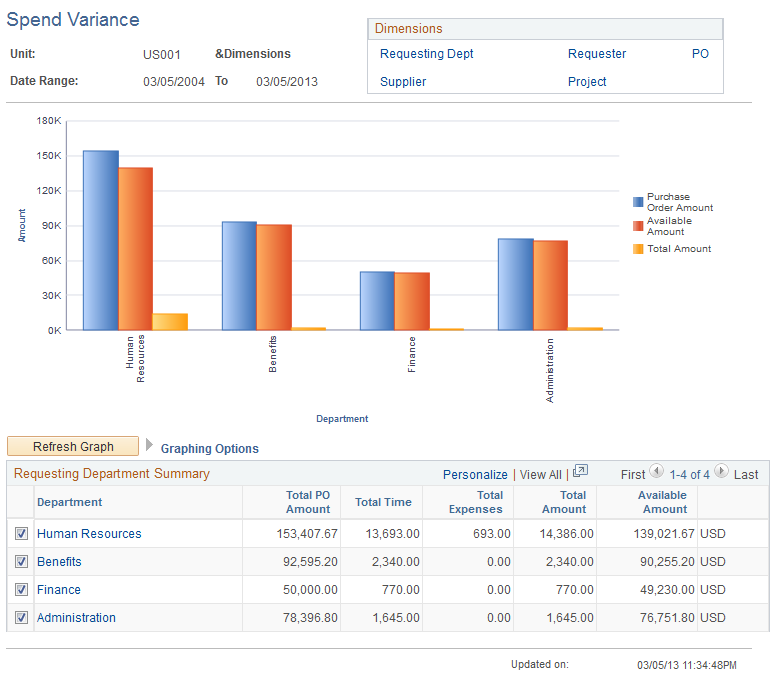
Use the Spend Variance (summary) page (SPR_EXPVAR_DASH_PG) to view spend variance summary graphs and data.
Modify parameters that are used to create the graphs. Access detail pages.
Navigation:
This example illustrates the fields and controls on the Spend Variance (summary) page. You can find definitions for the fields and controls later on this page.
Field or Control |
Description |
|---|---|
Graphing Options |
Select the options in the collapsible Graphing Options group box to define the parameters that are used for the graph. You must select parameters of like measurements. For example, you cannot select one measurement based on time and another based on count. The system displays an error message if you select parameters that are of different measurement types. |
Refresh Graph |
Click to display the graph by using the selected graphing options and data points. Note: Each row of data with a selected check box that appears on the bottom of the page is used as a data point for the graph. By default, the system graphs the first five selected data rows that appear in the grid. You can select more than five rows, but the information appears smaller on the graph. |
Variance Amount |
Displays the difference between the total purchase order amount and forecast total. |
Use the Spend Variance - Additional Info page to view additional information for a selected department.
Navigation:
Click the Additional Info link on the Spend Variance (summary) page for department.
This example illustrates the fields and controls on the Spend Variance page: Additional Info .
Field or Control |
Description |
|---|---|
|
Click the Show All Columns button to view data from both the Expense Info (expense information) tab. |
