Using the Statistical Matrix
This topic discusses how to view statistical matrix data.
|
Page Name |
Definition Name |
Usage |
|---|---|---|
|
None |
Display statistics as columns or rows determined by settings in the graph preferences. |
Use the Statistical Matrix panel to display statistics as columns or rows determined by settings in the graph preferences.
Navigation:
Click the Statistical Matrix button.
This example illustrates the fields and controls on the Statistical Matrix. You can find definitions for the fields and controls later on this page.
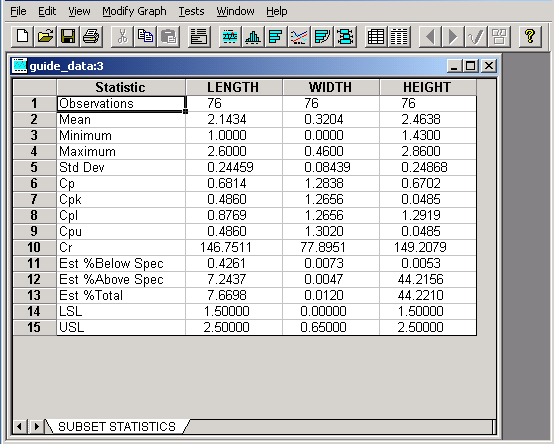
The statistical matrix format is similar to a spreadsheet. You can view tabular formatted statistics related to one or more subsets of the dataset in the following categories:
General statistics
Includes mean, observations, standard deviation, variance, covariance, range, minimum, maximum, skewness, kurtosis, Z scores, sum, upper and lower sigma, quartile, and median.
Capability indices
Includes Cp, Cpk, Cpl, Cpu, Cr, Cpk at 90 percent, percent below specification, percent above specification, percent of total specification, and other associated statistics.
Defect statistics
Includes defect sum, defects per unit, defects per hundred, defects per thousand, and defects per million.
The statistical matrix display uses the Measure column row assignments and the selected graph preferences from the Selector panel.