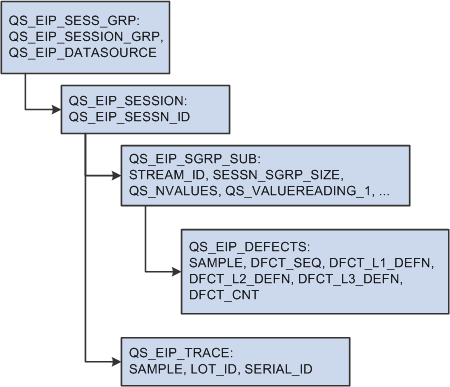
Using EIP Data Scenarios
How you define the Quality measurement plans determines how you should define and structure the Quality EIPs. The simpler the plans, the easier to define subgroups using EIPs.
Note: Complex measurement plans are inherently more difficult to integrate, test, and validate. Plans that may be appropriate for manual data entry might be cumbersome or impractical in an EIP configuration.
|
Sample |
Traceability Item 1 |
Traceability Item 2 |
Characteristic 1 |
Characteristic 2 |
|---|---|---|---|---|
|
1 |
none |
none |
none |
none |
|
2 |
none |
none |
none |
none |
|
3 |
none |
none |
none |
none |
This diagram illustrates the EIP data scenario
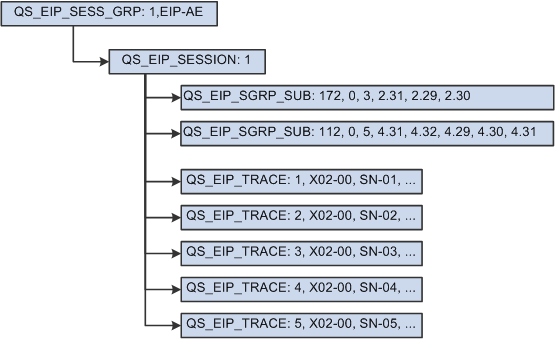
Scenario #1
A simple measurement plan with two variables type characteristics.
|
Sample |
Lot Number |
Serial Number |
Length |
Width |
|---|---|---|---|---|
|
1 |
X02-00 |
SN-01 |
2.31 |
4.31 |
|
2 |
X02-00 |
SN-02 |
2.29 |
4.32 |
|
3 |
X02-00 |
SN-03 |
2.30 |
4.29 |
This diagram illustrates scenario #1 that has a simple measurement plan with two variables type characteristics.
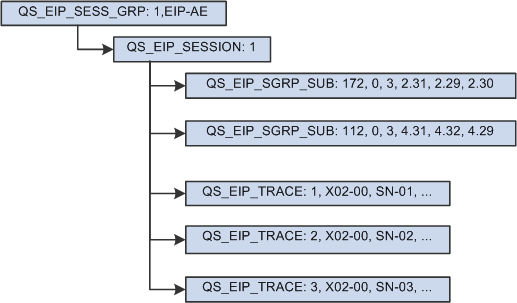
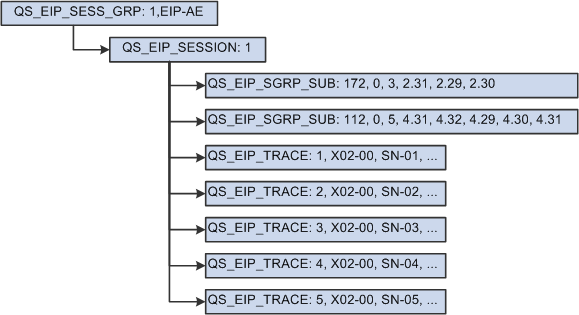
Scenario #2
A measurement plan containing variables type characteristics with one derived characteristic. In this scenario, the area characteristic is derived from the length and width characteristics.
|
Sample |
Lot Number |
Serial Number |
Length |
Width |
Area + |
|---|---|---|---|---|---|
|
1 |
X02-00 |
SN-01 |
2.31 |
4.31 |
none |
|
2 |
X02-00 |
SN-02 |
2.29 |
4.32 |
none |
|
3 |
X02-00 |
SN-03 |
2.30 |
4.29 |
none |
This diagram illustrates scenario #2 that has a measurement plan containing variables type characteristics with one derived characteristic.
Note: You must submit a QS_EIP_SGRP_SUB record for the derived area characteristic, because the system knows nothing about measurement plans. It only knows and understands process streams. For the system to calculate the areas for this session, it must be asked to do so.
Scenario # 3
A measurement plan that contains variables type characteristics with non-uniform subgroup sample sizes.
|
Sample |
Lot Number |
Serial Number |
Length |
Width |
|---|---|---|---|---|
|
1 |
X02-00 |
SN-01 |
2.31 |
4.31 |
|
2 |
X02-00 |
SN-02 |
2.29 |
4.32 |
|
3 |
X02-00 |
SN-03 |
2.30 |
4.29 |
|
4 |
X02-00 |
SN-04 |
none |
4.30 |
|
5 |
X02-00 |
SN-05 |
none |
4.31 |
This diagram illustrates scenario #3 that has a measurement plan containing variables type characteristics with non-uniform subgroup sample sizes.
Scenario #4
A measurement plan with variables type characteristics with readings for one of the characteristics that is incomplete. In this scenario, length readings are incomplete.
|
Sample |
Lot Number |
Serial Number |
Length |
Width |
|---|---|---|---|---|
|
1 |
X02-00 |
SN-01 |
2.31 |
4.31 |
|
2 |
X02-00 |
SN-02 |
2.29 |
4.32 |
|
3 |
X02-00 |
SN-03 |
2.30 |
4.29 |
|
4 |
X02-00 |
SN-04 |
- |
4.30 |
|
5 |
X02-00 |
SN-05 |
- |
4.31 |
This diagram illustrates scenario #4 that has a measurement plan containing variables type characteristics with readings for one of the characteristics that is incomplete.
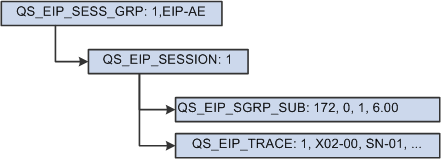
Scenario #5
A simple defectives type sample where the subgroup size is fixed.
|
Sample |
Lot Number |
Bad Units |
|---|---|---|
|
1 |
X02-00 |
6.00 |
This diagram illustrates scenario #5 that has a simple defectives type sample where the subgroup size is fixed.
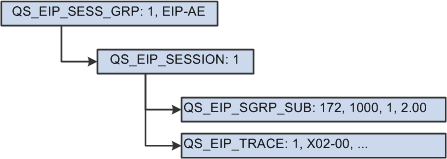
Scenario #6
A defectives type sample where the subgroup sample size is variable.
|
Sample |
Lot Number |
Defective Units Subgroup Size |
Defective Units Bad Units |
|---|---|---|---|
|
1 |
X02-00 |
1000 |
2.00 |
This diagram illustrates scenario #6 that has a defectives type sample where the subgroup sample size is variable.
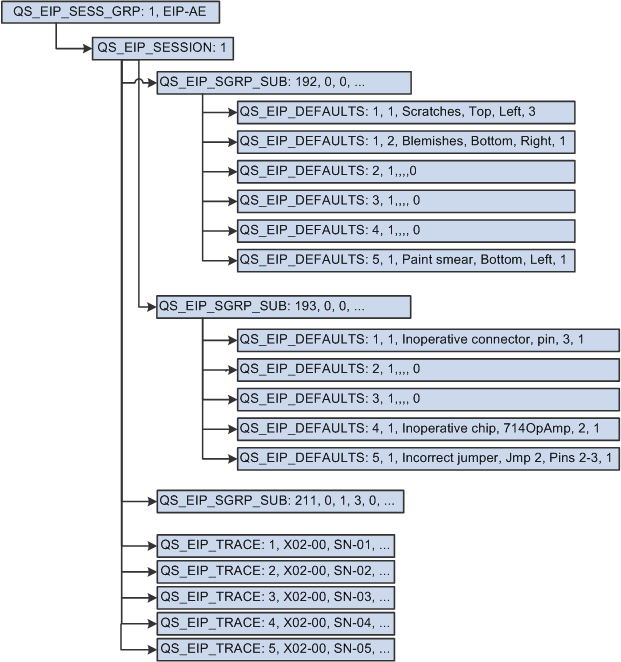
Scenario #7
A measurement plan with defectives categorized where the subgroup sample size is fixed at five. A sample might have one or more defects that qualify as making the item defective. In this scenario, there are five items, two of which are defective. In addition to noting the number of defective units, state the reason why they are defective.
Note: The data source determines whether the collection of defects constitutes a defective item.
|
Sample |
Lot Number |
Serial Number |
Defectives Defect |
Defectives Bad Units |
|---|---|---|---|---|
|
1 |
X02-00 |
SN-01 |
3 Scratches, Top, Left 1 Broken, Contact Pin, P4 |
2 |
|
2 |
X02-00 |
SN-02 |
No defects |
none |
|
3 |
X02-00 |
SN-03 |
No defects |
none |
|
4 |
X02-00 |
SN-04 |
No defects |
none |
|
5 |
X02-00 |
SN-05 |
1 Paint Smear, Bottom, Left |
none |
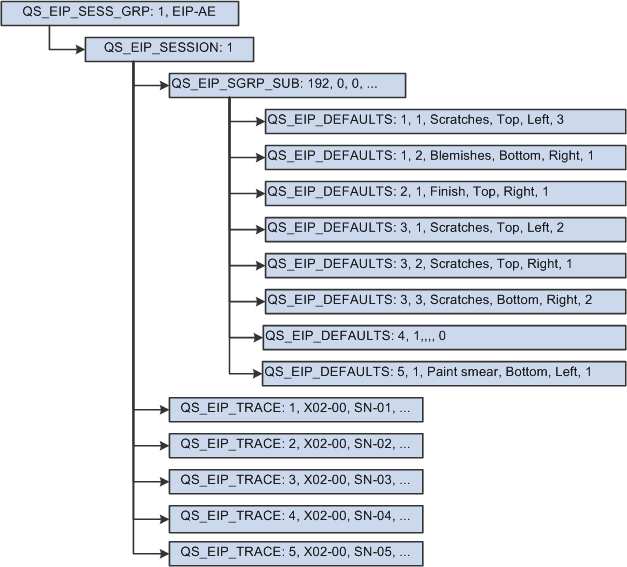
This diagram illustrates scenario #7 that has a measurement plan with defectives categorized where the subgroup sample size is fixed at five.

Scenario #8
A measurement plan with defects data type characteristics where the subgroup sample size is fixed or variable.
|
Sample |
Lot Number |
Serial Number |
Physical Defects * |
|---|---|---|---|
|
1 |
X02-00 |
SN-01 |
3 Scratches, Top, Left 1 Blemishes, Bottom, Right |
|
2 |
X02-00 |
SN-02 |
1 Finish, Top, Right |
|
3 |
X02-00 |
SN-03 |
2 Scratches, Top, Left 1 Scratches, Top, Right 2 Scratches, Bottom, Right |
|
4 |
X02-00 |
SN-04 |
No defects |
|
5 |
X02-00 |
SN-05 |
1 Paint smear, Bottom, Left |
Note: * Physical Defects is a user-defined characteristic name and not a predefined type.
This diagram illustrates scenario #8 that has a measurement plan with defects data type characteristics where the subgroup sample size is fixed or variable.
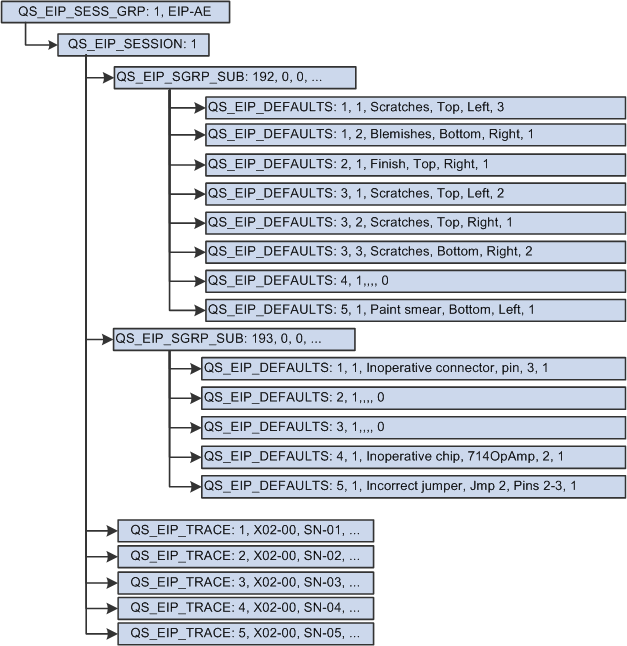
Scenario #9
A measurement plan with two defects data type characteristics where the subgroup sample size is uniform.
|
Sample |
Lot Number |
Serial Number |
Physical Defects * |
Electrical Defects * |
|---|---|---|---|---|
|
1 |
X02-00 |
SN-01 |
3 Scratches, Top, Left 1 Blemishes, Bottom, Right |
1 Inoperative connector, pin, 3 |
|
2 |
X02-00 |
SN-02 |
1 Finish, Top, Right |
No defects |
|
3 |
X02-00 |
SN-03 |
2 Scratches, Top, Left 1 Scratches, Top, Right 2 Scratches, Bottom, Right |
No defects |
|
4 |
X02-00 |
SN-04 |
No defects |
1 Inoperative chip, 741OpAmp, 2 |
|
5 |
X02-00 |
SN-05 |
1 Paint Smear, Bottom, Left |
I Incorrect jumper, Jmp 2, Pins 2-3 |
Note: * Physical Defects and Electrical Defects are user-defined characteristic names and not predefined types.
This diagram illustrates scenario #9 that has a measurement plan with two defects data type characteristics where the subgroup sample size is uniform.
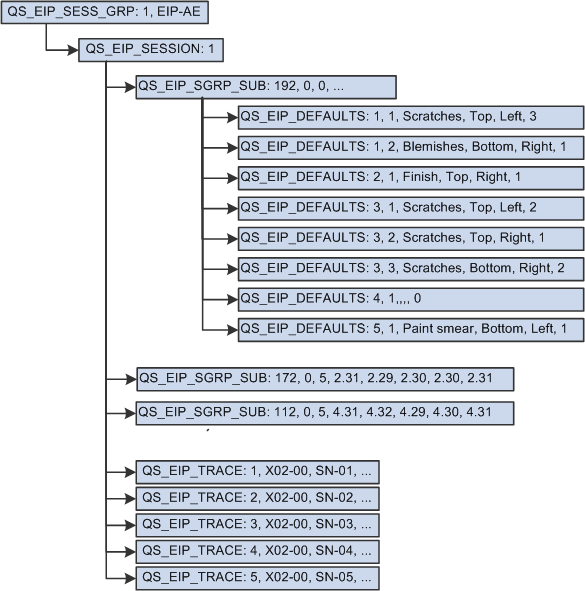
Scenario #10
A measurement plan with variables and defects data type characteristics with a uniform subgroup sample size of 5.
|
Sample |
Lot Number |
Serial Number |
Physical Defects * |
Length |
Width |
|---|---|---|---|---|---|
|
1 |
X02-00 |
SN-01 |
3 Scratches, Top, Left 1 Blemishes, Bottom, Right |
2.31 |
4.31 |
|
2 |
X02-00 |
SN-02 |
1 Finish, Top, Right |
2.29 |
4.32 |
|
3 |
X02-00 |
SN-03 |
2 Scratches, Top, Left 1 Scratches, Top, Right 2 Scratches, Bottom, Right |
2.30 |
4.29 |
|
4 |
X02-00 |
SN-04 |
No defects |
2.30 |
4.30 |
|
5 |
X02-00 |
SN-05 |
1 Paint smear, Bottom, Left |
2.31 |
4.31 |
Note: * Physical Defects is a user-defined characteristic name and not a predefined type.
This diagram illustrates scenario #10 that has a measurement plan with variables and defects data type characteristics with a uniform subgroup sample size of 5.
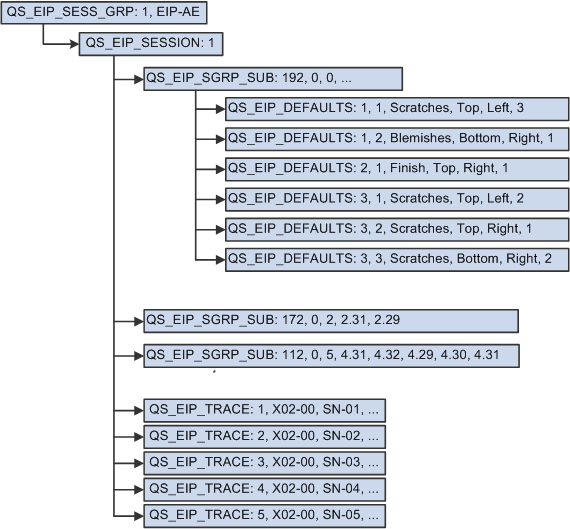
Scenario #11
A measurement plan with variables and defects data type characteristics and a non-uniform subgroup sample size.
|
Sample |
Lot Number |
Serial Number |
Physical Defects * |
Length |
Width |
|---|---|---|---|---|---|
|
1 |
X02-00 |
SN-01 |
3 Scratches, Top, Left 1 Blemishes, Bottom, Right |
2.31 |
4.31 |
|
2 |
X02-00 |
SN-02 |
1 Finish, Top, Right |
2.29 |
4.32 |
|
3 |
X02-00 |
SN-03 |
2 Scratches, Top, Left 1 Scratches, Top, Right 2 Scratches, Bottom, Right |
none |
4.29 |
|
4 |
X02-00 |
SN-04 |
none |
none |
4.30 |
|
5 |
X02-00 |
SN-05 |
none |
none |
4.31 |
Note: * Physical Defects is a user-defined characteristic name and not a predefined type.
his diagram illustrates scenario #11 that has a measurement plan with variables and defects data type characteristics and a non-uniform subgroup sample size.
Scenario #12
A measurement plan with two defects and one defectives data type characteristics where the subgroup sample size is uniform.
|
Sample |
Lot Number |
Serial Number |
Physical Defects * |
Electrical Defects * |
Bad Units |
|---|---|---|---|---|---|
|
1 |
X02-00 |
SN-01 |
3 Scratches, Top, Left 1 Blemishes, Bottom, Right |
1 Inoperative connector, pin, 3 |
3 |
|
2 |
X02-00 |
SN-02 |
No defects |
No defects |
none |
|
3 |
X02-00 |
SN-03 |
No defects |
No defects |
none |
|
4 |
X02-00 |
SN-04 |
No defects |
1 Inoperative chip, 741OpAmp, 2 |
none |
|
5 |
X02-00 |
SN-05 |
1 Paint smear, Bottom, Left |
1 Incorrect jumper, Jmp 2, Pins 2-3 |
none |
Note: * Physical Defects and Electrical Defects are user-defined characteristic names and not predefined types.
This diagram illustrates scenario #12 that has a measurement plan with two defects and one defectives data type characteristics where the subgroup sample size is uniform.