Using Bar Graphs
This topic discusses how to use Bar graphs.
|
Page Name |
Definition Name |
Usage |
|---|---|---|
|
None |
Compare a selected statistic among subsets. |
|
|
None |
Modify settings and display characteristics for the active bar graph window. |
Use the Bar Graph panel to compare a selected statistic among subsets.
Navigation:
Click the Bar Graph button.
This example illustrates the fields and controls on the Bar Graph panel. You can find definitions for the fields and controls later on this page.
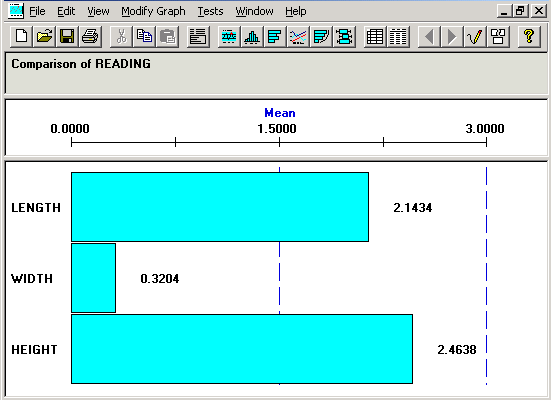
The bar graph is comprised of multiple panes (sections) that display information about the subset that you are examining. You resize sections the same as you do for a histogram. There is a bar on the graph for each subset you selected in the Selector panel.
Title Section
This section of the bar graph displays the statistics that you are comparing.
Field or Control |
Description |
|---|---|
Pearson Best-Fit, Tested for Normality, and Normality Assumed |
Displays how the data distribution was assessed. |
Scale Section
This section displays the name of the statistical item you are comparing
Field or Control |
Description |
|---|---|
Name and Scale |
Displays upper and lower scale limits (based on the minimum and maximum statistical values). To select a different statistic, select |
Graph Section
This section displays a bar for each subset chosen from the Selector panel.
Use the Modify Bar Graph dialog box to modify settings and display characteristics for the active bar graph window.
Navigation:
Open a bar graph.
You can modify the size of the bar display, the bar values, reorder, and change the statistic on the bar graph. Any changes you make to the bar graph are in effect only for the active chart. If you open a second bar graph window, the changes are not in effect.
Field or Control |
Description |
|---|---|
Fit Bars to Window |
Select to expand the graph to fit the full size of the Bar Graph panel, eliminating the vertical scroll bar. |
Display Bar Values |
Select to display numeric values for each bar on the graph. |
Indicate Min/Max (<>) Bars (indicate minimum/maximum bars) |
Select to indicate which bars represent the minimum and maximum values. The bar that contains the lowest value displays <. The bar with the highest value displays >. This option is useful for distinguishing the highest and lowest value bars among bars of similar lengths. |
Bar Display Limit (# bars) (number of bars) |
Enter the number of bars to display on the graph. The limits for constraining the number of bars are from 2 to 1000. By default (or by entering 0 or 1), all the subsets that you selected in the Selector panel appear. |
Graphing Order (Bars) |
Select the order in which the bars (subsets) appear on the bar graph. Options are: Selection: Displays subsets in the order that they were selected on the Selector panel. Ascending: Displays bars in ascending order by statistical value. Descending: Displays bars in descending order by statistical value. |
Statistic |
Select an item from the list to compare. For example, you can compare machines to machines or compare multiple readings for cylinders of different diameters. Values include: MEAN MINIMUM STDDEV VARIANCE COEFVAR KURTOSIS ZUPPER UPPER3S SUMX SUMZ Q1 Q3 AVEVARS CPK CPU PCSPEC PCUPPER SUMDEF DEFPT DEFPU USL FACT2 OBSRV MAXIMUM RANGE STDERR SKEWNESS ZLOWER LOWER3S DISTYPE SUMX2 SIZEN MEDIAN AVEMEANS CP CPL CPK90 PCLOWER PCTOTAL DEFPH DEFPM LSL FACT1 TRANS |
Scale Limits |
Enter values for the lower and upper display limits. |