Maintaining Graph and Display Preferences
To define graph preferences, use the Graph Preferences component (GRAPH_PREF). This topic discusses how to maintain graph and display preferences.
|
Page Name |
Definition Name |
Usage |
|---|---|---|
|
QS_GRSET |
Define the settings for calculations and the defaults for graphic displays for new graph preferences or change settings on predefined graph preferences. The online graphic displays and statistical content are determined by how you define these preferences. At run time these settings remain static and cannot be changed by the user. If you are using the Quality application client offline against an extracted or user-defined data set, the graph type is selectable and certain settings can be changed by using the Modify Graph menu option from the Quality application client toolbar. |
|
|
QS_STATSELECT_PNL |
Associate statistics with control charts, histograms, or Pareto charts. |
Use the Define Graph Preferences page (QS_GRSET) to define the settings for calculations and the defaults for graphic displays for new graph preferences or change settings on predefined graph preferences.
The online graphic displays and statistical content are determined by how you define these preferences. At run time these settings remain static and cannot be changed by the user.If you are using the Quality application client offline against an extracted or user-defined data set, the graph type is selectable and certain settings can be changed by using the Modify Graph menu option from the Quality application client toolbar.
Navigation:
Field or Control |
Description |
|---|---|
Graph Preference ID |
A sequential ID that is automatically assigned to a graph by the system appears. |
Graph Preference Name |
Enter a user-defined name for the graph. |
Default Working Graph |
Select the default graph that you want to view when performing online operations, such as data entry and alarm review. Options are: Control Chart, Histogram, and Pareto Chart. |
Default Pareto Chart Item |
Select the attribute type that you want to plot on the Pareto Chart. Options are: Control Test Violations, Corrective Actions, Defects, and Probable Causes. |
Pareto Cell Display Limit |
Enter the number of cells to display based upon cell count and the graphing order that you select. |
Bar Graph Display Limit |
Enter the number of bars to display based on the statistics value and the graphing order that you select. |
Display Control Chart Alarms |
Select to activate alarm point enunciation on each chart. Alarms are indicated on a separate (stacked) bar graph located below the control chart. The charts are arranged so that alarms (bars) will line up for each plot point on the control chart. The absence of a bar indicates no alarms for that point, a bar extending above the x-axis indicates an alarm charged against the means chart, and a bar extending below the x-axis indicates an alarm against the variance chart. If this option is not selected then the bar graph will not appear. |
Indicate Specs on Histogram |
Select to overlay the current characteristic specification limits on the histogram. For online graphs, the specification limits are indicated in the cell listing area and not actually drawn on the graph. |
Statistics List |
Click this link to access the Statistic Selections page, where you can select the statistics that you want to associate with control charts, histograms, or Pareto charts and the order in which the statistics appear. |
Use the Statistic Selections page (QS_STATSELECT_PNL) to associate statistics with control charts, histograms, or Pareto charts.
Navigation:
Click the Statistics List link on the Define Graph Preferences page.
This example illustrates the fields and controls on the Statistic Selections page. You can find definitions for the fields and controls later on this page.
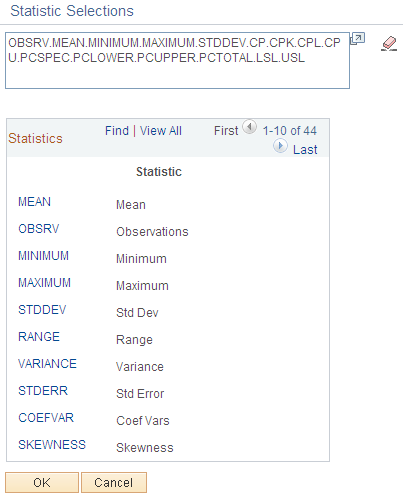
Use the scroll function to display all statistics and associated descriptions that are available in the Statistics Catalog. Click the different statistics links to select and place them into the list for the graphic or display. The following table shows the 44 statistics that are available on the Statistic Selections page.
|
Statistic |
Statistic Description |
Data Type Qualifier |
|---|---|---|
|
MEAN |
Mean. |
Any |
|
OBSRV |
Observations. |
Any |
|
MINIMUM |
Minimum. |
Any |
|
MAXIMUM |
Maximum. |
Any |
|
STDDEV |
Std Dev (standard deviation). |
Any |
|
RANGE |
Range. |
Any |
|
VARIANCE |
Variance. |
Any |
|
STDERR |
Std Error (standard error). |
Any |
|
COEFVAR |
Coef Vars (coefficient variables). |
Any |
|
SKEWNESS |
Skewness. |
Any |
|
KURTOSIS |
Kurtosis. |
Any |
|
ZLOWER |
Lwr Z Score (lower Z score). |
Any |
|
ZUPPER |
Upr Z Score (upper Z score). |
Any |
|
LOWER3S |
Lwr 3 Sigma (lower 3 Sigma). |
Any |
|
UPPER3S |
Upr 3 Sigma (upper 3 Sigma). |
Any |
|
DISTYPE |
Dist Type (distribution type). |
Any |
|
SUMX |
Sum. |
Any |
|
SUMX2 |
Sum of Squares. |
Any |
|
SUMZ |
Sum Sgrp Sizes (sum of subgroup sizes). |
Any |
|
SIZEN |
Subgroup Size. |
Any |
|
Q1 |
Quartile 25%. |
Any |
|
MEDIAN |
Median. |
Any |
|
Q3 |
Quartile 75%. |
Any |
|
AVEMEANS |
X Dbl Bar (X double bar). |
Any |
|
AVEVARS |
R Bar. |
Variables |
|
CP |
Cp. |
Variables |
|
CPK |
Cpk. |
Variables |
|
CPL |
Cpl. |
Variables |
|
CPU |
Cpu. |
Variables |
|
CPK90 |
Cpk @ 90%. |
Variables |
|
PCSPEC |
Cr. |
Variables |
|
PCLOWER |
Est % Below Spec (estimated percent below specification). |
Variables |
|
PCUPPER |
Est % Above Spec (estimated percent above specification). |
Variables |
|
PCTOTAL |
Est % Total (estimated percent total). |
Variables |
|
SUMDEF |
Sum Defects. |
Defects |
|
DEFPH |
Defects/100. |
Defects |
|
DEFPT |
Defects/1000. |
Defects |
|
DEFPM |
Defects/Mil. |
Defects |
|
DEFPU |
Defects/Unit. |
Defects |
|
LSL |
LSL. |
Any |
|
USL |
USL. |
Any |
|
FACT1 |
Factor 1. |
Any |
|
FACT2 |
Factor 2. |
Any |
|
TRANS |
Transform. |
Any |