Using the Supplier Watch List With the PeopleSoft Fluid User Interface
|
Page Name |
Definition Name |
Usage |
|---|---|---|
|
PO_SWL_WATCH_FL |
View list of Suppliers on the watch. Add or remove Suppliers. View event exceptions for the Suppliers. |
|
|
Open Requisitions Page |
PO_SWL_RQTOPO_FL |
View list of Requisitions that have open amount based on the specified threshold for selected Supplier. |
|
Pending PO Details Page |
PO_SWL_CH_ND_PA_FL |
View listing of Purchase Orders that are pending approval based on specified threshold for selected Supplier. |
|
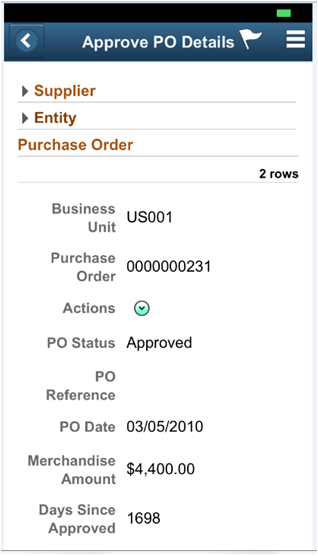
Approve PO Details Page |
PO_SWL_CH_ND_A_FL |
View listing of approved Purchase Orders that are not dispatched based on specified threshold for selected Supplier. |
|
Business Unit Spend Page |
PO_SWL_BU_BO_FL |
View Business Unit Amount for overdue Purchase Orders. |
|
Backorder Volume Details Page |
PO_SWL_BO_DTL_FL |
View listing of overdue Purchase Orders for selected Business Unit. |
|
Business Unit Spend Page |
PO_SWL_BU_NOEDI_FL |
View Business Unit Amount for Non EDI Purchase Orders. |
|
Non EDI Volume Details Page |
PO_SWL_NEDI_DTL_FL |
View listing of Non EDI Purchase Orders for selected Business Unit. |
|
Expiring Contracts Page |
PO_SWL_CNT_EXP_FL |
View listing of Contracts that are due to expire based on specified threshold for selected Supplier. |
|
Business Unit Spend Page |
PO_SWL_BU_NC_FL |
View Business Unit Amount for Non Contract Purchase Orders. |
|
Non Contract Spend Page |
PO_SWL_CNT_PVG_FL |
View Purchase Orders with Non Contract Spend for selected Business Unit in a Pivot Grid. |
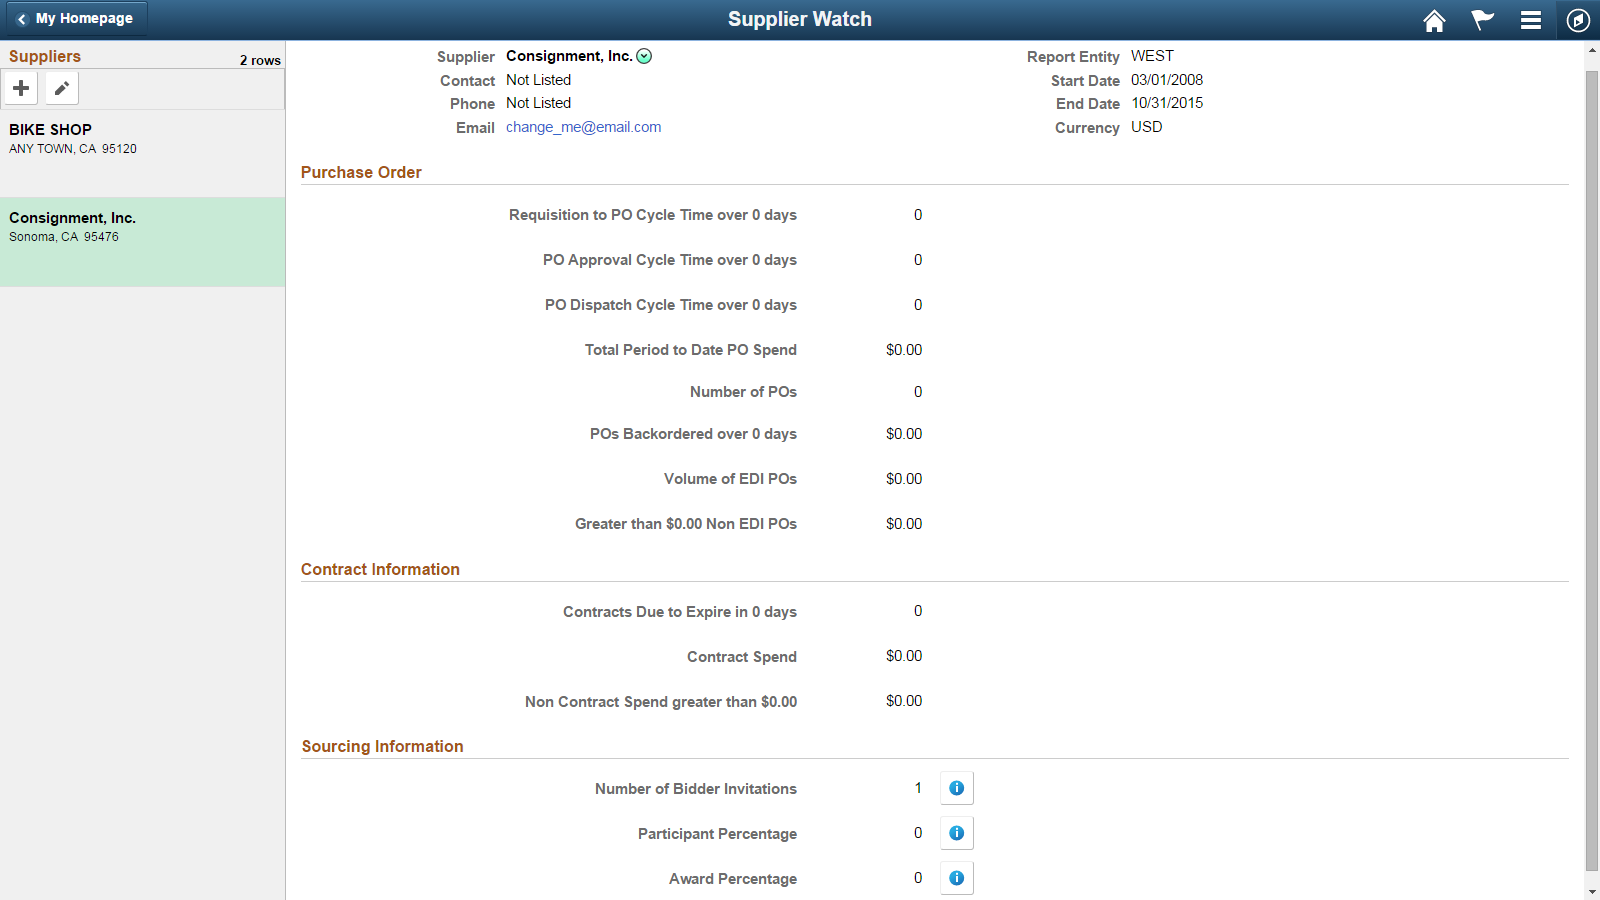
Use this page to view a list of suppliers from the watch list, add or remove suppliers, and view supplier event data.
Navigation:
This example illustrates the fields and controls on the Supplier Watch List. You can find definitions for the fields and controls later on this page.
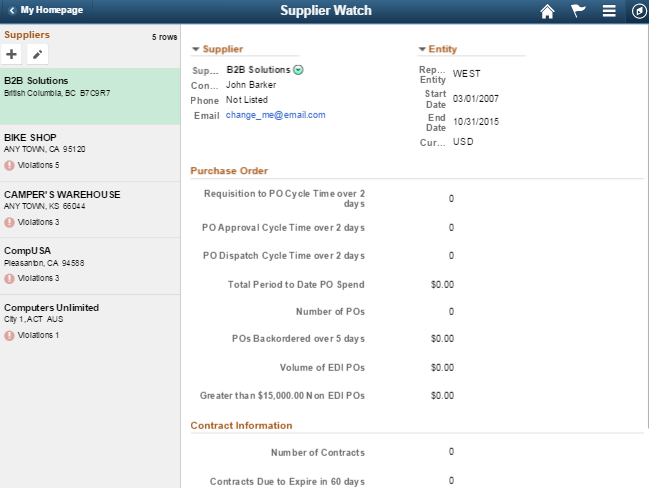
This page displays a list of suppliers and their respective event data. You can select more than one supplier to get the event data. Violations and warnings are shown depending on certain pre-set conditions as defined by the user or reporting entity. For threshold of 'Days', one or more transaction matching pre-set condition at admin level will show as Violation. If one or more transaction match only user level pre-set condition then it will show as Warning. The system displays the total count of violations and warnings on the left panel against each Supplier.
Note: For amounts, if any business unit amount exceeds reporting entity setup, then it is shown as a violation. If business unit amount only exceeds user -threshold then it is shown as warning.
Supplier Watch List displays list of watched Suppliers on the left. One or more Suppliers can be added or deleted using the buttons on the top of the list. Event threshold violation or warning is indicated next to the event on right. Select this indicator to go to Business Unit level or transaction level information depending on the event selected. A total count of violations and warnings is displayed on the left along with Supplier name.
Select a different Supplier on left to monitor the Supplier event information.
Field or Control |
Description |
|---|---|
|
Select to add one or more Suppliers to watch list. Opens a Search window, where Supplier name can be entered as search criteria. Shows list of Suppliers that match criteria. Multiple Suppliers can be selected. Suppliers are added to end of the list. |
|
Select to enter edit mode. Edit mode allows you to select one or more Suppliers for deletion from list. |
|
Indicates Reporting Entity threshold violation for event. Select to drill down to Business Unit or Transaction level information depending on event. |
|
Indicates user level threshold violation (warning) for event. Select to drill down to Business Unit or Transaction level information depending on the event. |
|
Select ‘My Preference’ to go to user preferences specific to the tile user is on. |


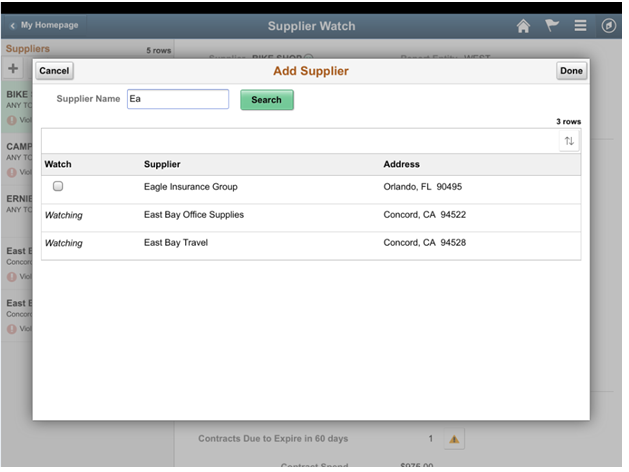
Adding Suppliers
Select on the‘+’ button to add Supplier to the Supplier Watch List. The pop up window gives you the option to Search on Supplier name and selects one or more Suppliers. Selecting Done will add the Supplier to the Supplier Watch List. Selecting Cancel would not add Suppliers to the list. Watchingis displayed for Suppliers that are already in the list and cannot be selected.
This example illustrates the fields and controls on the Supplier Watch List — Add Supplier Page. You can find definitions for the fields and controls later on this page.
Editing Suppliers
Supplier Watch List Edit mode can be used to remove one or more Suppliers from the Watch List.
Field or Control |
Description |
|---|---|
|
Select to cancel out of edit mode. Only displayed when in edit mode. |
|
Displayed when one or more Suppliers are selected (for deletion). Shows count of Suppliers selected. Select to delete selected Suppliers from list. |


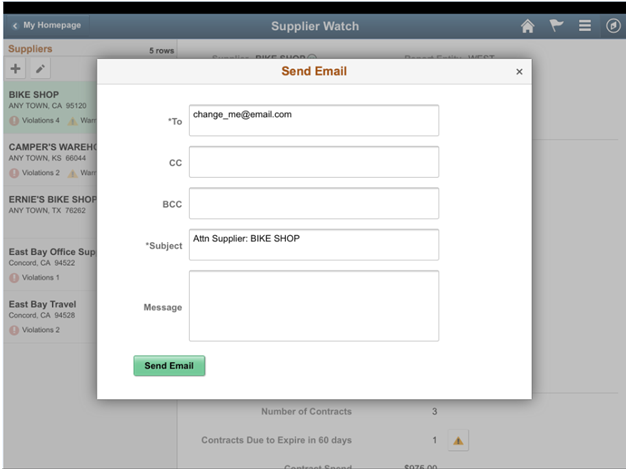
Notifying Suppliers
Select related action menu next to Supplier name on right and select the ‘Notify’ action for the notification pop up. Use the notification window to send email to Supplier or any employee. Supplier name is defaulted in the subject area. Supplier contact email is defaulted into ‘To’ list.
This example illustrates the fields and controls on the Supplier Watch List — Send Email Page. You can find definitions for the fields and controls later on this page.
Using Sourcing Information
Use the Sourcing Information parameters to monitor supplier or bidder performance. These sourcing parameters are based on the settings configured in Procurement User Preferences – Supplier Watch List Page, and Configuring Thresholds and Events for Procurement Operations Page.
This example illustrates the fields and controls on the Supplier Watch – Sourcing Information section. You can find definitions for the fields and controls later on this page.
Field or Control |
Description |
|---|---|
Number of Bidder Invitations |
Displays the count of the bidders specifically requested to participate in the Sourcing event. Click on the icon next to Number of Bidder Invitations to view the event details by Business units, and Invitation details. |
Participation Percentage |
Displays the Participation percentage of the bidders. This parameter indicates how many bidders responded to a Sourcing Event. Click on the icon next to Participation Percentage to view the event details by Business units, and bidder Participation details. |
Award Percentage |
Displays the Award percentage of the bidder for the event they participated. Click on the icon next to Award Percentage to view the event details by Business units, and Event Awarded details. |
Using the My Analytics (Related Information) Panel
Simplified Analytics in the Supplier Watch List enable users to compare metrics among Suppliers on their Watch List (All Suppliers or just one Supplier). With Simplified Analytics, users can create, customize and save analytic reports, and drill down detail information related to a Supplier.
Simplified Analytics enables:
End users of a fluid application page to create contextual analytic reports. They can create their own reports based on the pre-defined templates by selecting the fields, filling the prompt fields, defining the layout, and selecting different types of visualizations.
Administrator or super user to create and publish reports (based on the configured base templates) to all users of the component.
End users to add a saved analytic report to home page and view later.
Note: To enable Simplified Analytics for a component, application developers or business administrators have to associate one or more Pivot Grid models (or base templates) to a component. They can also map page fields to the prompts that are associated with the template model to define the required context.
The Simplified Analytics feature is only available for fluid components in PeopleTools 8.55 and this feature must be enabled for fluid components before users can use the Simplified Analytics Wizard to create and view analytic reports. For more information, see the section Enabling/Disabling Simplified Analytics in Supplier Watch List.
The following Simplified Analytics are available on the Supplier Watch List:
|
Simplified Analytic Name |
Pivot Grid Model Name |
Usage |
|---|---|---|
|
Backorder by Supplier |
PO_SPND_BACKORD_SEL_SA_FL |
Enables a user to evaluate backorder amount for one supplier or compare one supplier against another supplier. Note: You must run the Update Spend History process to populate data for Supplier Backorder Analytics. For more information, see Understanding the Spend History Application Engine Process (PO_SPND_HIST) |
|
On-Time Delivery Performance |
PO_ONTIME_PERFORMANCE_SA_FL |
Enables a user to evaluate performance for one supplier or compare one supplier against another supplier. Note: You must run the Update Procurement Info process to update performance metrics for supplier performance. See Understanding the Procurement History Update Application Engine Process (FS_PRCRUPD) |
|
Overdue PO Acknowledgements |
PO_NOPOA_HOURS_SA_FL |
Enables a user to evaluate acknowledgements for one supplier or compare one supplier against another supplier. |
Enabling/Disabling Simplified Analytics in Supplier Watch List
For Simplified Analytics, pivot grids must be assigned to a component. A pivot grid attached to a component forms the base of a Simplified Analytic.
Use the Assign Related Content (PTCS_SERVICECFG) page to enable/disable Simplified Analytics in the Supplier Watch List.
Navigation:
Search for Supplier Watch List, and then click Edit. Verify if the Enable check box is selected for the Simplified Analytics.
Select/Deselect the Enable check box to enable/disable Simplified Analytics.
When Simplified Analytics is assigned to a component and enabled, the My Analytics panel displays in the right side of the component.
This example illustrates the fields and controls on the My Analytics Panel as displayed on a tablet. You can find definitions for the fields and controls later on this page.
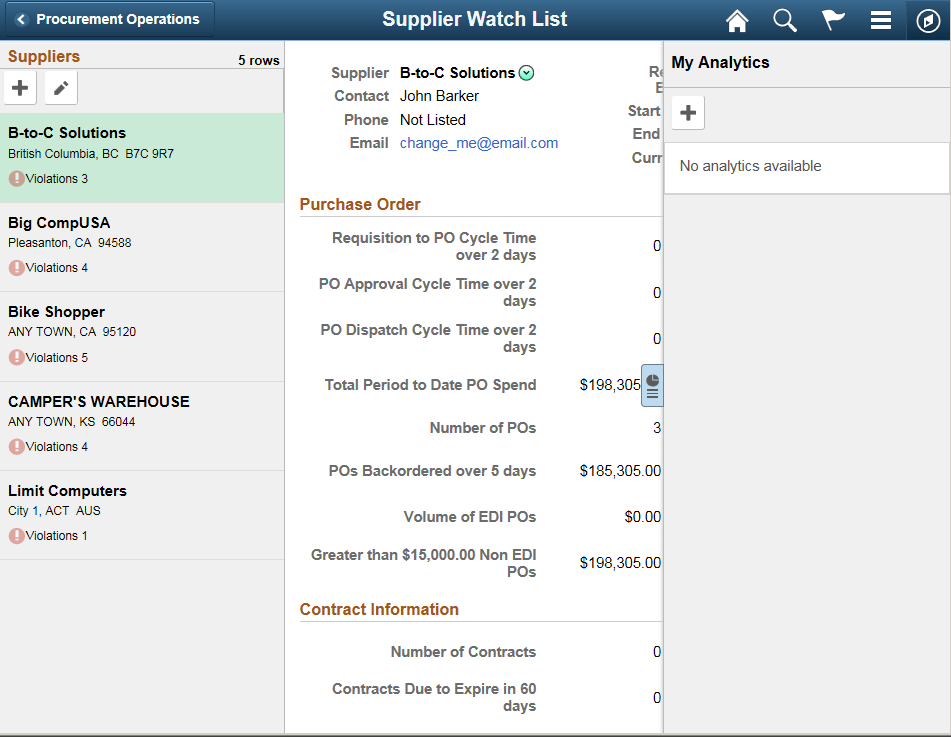
Use the My Analytics panel to create, edit, or view the analytic reports in the Supplier Watch List.
Create Analytics Wizard - Step 1
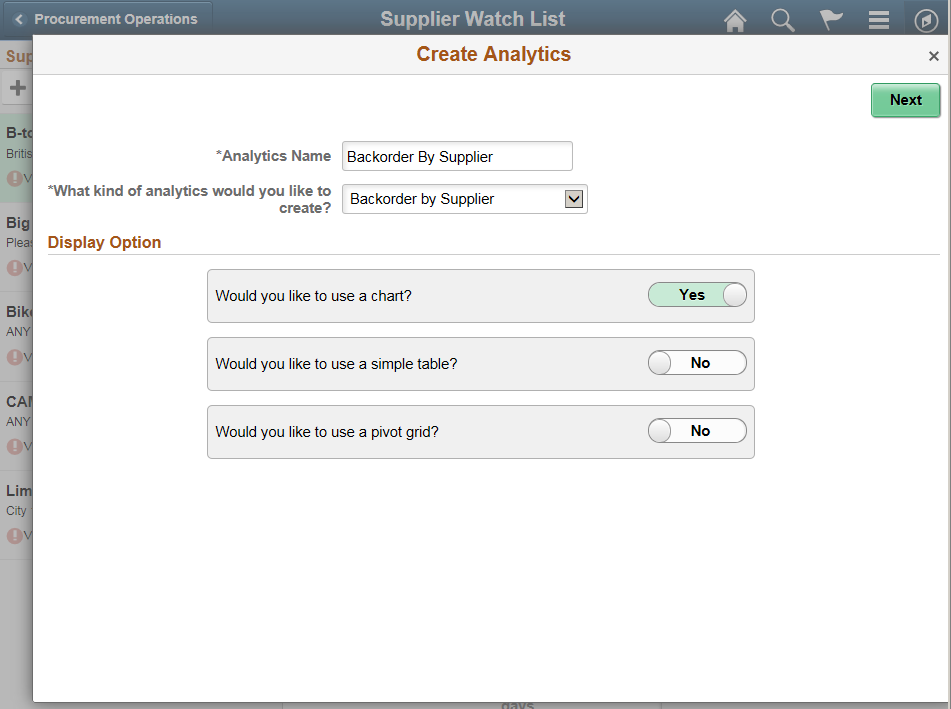
Use the Create Analytics Wizard - step 1 to specify the names of the analytic reports, select the analytic report template and select the display options that will be used to create the analytic report.
This example illustrates how to create an analytic report for Backorder by Supplier. You can follow these steps to create other analytic reports such as On-Time Delivery Performance and Overdue PO Acknowledgements.
Navigation:
Select the + button to create a new Analytic.
This example illustrates the fields and controls on the Backorder by Supplier as displayed on a tablet. You can find definitions for the fields and controls later on this page.
Field or Control |
Description |
|---|---|
Analytics Name |
Enter a name for the analytic report. |
What kind of analytics would you like to create? |
Displays the available analytic templates that are used to create the analytic report. The template you select from this list determines the fields and prompts in the next step of the wizard, Create Analytics - step 2. Note: This drop-down list is not available when only one template is available. |
Display Option |
Define the display options for the analytic reports. The following display options are available; you can use different combinations of these display options:
|
Next |
Click to advance the wizard to the next page. |
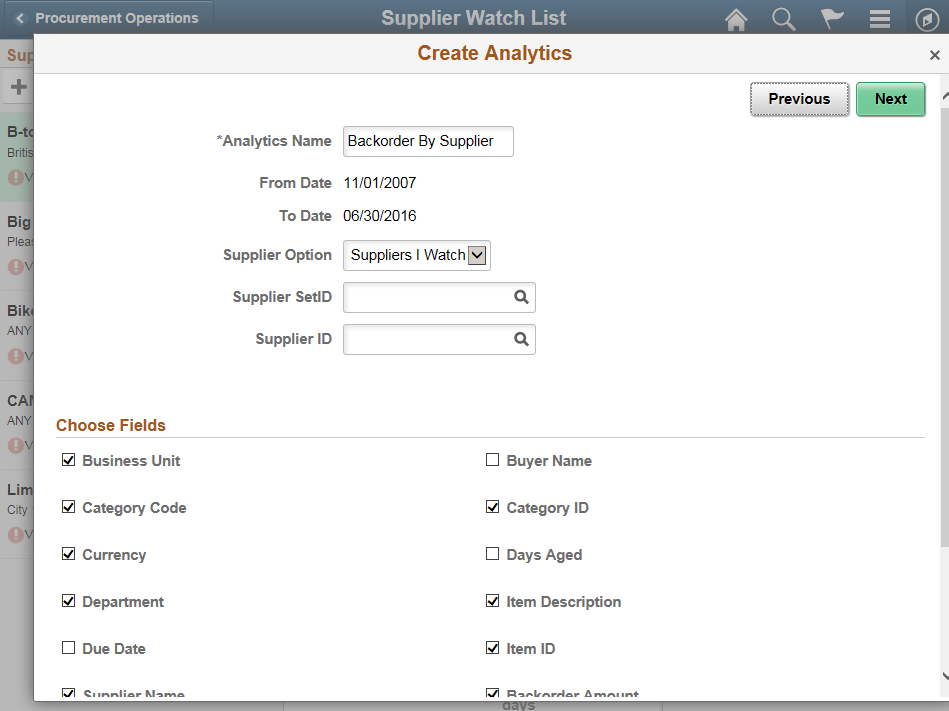
Create Analytics Wizard - Step 2
Use the Create Analytics Wizard - step 2 to select the fields for the analytic reports and to change the default values of the prompt fields.
Navigation:
From the Create Analytics Wizard - step 1, click the Next button.
This example illustrates the fields and controls on the Create Analytics Wizard - Step 2 as displayed on a tablet (Backorder by Supplier). You can find definitions for the fields and controls later on this page.
Field or Control |
Description |
|---|---|
From Date, To Date |
In this example, the From Date and To Date fields appear based on the parameters set in the Related Content configuration. These prompts are defined in the Pivot Grid based template model. Note: The date-fields are read-only because the value for this field is implicitly passed from the transaction page because of the related content configuration. |
Supplier Option |
Select an option to display metrics for Suppliers only on the Watch List, or All Suppliers, or for a Supplier for a specified Supplier Id. |
Choose Fields |
Use this section to select the fields that will appear in the analytic reports. Some fields are preselected because those fields form a part of rows/columns/axis/filters in the base template model. |
Previous |
Click to go back to the Create Analytics Wizard - step 1. |
Next |
Click to advance the wizard to the next page, where you can preview the display of the analytic reports. |
Create Analytics Wizard - Step 3
Use the Create Analytics Wizard - step 3 to preview the analytic reports based on the display options, fields, and prompts selected in the previous steps of the wizard. Optionally, you can modify (by dragging and dropping, applying filters, and so on) the analytic reports to finalize the design and then click the Save button to save the final report.
Navigation:
From the Create Analytics Wizard - step 2, click the Next button.
This example illustrates the fields and controls on the Create Analytics Wizard - Step 3 as displayed on a tablet (Backorder by Supplier). You can find definitions for the fields and controls later on this page.
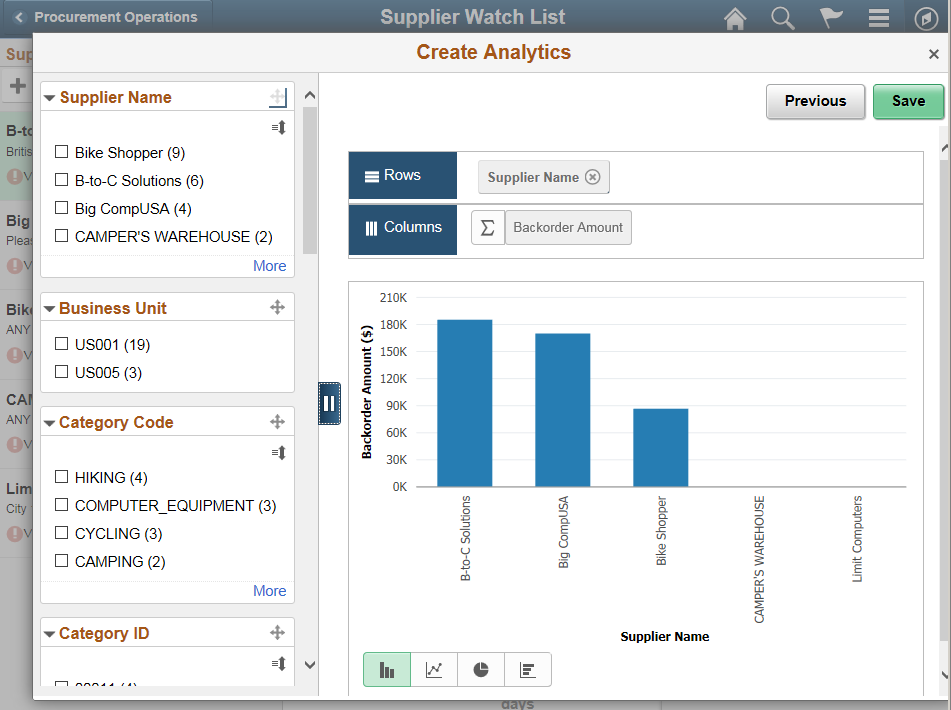
From the preview window, use the Save button to save the analytic report.
On saving the analytic report, the Add to Homepage button is enabled which you can use to add the analytic report to the fluid homepage. For more information, see Adding Analytic Reports to the Fluid Homepage section in PeopleTools: Pivot Grid
If you are an administrator or super user, saving the analytic report enables the Publish Options button which you can use to publish the analytic reports to the My Analytics section or the Tile repository of all users of the component. For more information, see Publishing the Analytic Report section in PeopleTools: Pivot Grid
Note: The buttons Add to Homepage and Publish Options are displayed only when you view the analytic report on a tablet, Laptop or a large monitor. These buttons are not displayed on a smartphone.
Follow the same steps to create analytic reports for On-Time Delivery Performance and Overdue PO Acknowledgements.
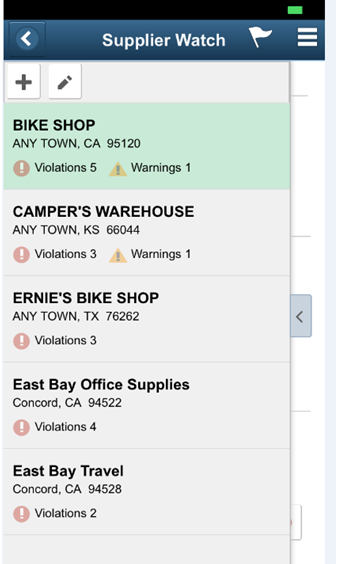
Supplier Watch List – small form factor
In small form factor Supplier list becomes an overlay. When a Supplier is selected, list is dismissed to the left to display event information. Tab must be tapped to bring back Supplier list and select another Supplier.
This example illustrates the fields and controls on the Supplier Watch List – small form factor. You can find definitions for the fields and controls later on this page.
This example illustrates the fields and controls on the Supplier Watch List — small form factor (Page 2of 2). You can find definitions for the fields and controls later on this page.
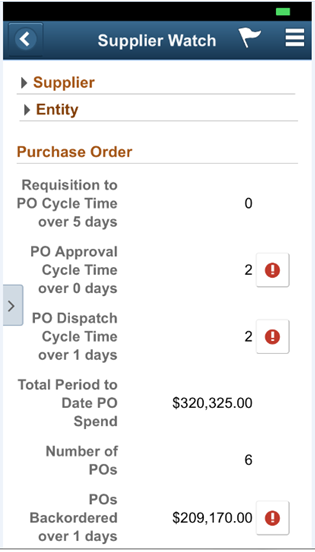
Note: Detail information is shown as list view in small form factor so that user does not need to keep scrolling left and right to view information.
This example illustrates the fields and controls on the Approve PO Details — small form factor Page. You can find definitions for the fields and controls later on this page.