Generating and Viewing PeopleSoft eProcurement Information
This section discusses how to generate and view PeopleSoft eProcurement information.
In addition to the standard reports and inquiries that PeopleSoft applications provide, PeopleSoft eProcurement provides transactional analysis graphs. These graphs can be displayed as bar graphs, pie charts, line graphs, or histograms. These graphs enable you to view information about PeopleSoft eProcurement requisition and purchase order transactions. Four graphs are delivered with PeopleSoft eProcurement:
Field or Control |
Description |
|---|---|
PO Status Analysis |
Provides information about the current state of purchase orders by displaying the number of purchase orders in each purchase order status. |
PO Value Analysis |
Provides information about the total purchase order costs by item category or ship-to location. |
Requisition Status Analysis |
Provides information about the current state of the requisitions by displaying the number of requisitions in each requisition status. |
Supplier Analysis by Categories |
Provides information about total quantities and amounts received from suppliers. |
PO Status Analysis Graph
This graph displays the number of purchase orders that are currently in each purchase order status. The graph displays information for only one PeopleSoft Purchasing business unit at a time. Within the business unit, you can further limit the purchase orders that appear to one supplier and one buyer.
This example illustrates the fields and controls on the PO Status Analysis three-dimensional bar graph generated in PeopleSoft eProcurement.

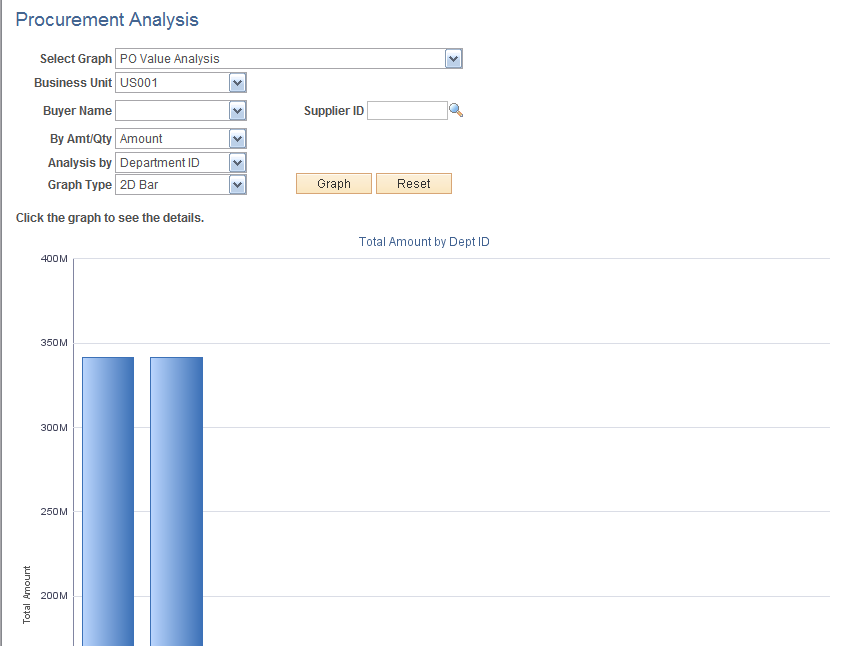
PO Value Analysis Graph
This graph displays the total monetary amount of the purchase orders. This information can be processed by item category (using the purchase order line level), Ship To code, Location code, or Department ID (using the purchase order distribution line level). The method is noted at the top of the graph. The graph displays information for only one PeopleSoft Purchasing business unit at a time. Within the business unit, you can further limit the purchase orders that appear to one supplier and one buyer.
This example illustrates the fields and controls on the PO Value Analysis two-dimensional bar graph generated in PeopleSoft eProcurement.
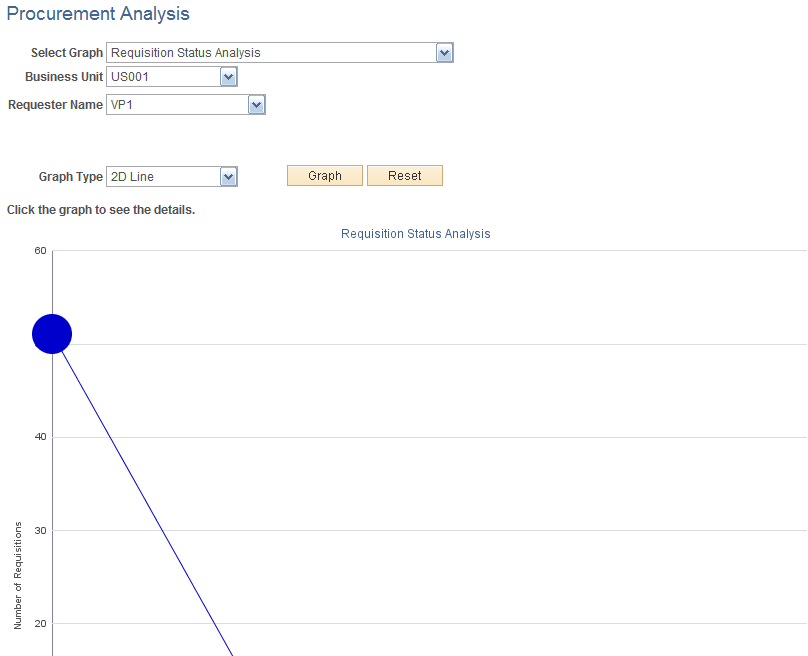
Requisition Status Analysis Graph
This graph displays the number of requisitions that are currently in each requisition status. The graph displays information for only one PeopleSoft Purchasing business unit at a time. Within the business unit, you can further limit the requisitions that appear to one requester.
This example illustrates the fields and controls on the Requisition Status Analysis line graph generated in PeopleSoft eProcurement.
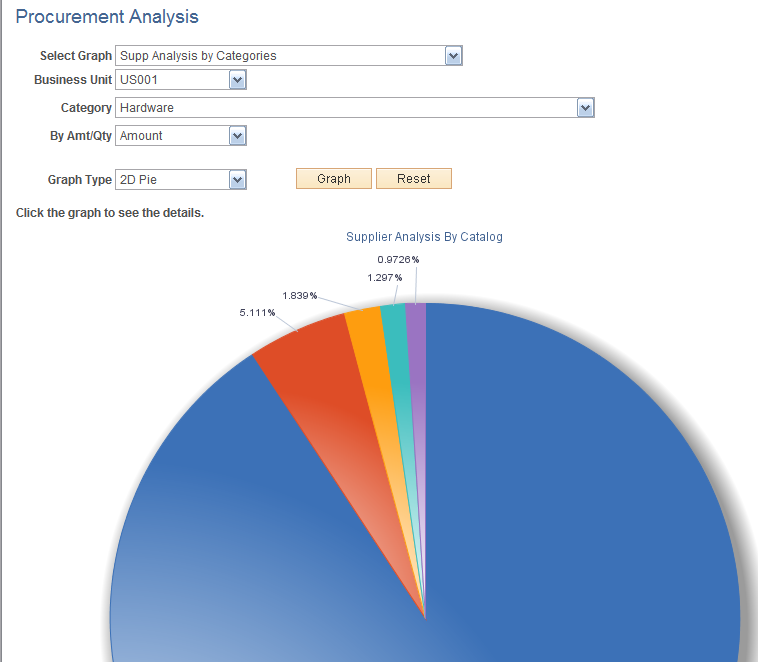
Supplier Analysis by Categories Graph
This graph displays the quantity or amount of goods that a supplier supplies to a business unit for a specific category using the Supplier Analysis by Categories graph. The system totals the monetary value to arrive at an amount value from each supplier or it totals the number of units to arrive at a quantity from each supplier.
This example illustrates the fields and controls on the Supplier Analysis by Categories two-dimensional pie chart generated by PeopleSoft eProcurement.
|
Page Name |
Definition Name |
Usage |
|---|---|---|
|
PV_GRAPH_MAIN |
Generate and view PeopleSoft eProcurement information in transactional analysis graphs using requisition and purchase order information. |
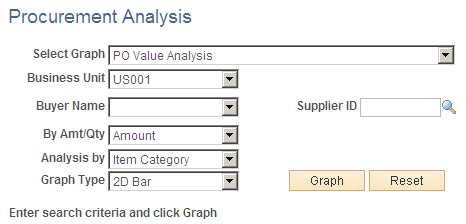
Use the Procurement Analysis page (PV_GRAPH_MAIN) to generate and view PeopleSoft eProcurement information in transactional analysis graphs using requisition and purchase order information.
Navigation:
This example illustrates the fields and controls on the Procurement Analysis page. You can find definitions for the fields and controls later on this page.
Field or Control |
Description |
|---|---|
Select Graph |
Select one of the four delivered graphs. |
Business Unit |
The PeopleSoft Purchasing business unit containing the requisitions or purchase orders that are used to build the graph. The system uses the business unit that is specified on the User Preferences - Overall Preferences page as the default. |
Supplier ID |
Select a supplier ID to restrict the graph information to one supplier. This field does not appear if you selected the Req. Status Analysis graph option. |
Buyer Name |
Select a buyer name to restrict the graph information to one buyer. The buyers are those that are authorized for the user ID on the User Preferences - Procurement Page: Purchase Order Authorizations page. This field does not appear if you selected the Req. Status Analysis option. |
By Amt/Qty (by amount or quantity) |
Determine if you want the graph to sort by amount or quantity. |
Analysis By |
Select how you wish to sort the analysis.
|
Graph Type |
Select the type of graph used to display the results. |
Graph |
Click to generate the transactional analysis graph. |
Reset |
Click to delete the entries on this page. Then you can enter new criteria for generating the next graph. |