Working with Cash Forecasting on the PeopleSoft Fluid User Interface
This topic discusses using the PeopleSoft Fluid User Interface to work with cash forecasting. Access cash position information through the Cash Forecast tile on the Cash Management homepage.
Click to watch a short video about the PeopleSoft Cash Management Homepage on the PeopleSoft Fluid User Interface.
|
Page/Tile Name |
Definition Name |
Usage |
|---|---|---|
|
EP_TR_CASH_POS_FL |
View the overall cash position bar chart for the first seven periods. Access cash position information, including a summary, currencies, banks, bank accounts, bank account groups, business unit groups, and business units. |
|
|
TR_USER_PREF_FL |
Set up user preferences for the Available vs Forecast Balance and Cash Forecast tiles and pages. |
|
|
TR_LIQ_OVERALL_FL |
Review the overall cash position information. |
|
|
TR_CF_DRILL_SCF |
Review transaction details by payment date and line item. |
|
|
TR_LIQ_CUR_FL |
Review cash forecast amounts by currency. |
|
|
TR_LIQ_ACGRP_FL |
Review the cash position by each bank account group. |
|
|
TR_LIQ_BNK_FL |
Review the cash position by bank. |
|
|
TR_LIQ_BAC_FL |
Review the cash position by bank account. |
|
|
TR_LIQ_BGR_FL |
Review the cash position by each business unit group. |
|
|
TR_LIQ_BU_FL |
Review the cash position by business unit. |
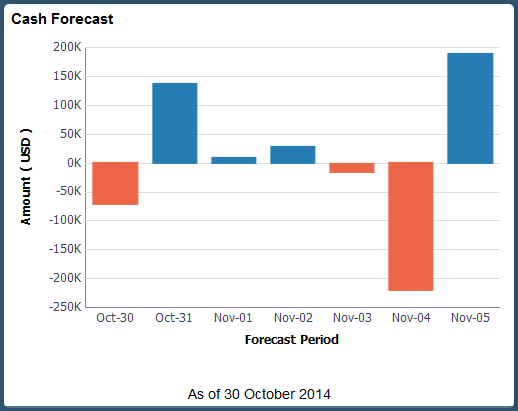
Use the Cash Forecast tile (EP_TR_CASH_POS_FL) to access cash position details, including a summary, currencies, banks, bank accounts, bank account groups, business unit groups, and business units.
Navigation:
View the tile on the Cash Management homepage.
This example illustrates the fields and controls on the Cash Forecast tile.
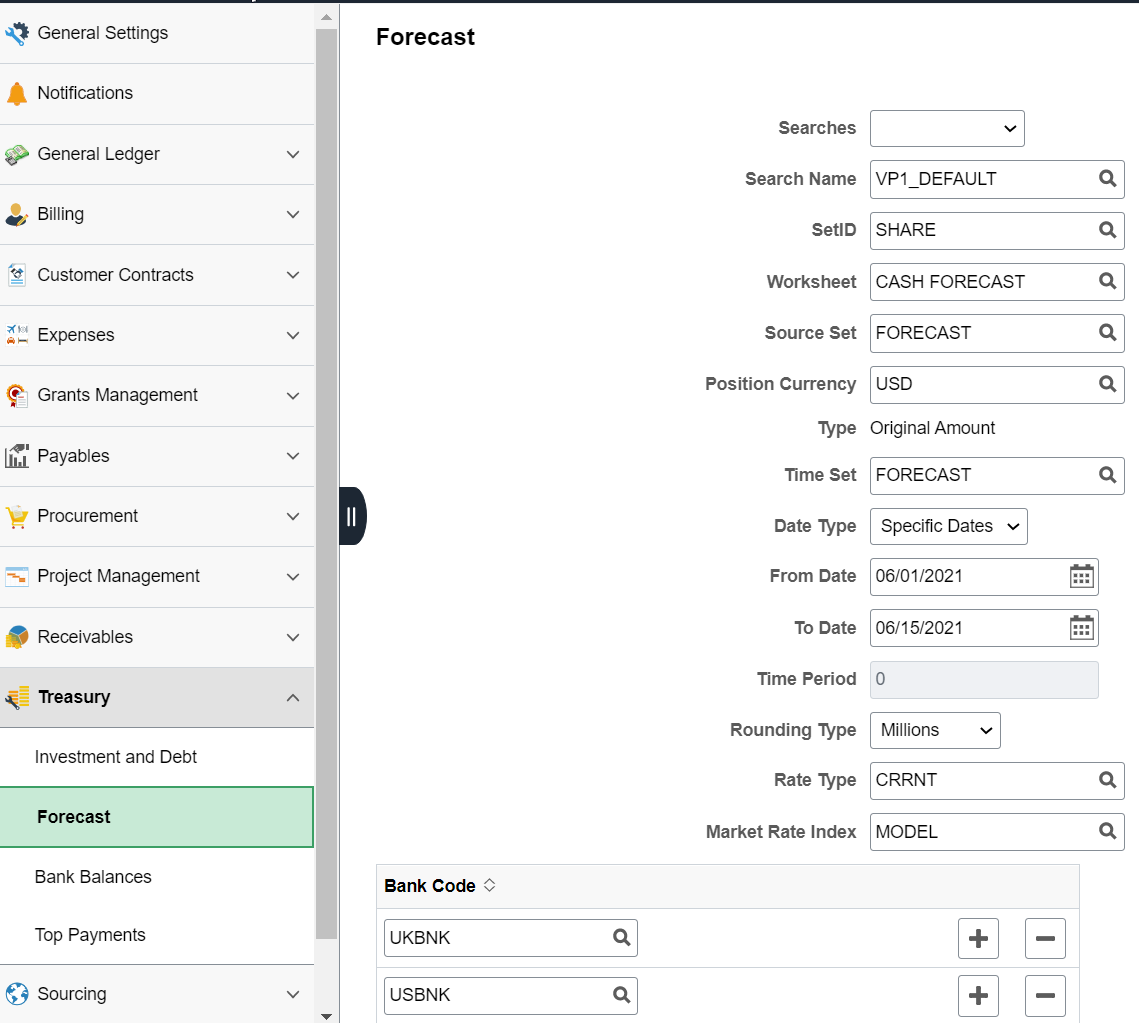
Use the My Preferences - Forecast page (TR_USER_PREF_FL) to set up user preferences for the Available vs Forecast Balance and Cash Forecast tiles and pages.
Navigation:
From any Fluid homepage, select the Actions List button, then select My Preferences. Select Treasury in the left panel and select the Forecast link.
On the Cash Management homepage, select the Cash Forecast tile. Select the Actions List button, then select My Preferences from the list.
This example illustrates the fields and controls on the Fluid My Preferences - Forecast page. You can find definitions for the fields and controls later on this page.
Field or Control |
Description |
|---|---|
|
Searches |
Select an option to create a search or delete an existing search. The available options are:
|
|
Search Name |
Enter a new search name or select a saved search name by clicking the prompt. You can select a saved search and add/ modify the search criteria. |
SetID |
Enter a SetID. |
Worksheet |
Enter a worksheet defined during cash forecasting setup. |
Source Set |
Enter a category for grouping position source data that you defined on the Position Source Set page. |
Position Currency |
Enter a reporting currency defined on the Worksheet Definition page during cash forecasting setup. |
Type |
Displays Original Amount. |
Time Set |
Enter the time interval defined to display cash forecasting results on the Define Time Sets page. |
|
Date Type |
Select a date type. The available options are:
|
|
From Date and To Date |
Enter the dates. The From Date and To Date fields are enabled only when Date Type option is Specific Dates. |
Time Period |
Enter a time period. The Time Period field is enabled only when Date Type option is Relative Dates. |
Rounding Type |
Select from Billions, Millions, or Thousands. |
Rate Type |
Enter the market rate type. |
Market Rate Index |
Enter the market rate index. |
Bank Code |
Enter up to four reporting banks. Up to four reporting banks can be set up for a Worksheet. |
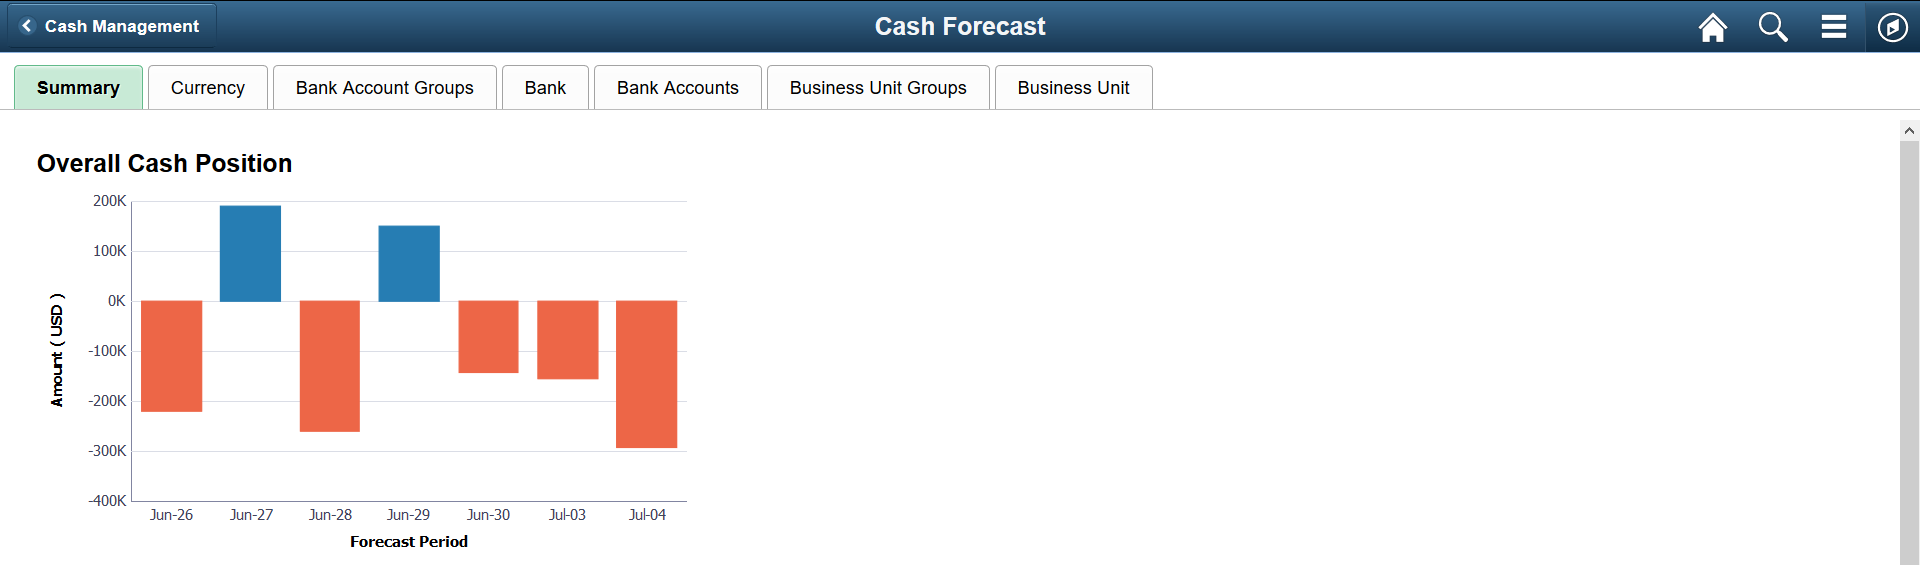
Use the Cash Forecast - Summary page (TR_LIQ_OVERALL_FL) to review the overall cash position information.
Navigation:
Select the Cash Forecast tile on the Cash Management homepage.
This example illustrates the fields and controls on the Cash Forecast - Summary page (1 of 2) in the PeopleSoft Fluid User Interface. You can find definitions for the fields and controls later on this page.
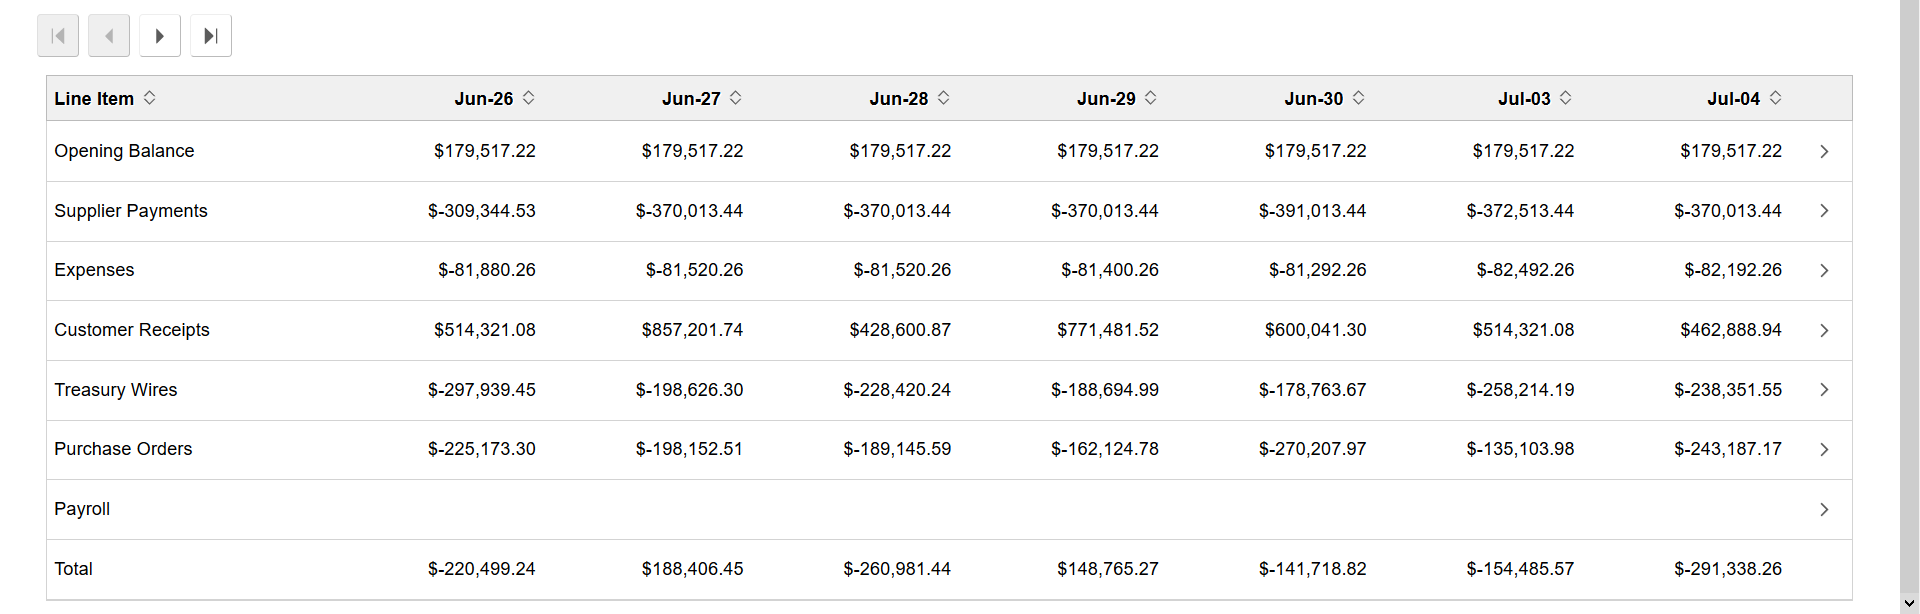
This example illustrates the fields and controls on the Cash Forecast - Summary page (2 of 2) in the PeopleSoft Fluid User Interface. You can find definitions for the fields and controls later on this page.
The Overall Cash Position bar chart provides this information:
Field or Control |
Description |
|---|---|
Forecast Period |
View the first seven time periods on the x-axis. Use the scroll buttons above the table to navigate among time periods. Populate the next seven time periods by selecting the right arrow scroll button. |
Amount |
View amounts on the y-axis, in the currency selected on the My Preferences - Cash Forecast page. |
The Overall Cash Position table displays line item amounts by date and a total for each date.
Field or Control |
Description |
|---|---|
Line Item |
View the worksheet line items for each time period and a total for each day. Use the scroll buttons above the table to navigate among time periods. Populate the next seven time periods by selecting the Scroll Right button. Select the line item row to open the Cash Forecast Drilldown page, where you can review details of the overall cash position by line item and date. |
Total |
View the total line item amounts for each date in the last row. |
Use the Cash Forecast Drilldown page (TR_CF_DRILL_SCF) to review transaction details by payment date and line item.
Navigation:
Select a line item row in the table on any tab of the Cash Forecast page.
Select the line item links by date in the left panel of the drilldown page to review the transaction data without navigating back to main page.
You can drill into line items by date on these pages: Summary (Overall Cash Position), Currency, Bank Account Groups, Bank, Bank Accounts, Business Unit Groups, and Business Unit.
This example illustrates the fields and controls on the Fluid Cash Forecast Drilldown page. You can find definitions for the fields and controls later on this page.
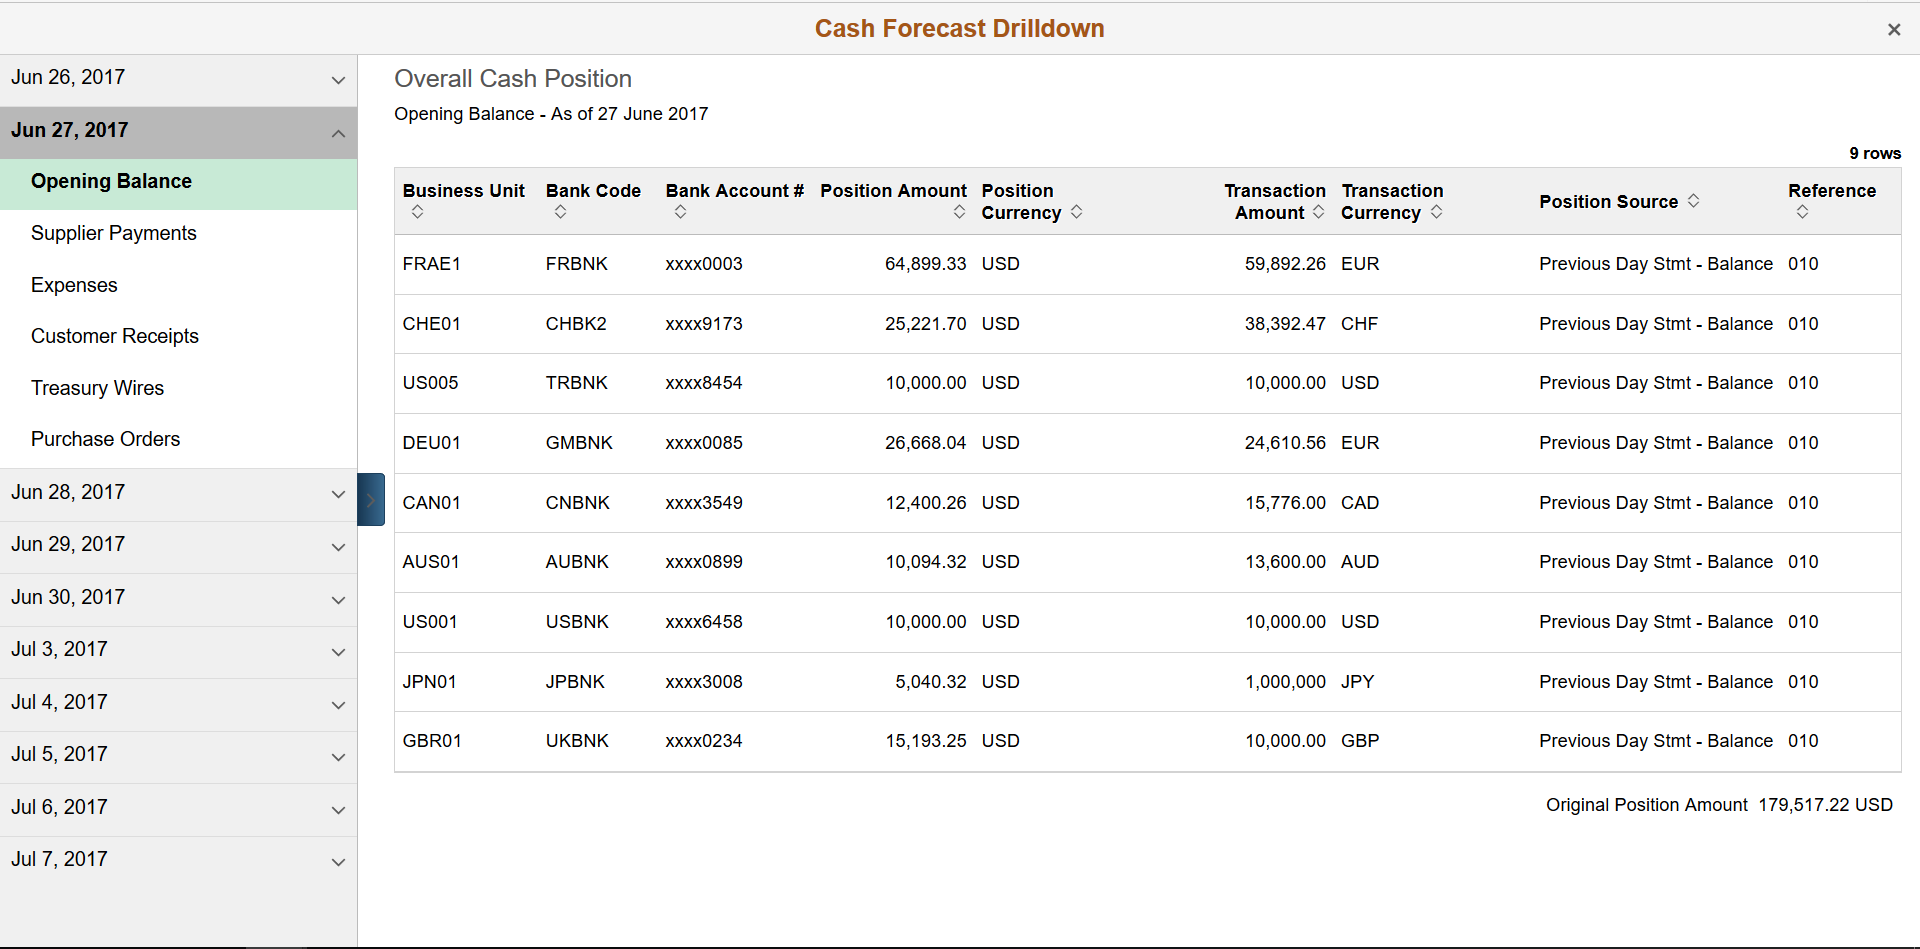
Date and Transaction List
Expand a date in the left panel to view the line items for that date. Click the line item to view the corresponding transaction details in the table in the contents window.
Drilldown Details Table
View payment details for transactions in the line item. Payment details include business unit, bank code, bank account number, position amount and currency, transaction amount and currency, position source, and reference code. You can sort by column.
The original position amount from the Cash Forecast page appears below the table.
Use the Cash Forecast - Currency page (TR_LIQ_CUR_FL) to review cash forecast amounts by currency.
Navigation:
Select the Cash Forecast tile on the Cash Management homepage. Select the Currency tab.
This example illustrates the fields and controls on the Fluid Cash Forecast - Currency page. You can find definitions for the fields and controls later on this page.
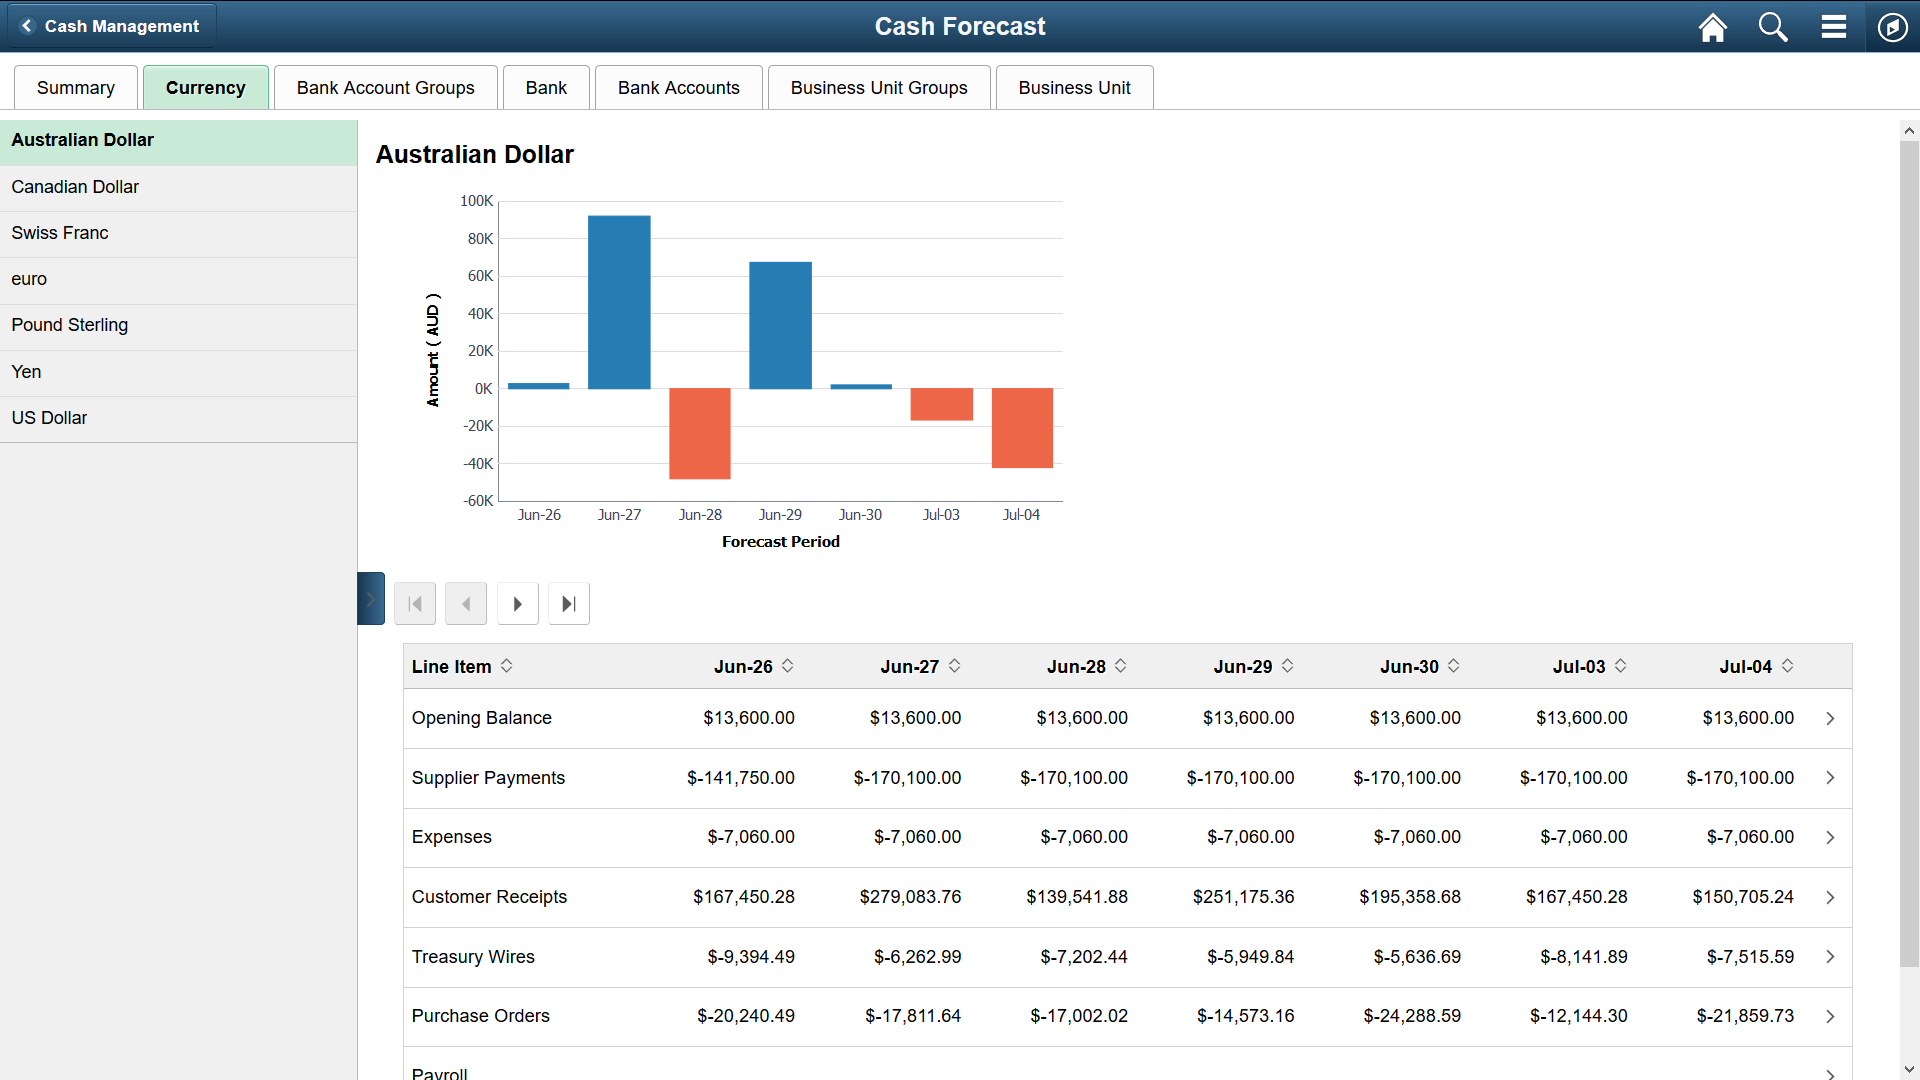
The left pane displays the different currencies of transactions made for the timeframe shown. Select currencies on the left side to see the details of transactions for each currency in the bar chart and table in the content pane.
The Currency bar chart provides these fields:
Field or Control |
Description |
|---|---|
Forecast Period |
View the first seven time periods on the x-axis. Use the scroll buttons above the table to navigate among time periods. Populate the next seven time periods by selecting the right arrow scroll button. |
Amount |
View amounts on the y-axis, in the currency selected on the My Preferences - Cash Forecast page. |
The Currency table provides these fields:
Field or Control |
Description |
|---|---|
Line Item |
View the worksheet line items for each time period and a total for each day. Use the scroll buttons above the table to navigate among time periods. Populate the next seven time periods by selecting the right arrow scroll button. |
Total |
View the total line item amounts for each date in the last row. |
Use the Cash Forecast - Bank Account Groups page (TR_LIQ_ACGRP_FL) to review the cash position by each bank account group.
Navigation:
Select the Cash Forecast tile on the Cash Management homepage. Select the Bank Account Groups tab.
This example illustrates the fields and controls on the Fluid Cash Forecast - Bank Account Groups page. You can find definitions for the fields and controls later on this page.
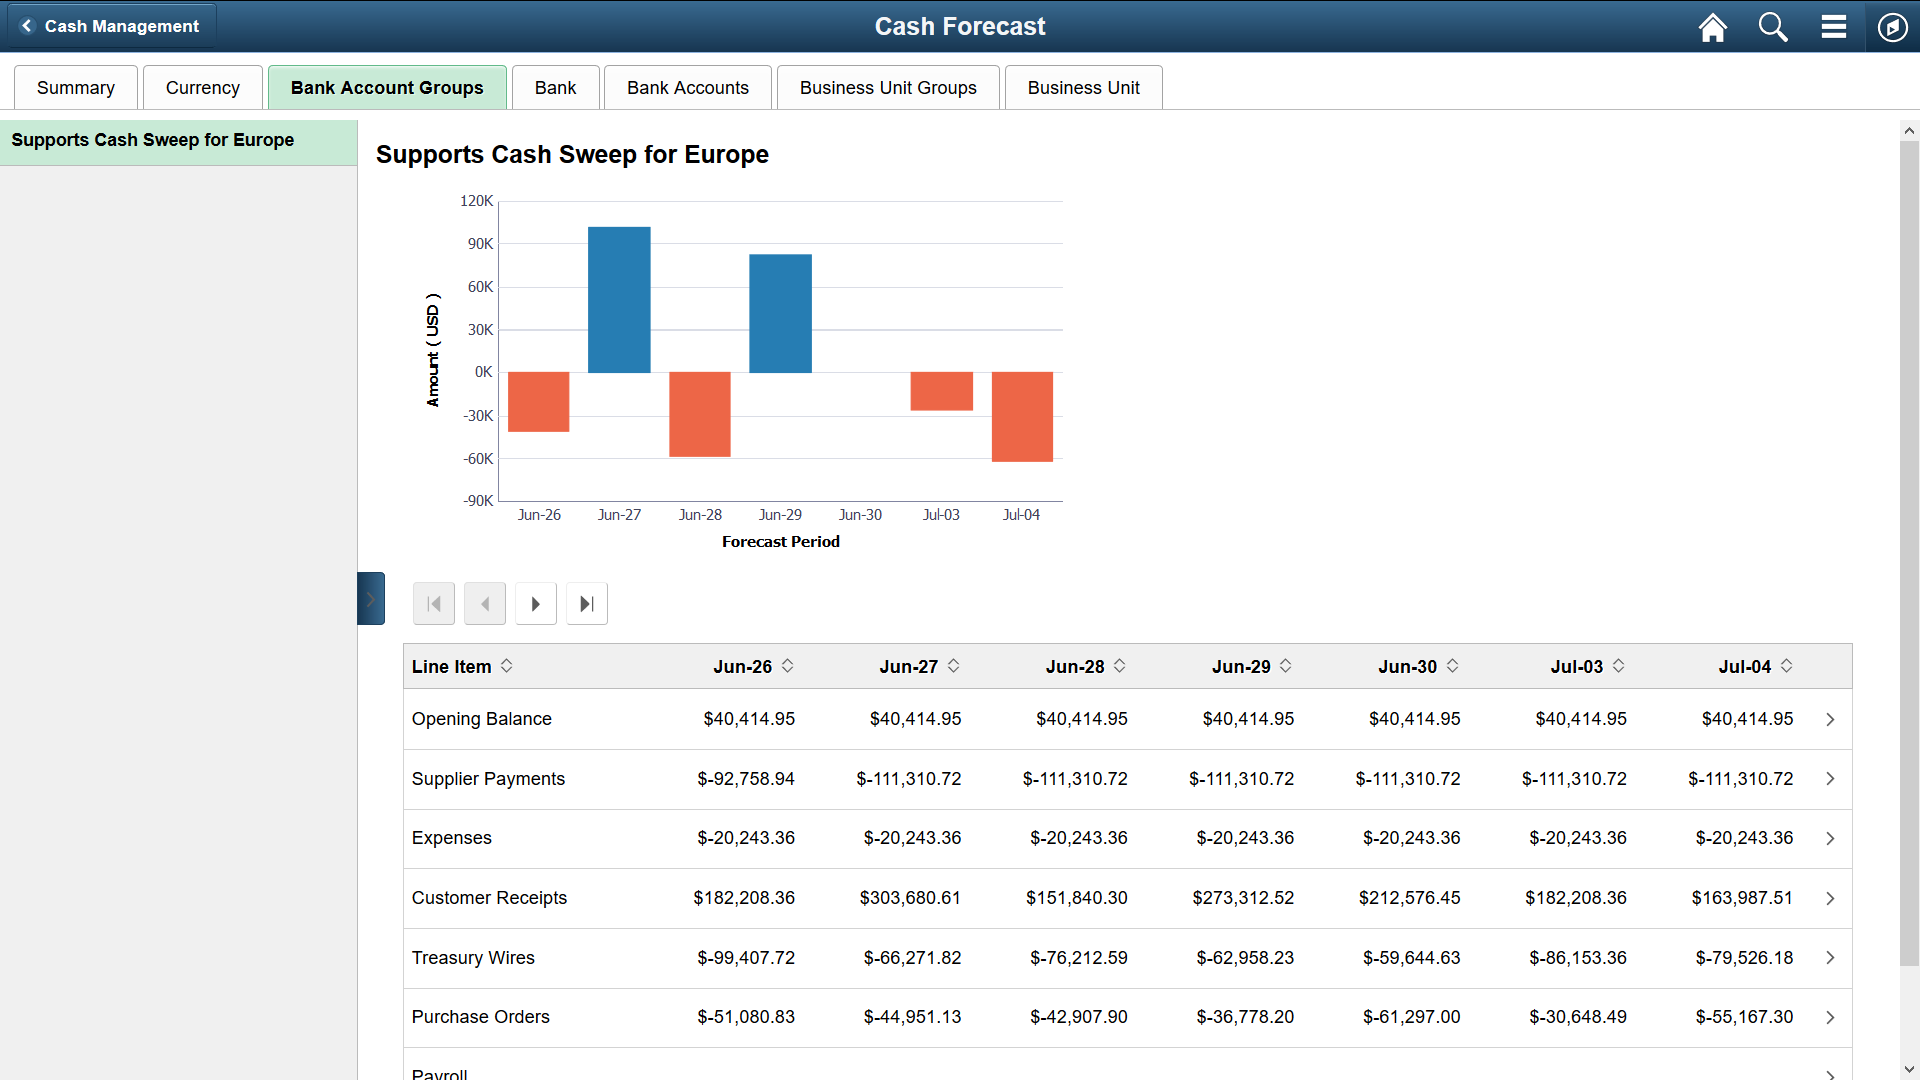
The left pane displays the bank account groups. Select a bank account group in the list to see the details of each account group in the bar chart and table in the content pane.
The Bank Account Groups bar chart provides these fields:
Field or Control |
Description |
|---|---|
Forecast Period |
View the first seven time periods on the x-axis. Use the scroll buttons above the table to navigate among time periods. Populate the next seven time periods by selecting the right arrow scroll button. |
Amount |
View amounts on the y-axis, in the currency selected on the My Preferences - Cash Forecast page. |
The Bank Account Groups table provides these fields:
Field or Control |
Description |
|---|---|
Line Item |
View the worksheet line items for each time period and a total for each day. Use the scroll buttons above the table to navigate among time period columns. Populate the next seven time periods by selecting the right arrow scroll button. |
Total |
View the total line item amounts for each date in the last row. |
Use the Cash Forecast - Bank page (TR_LIQ_BNK_FL) to review the cash position by bank.
Navigation:
Select the Cash Forecast tile on the Cash Management homepage. Select the Bank tab.
This example illustrates the fields and controls on the Cash Forecast - Bank page. You can find definitions for the fields and controls later on this page.
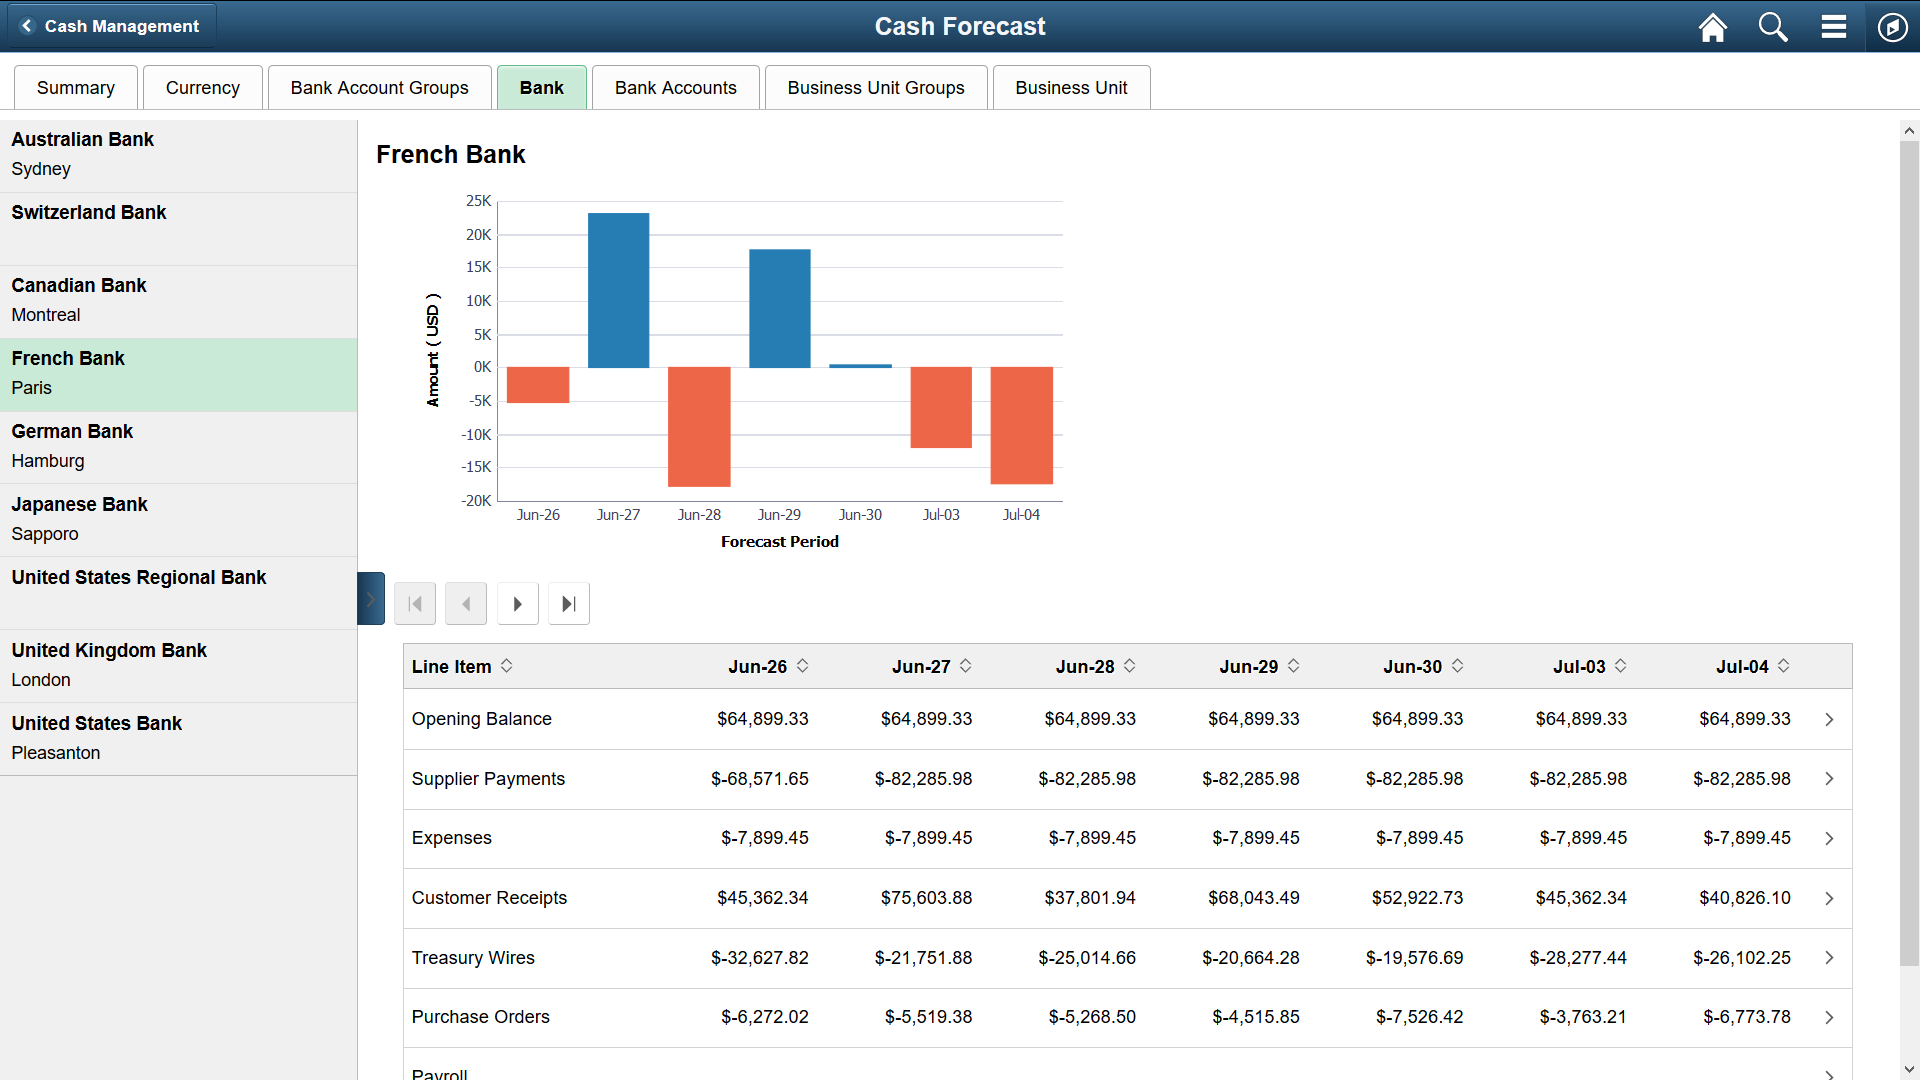
The left pane displays banks. Select a bank on the left pane to see the details of each bank in the bar chart and table in the content pane.
The Bank bar chart provides these fields:
Field or Control |
Description |
|---|---|
Forecast Period |
View the first seven time periods on the x-axis. Use the scroll buttons above the table to navigate among time periods. Populate the next seven time periods by selecting the right arrow scroll button. |
Amount |
View amounts on the y-axis, in the currency selected on the My Preferences - Cash Forecast page. |
The Bank table provides these fields:
Field or Control |
Description |
|---|---|
Line Item |
View the worksheet line items for each time period and a total for each day. Use the scroll buttons above the table to navigate among time periods. Populate the next seven time periods by selecting the right arrow scroll button. |
Total |
View the total line item amounts for each date in the last row. |
Use the Cash Forecast - Bank Accounts page (TR_LIQ_BAC_FL) to review the cash position by bank account.
Navigation:
Select the Cash Forecast tile on the Cash Management homepage. Select the Bank Accounts tab.
This example illustrates the fields and controls on the Fluid Cash Forecast - Bank Accounts page. You can find definitions for the fields and controls later on this page.
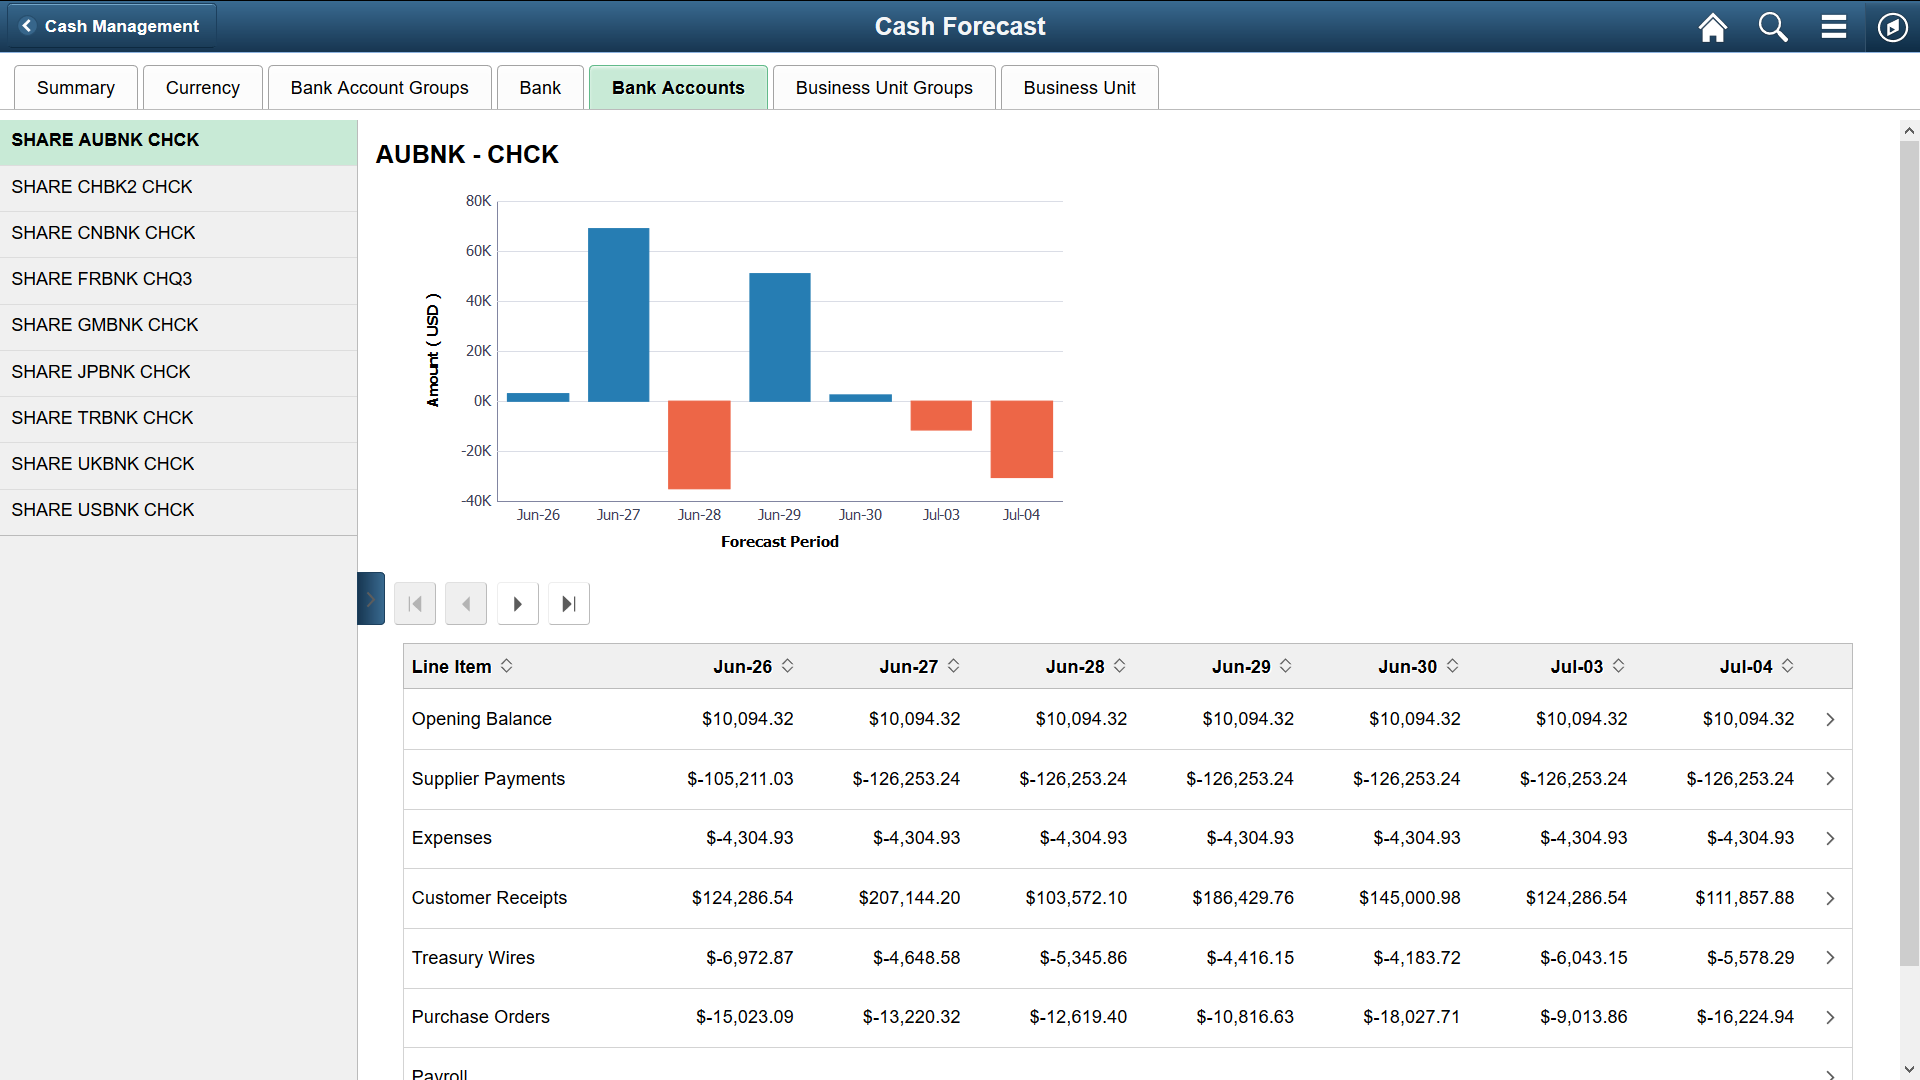
The left pane displays bank accounts. Select a bank account on the left pane to see the details of each bank account in the bar chart and table in the content pane.
The Bank Account bar chart provides these fields:
Field or Control |
Description |
|---|---|
Forecast Period |
View the first seven time periods on the x-axis. Use the scroll buttons above the table to navigate among time periods. Populate the next seven time periods by selecting the right arrow scroll button. |
Amount |
View amounts on the y-axis, in the currency selected on the My Preferences - Cash Forecast page. |
The Bank Account table provides these fields:
Field or Control |
Description |
|---|---|
Line Item |
View the worksheet line items for each time period and a total for each day. Use the scroll buttons above the table to navigate among time periods. Populate the next seven time periods by selecting the right arrow scroll button. |
Total |
View the total line item amounts for each date in the last row. |
Use the Cash Forecast - Business Unit Groups page (TR_LIQ_BGR_FL) to review the cash position by each business unit group.
Navigation:
Select the Cash Forecast tile on the Cash Management homepage. Select the Business Unit Groups tab.
This example illustrates the fields and controls on the Fluid Cash Forecast - Business Unit Groups page. You can find definitions for the fields and controls later on this page.
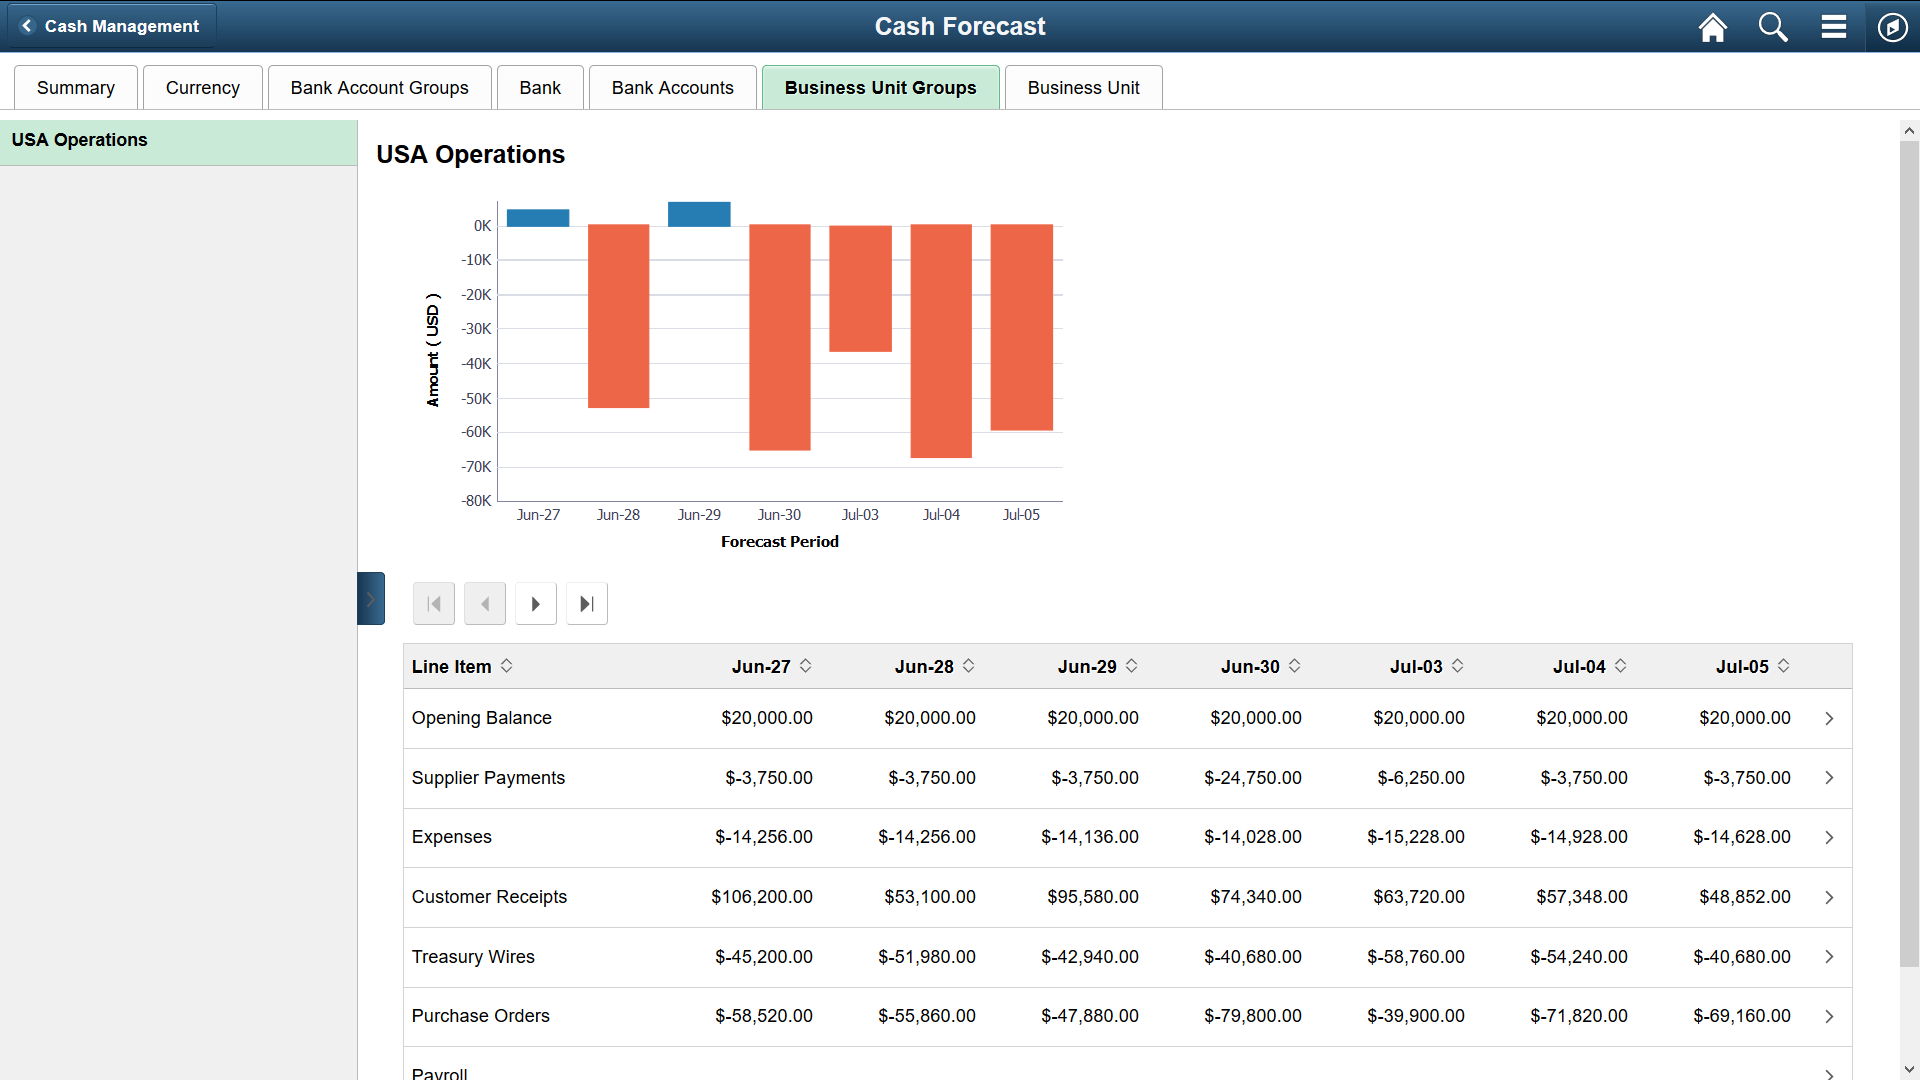
The left pane displays business unit groups. Select a business unit group on the left pane to see the details of each group in the bar chart and table in the content pane.
The Business Unit Groups bar chart provides these fields:
Field or Control |
Description |
|---|---|
Forecast Period |
View the first seven time periods on the x-axis. Use the scroll buttons above the table to navigate among time periods. Populate the next seven time periods by selecting the right arrow scroll button. |
Amount |
View amounts on the y-axis, in the currency selected on the My Preferences - Cash Forecast page. |
The Business Unit Groups table provides these fields:
Field or Control |
Description |
|---|---|
Line Item |
View the worksheet line items for each time period and a total for each day. Use the scroll buttons above the table to navigate among time periods. Populate the next seven time periods by selecting the right arrow scroll button. |
Total |
View the total line item amounts for each date in the last row. |
Use the Cash Forecast - Business Unit page (TR_LIQ_BU_FL) to review the cash position by business unit.
Navigation:
Select the Cash Forecast tile on the Cash Management homepage. Select the Business Unit tab.
This example illustrates the fields and controls on the Fluid Cash Forecast - Business Unit page. You can find definitions for the fields and controls later on this page.
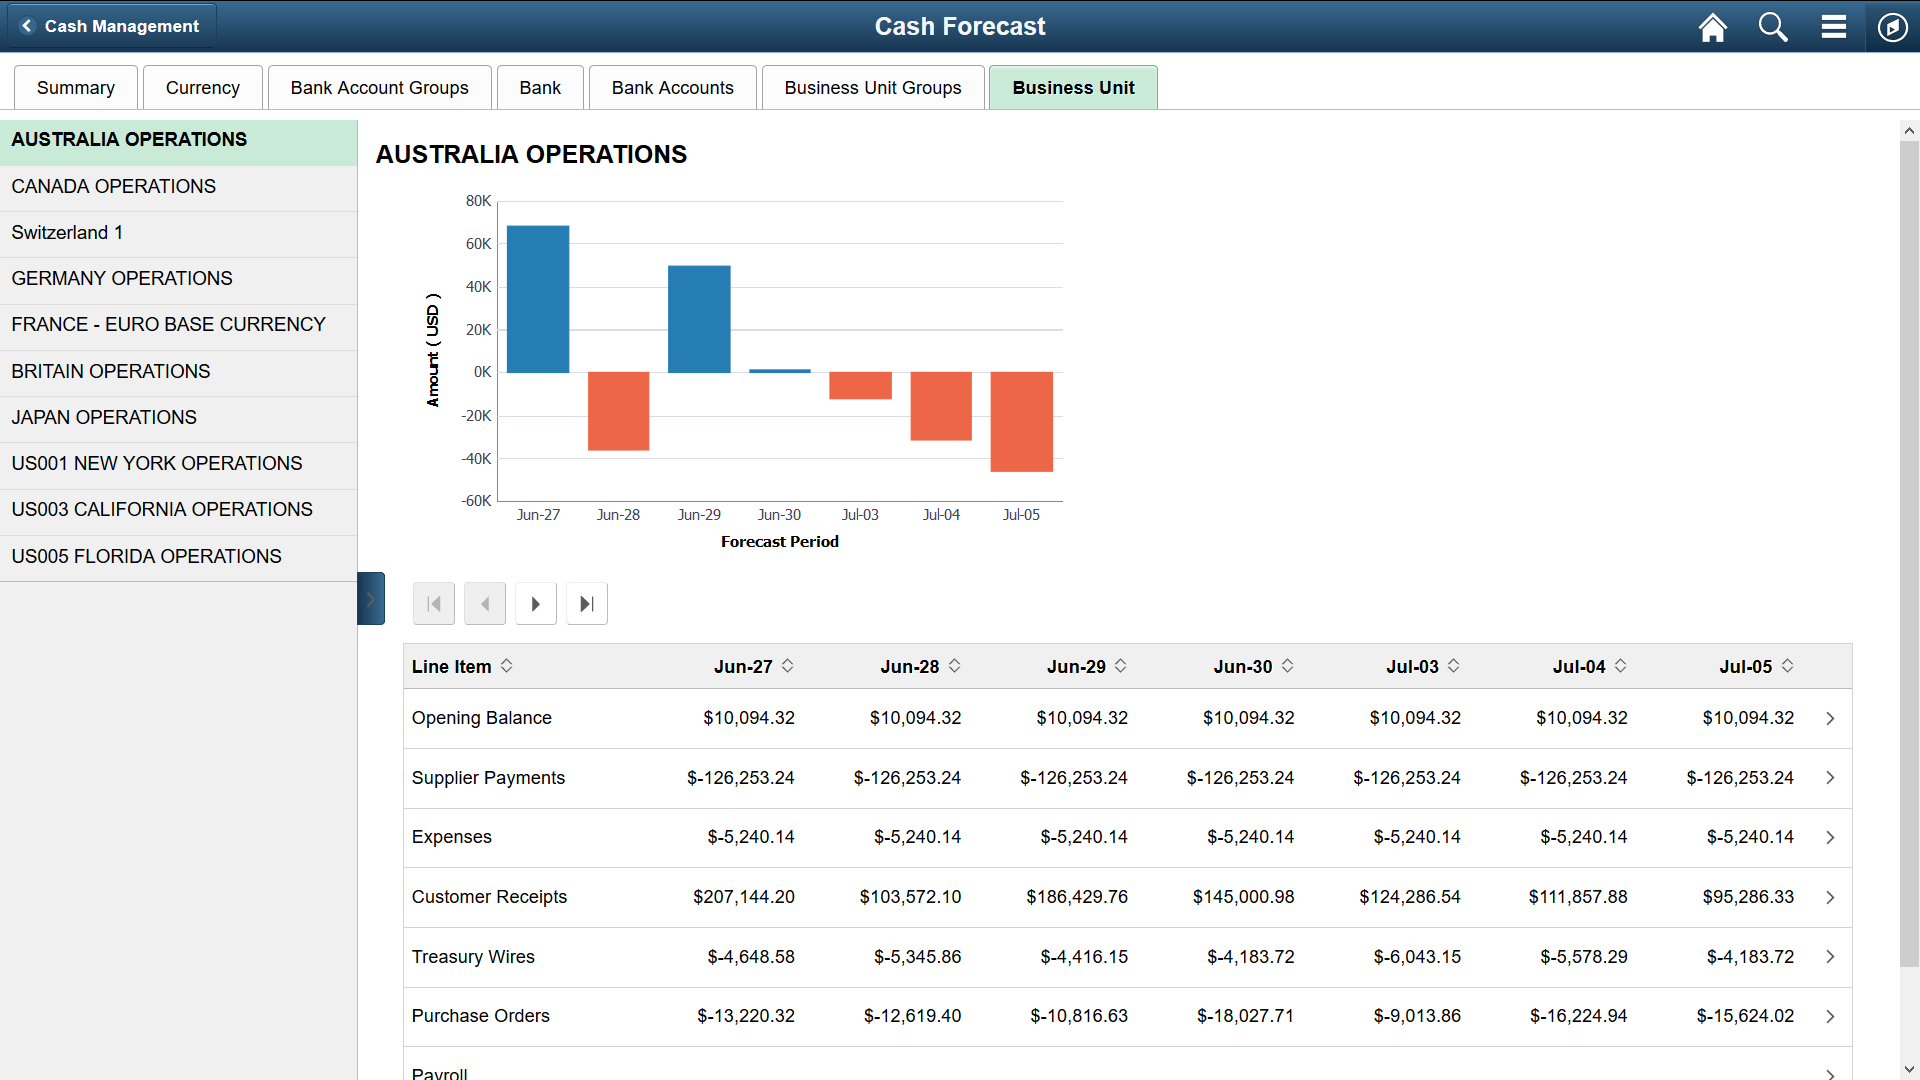
On the bar chart, the x-axis shows the first seven time periods and the y-axis shows the amounts. The table shows the worksheet line items for each time period and the total for each day. The scroll buttons above the table populate the next seven time periods. buttons are left, right, first, and last. The left panel displays business units, which you can select to see details.
The left pane displays business units. Select a business unit on the left pane to see the details of each business unit in the bar chart and table in the content pane.
The Business Unit bar chart provides these fields:
Field or Control |
Description |
|---|---|
Forecast Period |
View the first seven time periods on the x-axis. Use the scroll buttons above the table to navigate among time periods. Populate the next seven time periods by selecting the right arrow scroll button. |
Amount |
View amounts on the y-axis, in the currency selected on the My Preferences - Cash Forecast page. |
The Business Unit table provides these fields:
Field or Control |
Description |
|---|---|
Line Item |
View the worksheet line items for each time period and a total for each day. Use the scroll buttons above the table to navigate among time periods. Populate the next seven time periods by selecting the right arrow scroll button. |
Total |
View the total line item amounts for each date in the last row. |