Reviewing Investment and Debt on the PeopleSoft Fluid User Interface
This topic discusses using the PeopleSoft Fluid User Interface to review your organization’s investment and debt mix. Access investment and debt information through the Investment and Debt tile on the Cash Management homepage.
Click to watch a short video about the PeopleSoft Cash Management Homepage on the PeopleSoft Fluid User Interface.
|
Page Name |
Definition Name |
Usage |
|---|---|---|
|
EC_HOME_TILE_FL |
Review total debt and investments on the Cash Management homepage. Access the Investment and Debt page. |
|
|
TR_USER_PREF_FL |
Set up user preferences for the Investment and Debt tile and page. |
|
|
TR_ID_GRID_FL |
Review information about the market value of various portfolios and bank balance. |
|
|
TR_ID_DETAIL_FL |
Review investment portfolio information, investment and debt types, and investment and debt holdings. |
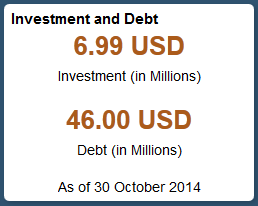
Use the Investment and Debt tile (EC_HOME_TILE_FL) to review total debt and investments.
Navigation:
View the tile on the Cash Management homepage.
This example illustrates the fields and controls on the Investment and Debt tile.
For more information about the tiles available on the Cash Management homepage, see Understanding The Cash Management Fluid Homepage.
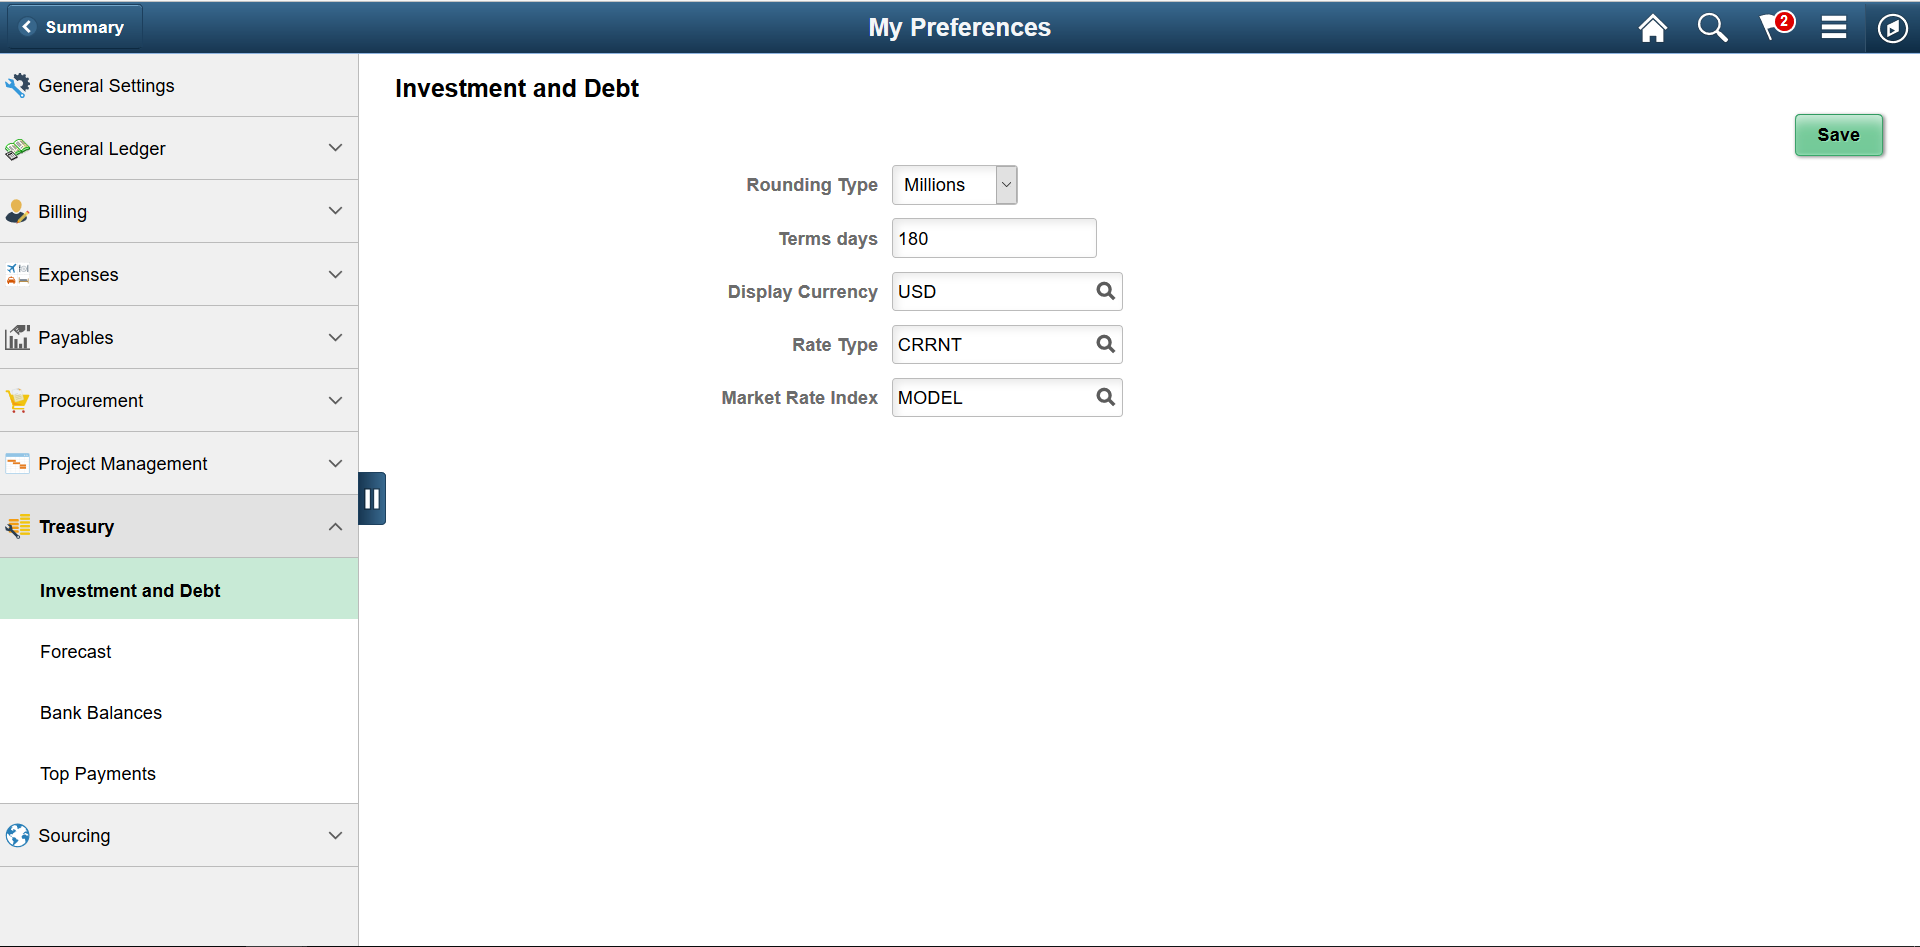
Use the My Preferences - Investment and Debt page (TR_USER_PREF_FL) to set up user preferences for the Investment and Debt tile and page.
Navigation:
From any Fluid homepage, select the Actions List button, then select My Preferences. Select Treasury in the left panel and select the Investment and Debt link.
On the Cash Management homepage, select the Investment and Debt tile. Select the Actions List button, then select My Preferences from the list.
This example illustrates the fields and controls on the My Preferences - Investment and Debt page. You can find definitions for the fields and controls later on this page.
Field or Control |
Description |
|---|---|
Rounding Type |
Select from Billions, Millions, or Thousands. |
Term days |
Enter the number of days to identify the short-term period. |
Display Currency |
Enter a currency for display on the Cash Management Investment and Debt tile and Investment and Debt page. |
Rate Type |
Enter the market rate type. |
Market Rate Index |
Enter the market rate index. |
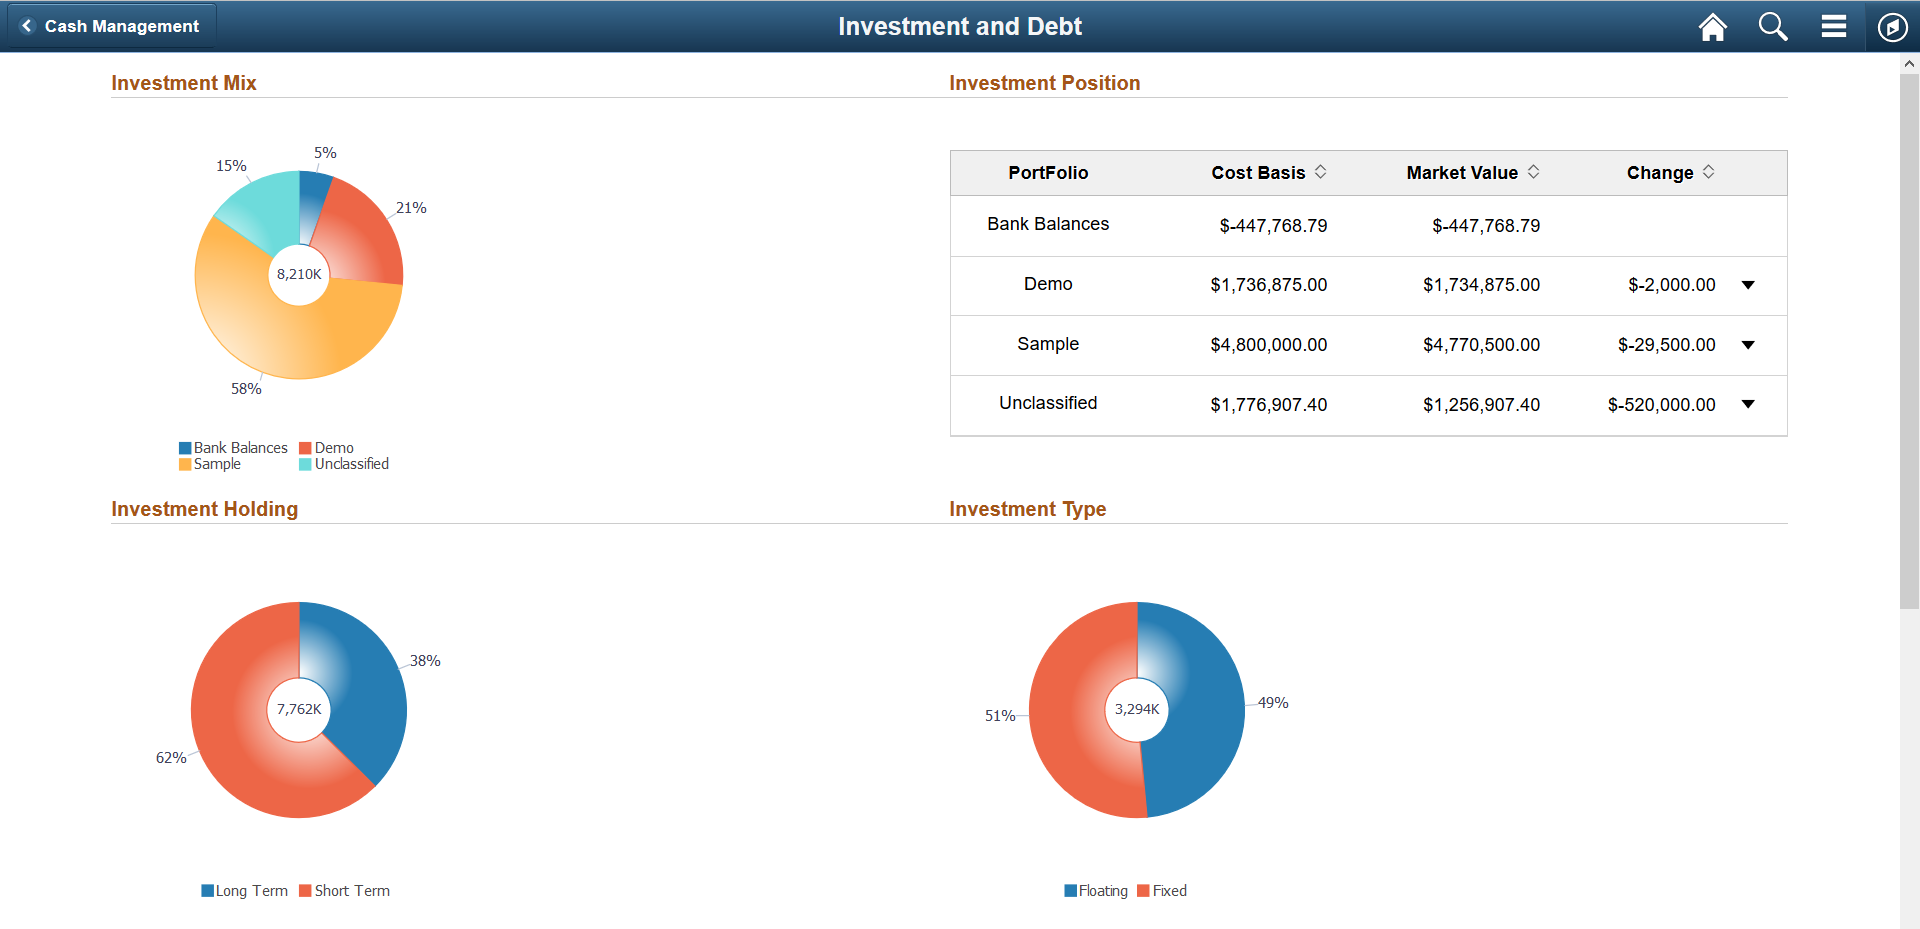
Use the Investment and Debt page (TR_ID_DETAIL_FL) to review investment portfolio information, investment and debt types, and investment and debt holdings.
Navigation:
Select the Investment and Debt tile on the Cash Management homepage.
This example illustrates the fields and controls on the Investment and Debt page (1 of 2). You can find definitions for the fields and controls later on this page.
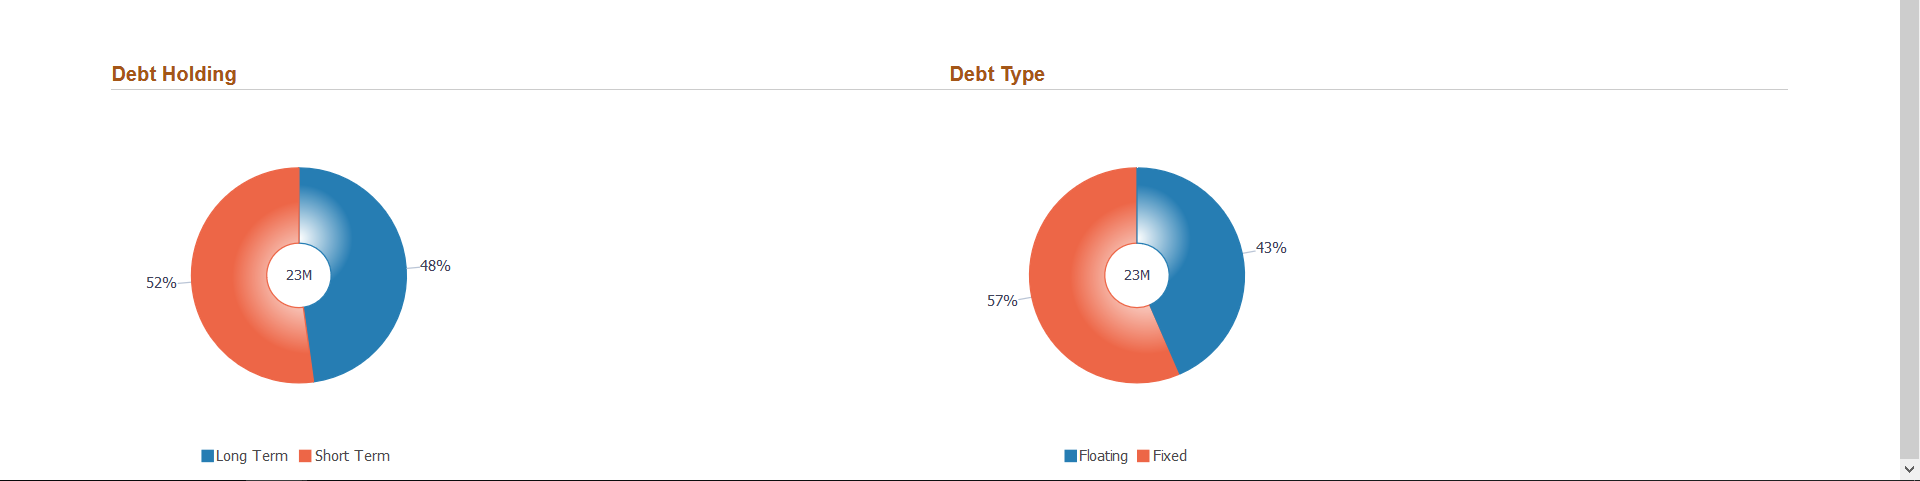
This example illustrates the fields and controls on the Investment and Debt page (2 of 2). You can find definitions for the fields and controls later on this page.
The Investment and Debt page includes the following table and ring charts. Each ring chart includes a legend by color and percentage designation.
Investment Mix
The Investment Mix ring chart shows the portfolios by percentage and the total market value. You can view details by selecting a section of the ring.
Select a portfolio in the ring to access the Investment Mix DrillDown page (TR_INV_MIX_DR_SCF), where you can view deals that make up the portfolio and the total market value.
View these details for each deal:
Business Unit
Deal ID
Instrument Type
Transaction Date
Ticker Symbol
Counterparty
Currency Code
Deal Status
Cost Basis
Market Value
Variance
Select the bank balances section to access the Bank Balances Detail page (TR_BANK_BAL_SCF), where you can view bank account balances in the investment mix.
View these bank account details:
Business Unit
Bank Name
Bank Account Number
Date
Currency Code
Closing Balance
Investment Position
The Investment Position table shows the portfolio names, cost basis, market value, and the difference between cost amount and market value. A positive change is indicated by an upward-pointing triangle icon, whereas a negative change is indicated by a downward-pointing triangle icon.
You can view details by selecting a row in the table:
Select a portfolio row to access the Investment Mix DrillDown page (TR_INV_MIX_DR_SCF), where you can view deals that make up the portfolio and the total market value. Details are the same as for the Investment Mix ring chart.
Select the bank balances row to view bank account details on the Bank Balances Detail page (TR_BANK_BAL_SCF). Details are the same as for the Investment Mix ring chart.
Investment Holding
The Investment Holding ring chart shows the percentage outstanding investment by length of investment and the total market value. The length of investment is divided into these time periods: short-term and long-term.
Select a section in the ring chart to access the Investment Holding Details page (TR_INV_HOLD_DR_SCF).
View these asset details:
Business Unit
Deal ID
Settlement Date
Maturity Date
Instrument Base Type
Portfolio
Bank
Account
Currency
Cost Basis
Market Value
Variance
Investment Type
The Investment Type ring chart shows the outstanding investments by type of interest rate and the total market value. Rate types are fixed and floating.
Select a section in the ring chart to access the Investment Type Details page (TR_INV_TYPE_DR_SCF). Details for fixed and floating assets are the same as for the Investment Holding ring chart.
Debt Holding
The Debt Holding ring chart shows the outstanding debt by length of debt and the total market value. The length of debt is divided into these time periods: short-term and long-term.
Select a section in the ring chart to access the Debt Holding Details page (TR_DEB_HOLD_DR_SCF). Details for short-term and long-term liabilities are the same as for the Investment Holding ring chart.
Debt Type
The Debt Type ring chart shows the outstanding debt by type of interest rate and the total market value. Rate types are fixed and floating.
Select a section of the ring chart to access the Debt Type Details page (TR_DEB_TYPE_DR_SCF). Details for fixed and floating liabilities are the same as for the Investment Type ring chart.
Use the NavBar: Investment and Debt page (TR_ID_GRID_FL) to review information about the market value of various portfolios and bank balance.
Navigation:
Select the NavBar button on the Oracle banner of any homepage to expand the navigator pane, then select the Investment and Debt tab.
This example illustrates the fields and controls on the NavBar: Investment and Debt page.
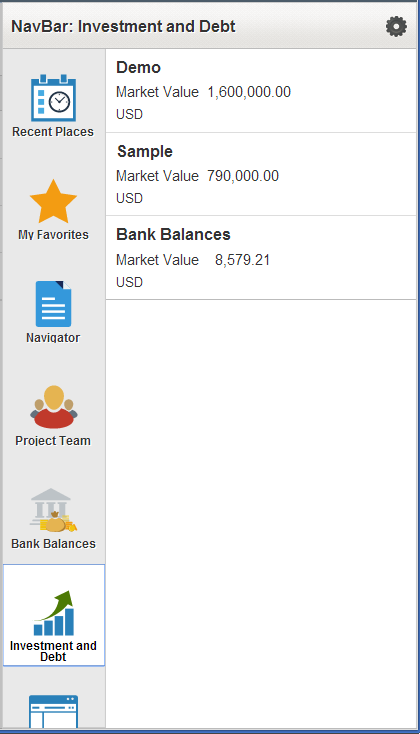
Fields include the portfolio name or Bank Balances, the market value, and currency.