Configuring and Displaying the Cash Management Dashboard
|
Page Name |
Definition Name |
Usage |
|---|---|---|
|
TR_DASH_CP_CFG |
Configure the Cash Management dashboard to display cash position data in these charts:
|
Use the Dashboard Configuration - Cash Position by Bank page (TR_DASH_01_CFG) to configure the Cash Management dashboard to display cash position data.
Navigation:
Treasury Dashboards
Click the Cash Forecast Trend link.
This example illustrates the fields and controls on the Dashboard Configuration - Cash Position page.
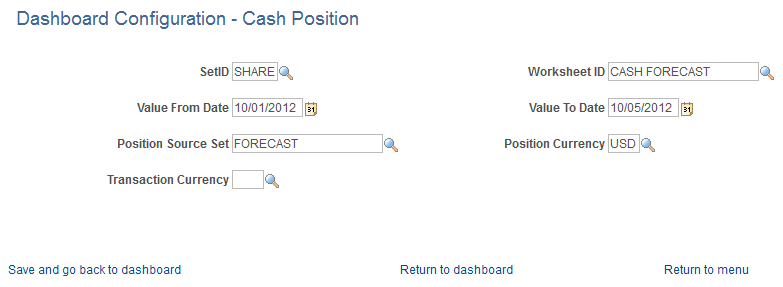
Field or Control |
Description |
|---|---|
Worksheet ID |
Identify the worksheet. |
Value From Date and Value To Date |
Identify the date range. |
Position Source Set |
Enter the position source set. |
Position Currency |
Enter the position currency. |
Transaction Currency |
Select the currency that you want to appear on the Cash Position by Bank or Cash Position by Transaction Currency chart. |
Save and go back to dashboard |
Click this link to save the configuration and return to the Treasury Dashboards page to display the selected dashboard based on the configuration. |
Return to dashboard |
Click this link to return to the selected dashboard on the Treasury Dashboards page after the configuration has been saved. |
Return to menu |
Click this link to return to the Treasury Dashboards menu. |
Cash Position By Bank Chart
Use the Cash Position By Bank chart to see the cash position by bank.
This example illustrates the fields and controls on the Cash Position By Bank chart.
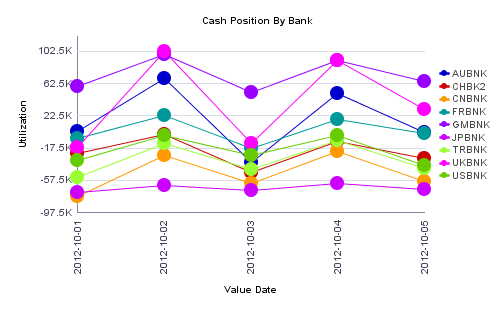
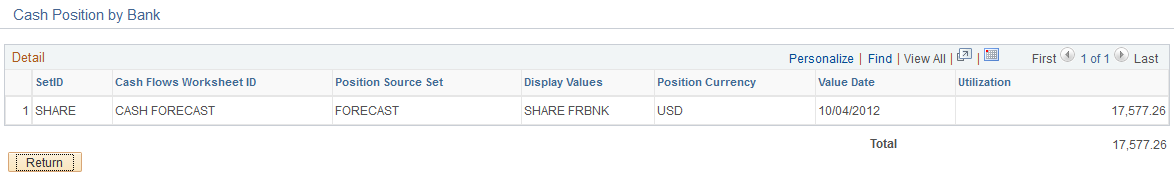
Click on a chart point to access detail information. The information appears in a grid in a new window.
This example illustrates the fields and controls on the Cash Position by Bank detail grid.
Cash Position by Transaction Currency Chart
Use the Cash Position by Transaction Currency chart to see the cash position by transaction currency.
This example illustrates the fields and controls on the Cash Position By Transaction Currency chart.
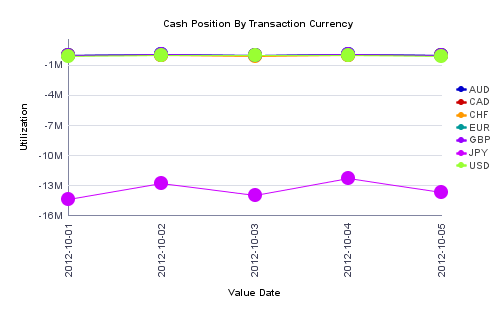
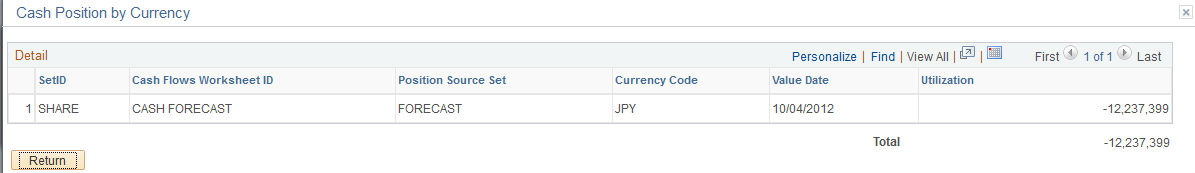
Click on a chart point to access detail information. The information appears in a grid in a new window.
This example illustrates the fields and controls on the Treasury Dashboards - Cash Position by Currency page (2 of 4).
Cash Position by Source Set Chart
Use the Cash Position by Source Set chart to see the cash position amount for the source set for a period of time.
Click on a chart point to access detail information. The information appears in a grid in a new window.
Cash Position by Business Unit Chart
Use the Cash Position by Business Unit chart to see cash position amounts for each Business Unit.
Click on a chart point to access detail information. The information appears in a grid in a new window.
Cash Position by Worksheet Line Item Chart
Use the Cash Position by Worksheet Line Item chart to see cash position amounts for each line item.
Click on a chart point to access detail information. The information appears in a grid in a new window.