Viewing SRM Dashboard Pagelets
|
Pagelet Name |
Usage |
View By |
|---|---|---|
|
Activity Monitor |
Displays worklist entries assigned to the buyer or manager. |
Buyer or Manager |
|
Dispatched Purchase Orders |
Displays a list of recently dispatched purchase orders. |
Buyer |
|
Live Sourcing Events |
Displays a list of recent sourcing event activity. |
Buyer |
|
Overdue PO Schedule Analysis |
The Overdue PO Schedule Analysis pivot grid pagelet summarizes purchase order schedule amounts where the due date is prior to today’s date and the schedule has remaining quantity to be received. The pivot grid allows the user to view and analyze data by Business Unit, Supplier, Category, Buyer, Ship To and Item. The pivot grid retrieves data via query against real-time transactions. . |
Buyer or Manager |
|
PO Acknowledgement Status |
Displays purchase orders that do not yet have a corresponding acknowledgement from the supplier, or those purchase orders that have acknowledgements and are awaiting review. |
Buyer |
|
PO Contract Spend by Period |
Displays the percentage of purchase order amounts that originated from a contract by period. |
Buyer |
|
Requisitions to be Sourced |
Displays approved requisitions that have not yet been sourced to a purchase order. |
Buyer |
|
Review ASN |
Displays ASN information for those purchase orders assigned to the specific buyer. |
Buyer |
|
Spend by Category |
Displays historical spend and future purchases for the buyer by item category. Summarizes and displays spend for the buyer for all categories. |
Buyer |
|
Spend by Supplier |
Displays historical spend and future purchases by supplier. Summarizes and displays spend for the buyer for all suppliers. |
Buyer |
|
Total PO Spend by PO Date |
Displays the total purchase order monetary amount (spend) by purchase order date assigned to the specific buyer. Amounts are bucketed by purchase order date and total purchase order amount. |
Buyer |
|
Total Schedule Spend by Period |
Displays the total schedule monetary amount (spend) for purchase orders assigned to the specific buyer. Amounts are bucketed by period, using the scheduled due date on the purchase order. |
Buyer |
|
Manager PO Contract Spend |
Displays purchase order contract spend for all buyers that report to a manager. |
Manager |
|
Manager PO Spend by PO Date |
Displays total purchase order spend by purchase order date for all buyers that report to a manager. |
Manager |
|
Manager Spend by Category |
Displays all historical spend and future purchases for all buyers that report to a manager by item category. Summarizes and displays spend for all buyers that report to a manager by item category. |
Manager |
|
Manager Spend by Supplier |
Displays historical spend and future purchases by supplier. Summarizes and displays spend for all buyers that report to a manager for all suppliers. |
Manager |
|
Manager Total Schedule Spend |
Displays total schedule spend for all buyers that report to a manager. |
Manager |
|
PO Spend Analysis As Of |
The PO Spend Analysis As Of pagelet displays purchase order spends as of a specified date in a Pivot Grid. The pivot grid allows the user to view and analyze data by Business Unit, Supplier, Category, Buyer, Ship To, and Item. The Pivot Grid uses the data created when the Update Spend History is run. |
Buyer or Manager |
|
Top 10 Category Spend |
Displays Top 10 categories based on PO spend in those categories. This includes both contract and non contract spend. |
Buyer or Manager |
|
Top 10 Non Contract Category |
Displays the Top 10 categories based on PO spend in those categories. This includes only non contract spend. |
Buyer or Manager |
|
Procurement Obligations |
Displays both PO spend (both contract and non PO contract) over time. |
Buyer or Manager |
|
Procurement Spend Analysis |
Displays the PO spend broken down by PO Contract and non PO Contract. |
Buyer or Manager |
|
Top 10 Non Contract Item |
Displays the Top 10 items based on PO spend in those items. This includes only non contract spend. |
Buyer or Manager |
|
Procurement Contract Spend |
Displays contract release amounts from a contract perspective. Every active contract is included, but only released lines and categories within those contracts are included. |
Buyer or Manager |
|
Group Contract Summary |
Displays the total PO spend amount for each Group Contract |
Buyer or Manager |
|
Registration Status |
Displays Supplier or Bidders registered in the system. |
Buyer or Manager |
|
Product Categories |
Displays the product categories selected during the registration process. |
Buyer or Manager |
|
Federal Reporting |
Displays the classification information selected during the registration process. |
Buyer or Manager |
|
Change Request Aging |
Displays an aging breakout of the change requests in pending status. |
Buyer or Manager |
|
Approved Change Request Trend |
Displays change request information across a time period. |
Buyer or Manager |
|
Approved Change Request Types |
Displays approved requests and is represented by groups. |
Buyer or Manager |
Field or Control |
Description |
|---|---|
|
Select this icon to display menu options. These options can include:
|
PO ID (purchase order ID) |
Displays the purchase order ID. When you click this link you will access the Maintain Purchase Order - Purchase Order page. Use this page to view or maintain the purchase order and all of its details. |

Access the Activity Monitor pagelet.
This example illustrates the fields and controls on the Activity Monitor pagelet.
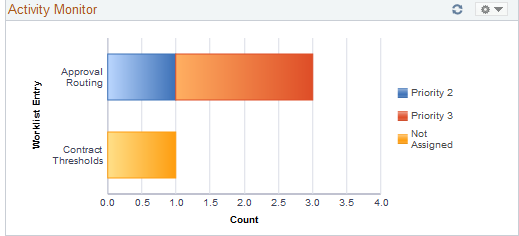
This pagelet displays the types of workflow notifications sent, along with the number of notifications. The assigned priority is indicated by the color of the bar graph.
To assign a priority to the worklist entry, click the type of notification you wish to update. From there, you will be transferred to the Worklist page which displays the individual entries where you can update the priority of an entry.
Access the Dispatched Purchase Orders pagelet.
This example illustrates the fields and controls on the Dispatched Purchase Orders pagelet. You can find definitions for the fields and controls later on this page.

This pagelet displays a list of recently dispatched purchase orders. Buyers can view purchase orders that have been created, approved, and sent to a supplier. The date and time that the purchase order was dispatched and the supplier to whom it was dispatched are also displayed. The most recently dispatched purchase orders will be displayed first.
Field or Control |
Description |
|---|---|
Show All/Enhanced |
Click this link to access the Search (dispatched purchase orders) page. Use this page to enter search criteria for a different set of purchase orders. After you enter the search criteria you are able to view the results of the search using the Filter Results page. |
Access the Live Sourcing Events pagelet.
This example illustrates the fields and controls on the Live Sourcing Events pagelet. You can find definitions for the fields and controls later on this page.
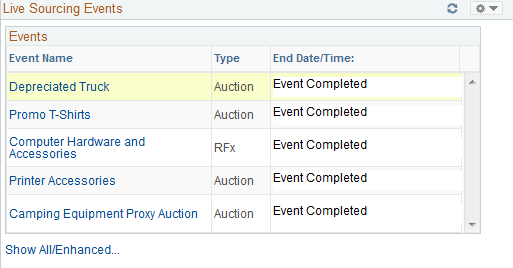
This pagelet displays a list of recent sourcing event activities. Buyers can view the events that have been created and completed along with the date and time that the event type.
Field or Control |
Description |
|---|---|
Show All/Enhanced |
Click this link to access the Search (live sourcing events) page. Use this page to enter search criteria for a different set of events. After you enter the search criteria you can view the results of the search using the Filter Results page. |
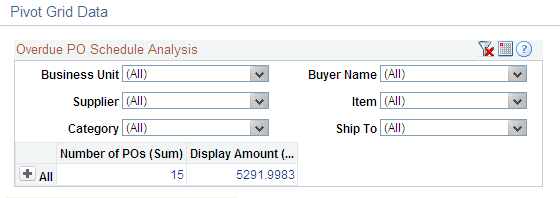
The Overdue PO Schedule Analysis pagelet displays a Pivot Grid. This pivot grid is based on a query that displays all overdue purchase order schedules showing the purchase order due date and summarized amount. Overdue purchase order line shipments are overdue when the due date is prior to current date and there remains quantity to be received.
Use the Overdue PO Schedule Analysis pagelet to view overdue purchase order schedules
Navigation:
This example illustrates the fields and controls on the Overdue PO Schedule Analysis.
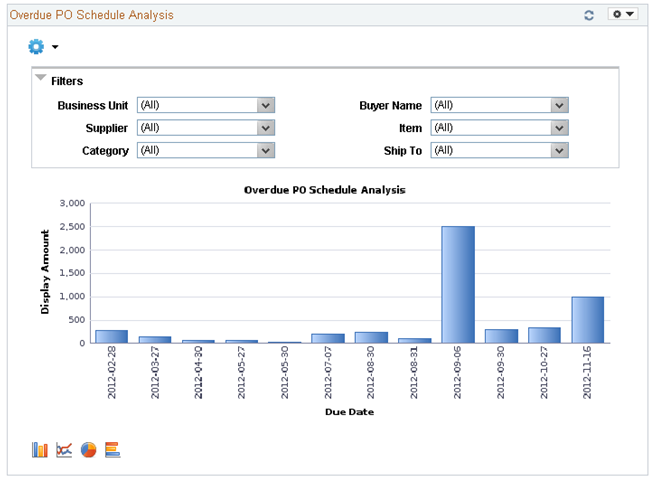
Users can click on a bar on the graph and click on the Detailed View to access the Pivot Grid Drilldown page. The page will help the user to see a list of purchase order details that represent the graph.
This example illustrates the fields and controls on the Overdue PO Schedule Analysis(2 of 4).
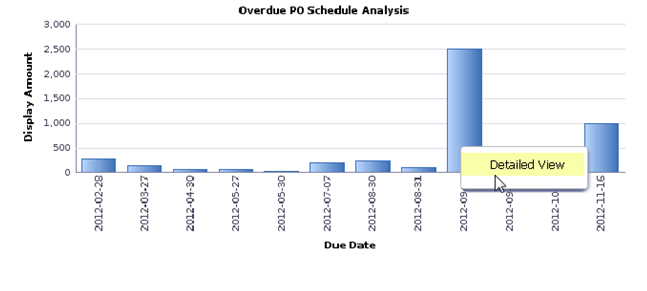
From the Detailed View, a user can use the Actions drop down option to view the related actions for the purchase orders.
This example illustrates the fields and controls on the Overdue PO Schedule Analysis (3 of 4).
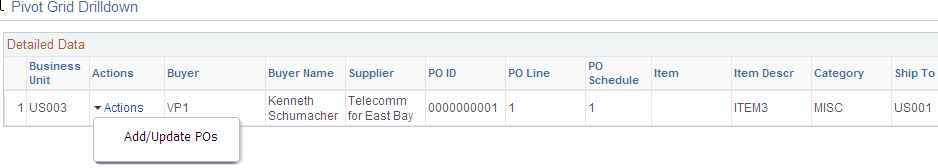
Users can click on the Add/Update POs and a new window will appear. Related action will take the user to the Add/Update PO component to view additional information about the PO.
Users also have the option to view the data by using the View Grid Page. You can click on the Options menu to access the View Grid Page. The View Grid option enables you to view PO schedule lines based on the Prompt criteria and Data Source Filters in the Pivot Grid
The user can also modify the filters criteria and rearrange the chart view. The View Grid displays the following information:
Number of POs – indicates the count of PO schedule lines
Display Amount – indicates (price * quantity) of selected PO schedule lines
Users have the option to set the following Prompts to select data into the Pivot Grid:
Date Options – Select 1 or 2 weeks of overdue data or select specific dates
Display Currency – Select the Currency to display the amount in
From Date and To Date range – Select the date range
Users can also narrow the pivot grid data based on these filters: Business Unit, Buyer Name, Supplier, Item, Ship To and category.
This example illustrates the fields and controls on the Overdue PO Schedule Analysis page(4 of 4).
Users can click a link in the Display Amount column to access the Pivot Grid Drilldown page.
Access the PO Acknowledgement Status pagelet.
This example illustrates the fields and controls on the PO Acknowledgement Status pagelet. You can find definitions for the fields and controls later on this page.
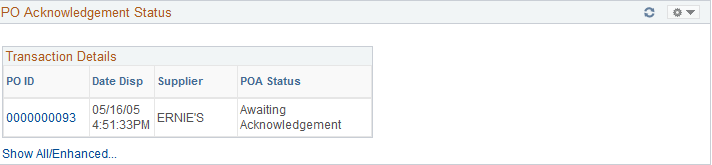
This pagelet displays purchase orders that do not have a corresponding acknowledgement from the supplier, or those purchase order's that have acknowledgements and are awaiting review. The purchase order's displayed here have been dispatched to the supplier and are set up for acknowledgements. The dispatch date along with the supplier to which the purchase order was dispatched is displayed along with it's current POA status.
Field or Control |
Description |
|---|---|
Show All/Enhanced |
Click this link to access the Search (purchase order acknowledgements) page. Use this page to enter search criteria for a different set of purchase orders. After you enter the search criteria you are able to see the results of the search using the Filter Results page. |
Access the PO Contract Spend By Period pagelet.
This example illustrates the fields and controls on the PO Contract Spend By Period pagelet.

This pagelet displays the percentage of spend that originated from a contract. The amounts per period displayed are based on the calendar tied to the reporting entity of the run control used to generate the spend history information. Purchase order schedules that were converted from a contract are bucketed into the calendar periods according to their scheduled due date. The value of this periodic contract spend is then calculated as a percentage of the total of all purchase orders for the period. The number of periods displayed is based on the options selected in the Buyer definition for the dashboard. To view the numeric value percentage and the total schedule lines for the period, use the cursor to hover over the selected bar graph.
Click a specific bar graph to access the Contract Spend by Period page. Use this page to view and analyze all the details for the contact spend by period.
Access the Requisitions to be Sourced pagelet.
This example illustrates the fields and controls on the Requisitions to be Sourced pagelet. You can find definitions for the fields and controls later on this page.
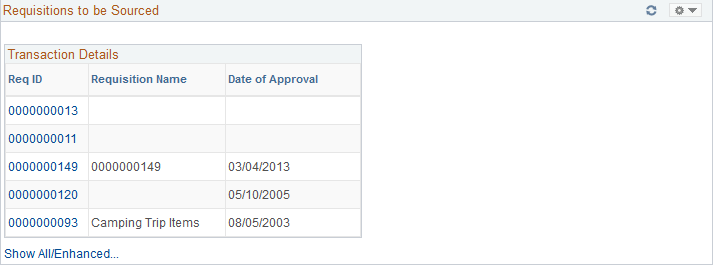
This pagelet displays recently approved requisitions for the buyer that have not yet been sourced to a supplier.
Field or Control |
Description |
|---|---|
Req ID (requisition ID) |
Click this link to access the requisition. If the requisition originated in PeopleSoft eProcurement, you will be transferred to the Requisition Details page. From there, you can transfer to the PeopleSoft eProcurement Manage Requisitions component. If the requisition originated in PeopleSoft Services Procurement, you will be transferred to the PeopleSoft eProcurement Manage Requisitions component. If the requisition originated in PeopleSoft Purchasing and PeopleSoft eProcurement is not installed, you will be transferred to the Maintain Requisitions - Requisition page. From there, you can transfer to the Add/Update Requisitions component. If both PeopleSoft Purchasing and PeopleSoft eProcurement are installed you will always be transferred to the PeopleSoft eProcurement Manage Requisitions component. |
Show All/Enhanced |
Click this link to access the Search (requisitions to be sourced) page. Use this page to enter search criteria for a different set of requisitions. After you enter the search criteria you are able to see the results of the search using the Filter Results page. |
Access the Review ASN pagelet.
This example illustrates the fields and controls on the Review ASN pagelet. You can find definitions for the fields and controls later on this page.
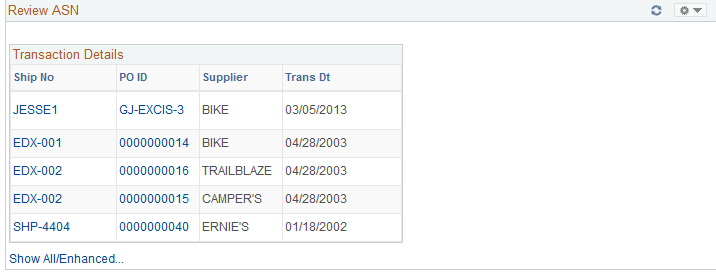
This pagelet displays only those shipment numbers that are associated to purchase orders related to the specific buyer. Only those ASNs that are new or ready to be processed will display. The supplier name and the date of transmission will also display. If multiple purchase orders are associated with the ASN, Multiple will appear under the PO ID column instead of the Purchase Order ID.
Field or Control |
Description |
|---|---|
Ship No |
Displays the shipping number. Click this link to access the ASN History - Line Details page. Use this page to review the ASN information. |
Show All/Enhanced |
Click this link to access the Search (advanced shipping receipts) page. Use this page to enter search criteria for a different set of purchase orders or ASNs. After you enter the search criteria you are able to see the results of the search using the Filter Results page. |
Access the Spend By Category pagelet.
This example illustrates the fields and controls on the Spend By Category pagelet. You can find definitions for the fields and controls later on this page.
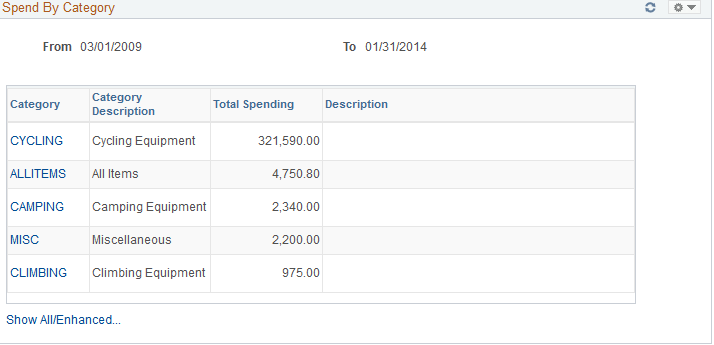
This pagelet will display all historic and future purchase order spend for the buyer by item category. On the initial pagelet, the total spend will be summarized by category and will display in descending order based on total spend amount.
If you have selected the two column format for the dashboard, this pagelet is expanded and shows the Historical Spend and Future Spend amounts in addition to the total spend by category. The amount of history and future spend are dependent on the number of prior and future periods defined on the Buyer Setup - Dashboard page. The historical spend is the sum of the schedule lines for that category for the number of periods specified. For example, if you set up a buyer with 8 prior periods and 3 future periods using the Buyer Setup - Dashboard page, the amount that displays for historical spend will be the sum of the prior 8 periods of schedule lines, summarized by category.
Historical is considered any schedule prior to today's date up to the beginning date of the first period in the historical range. For example, today is 11/01/06. You set up the buyer with 8 prior and future periods using the Buyer Setup - Dashboard page. March would be the first of the historical periods. March's period is defined as 03/01/06 to 03/31/06. Therefore the historical date range would be 03/01/06 to 10/31/06.
Future spend is the sum of the schedule lines for today's date, plus the remainder of the current period plus, the next three periods, summarized by category. In our example, the future date range would be 11/01/06 to 02/28/07.
If you selected the three column format for the dashboard, only the category, description and total spend amount are displayed.
Field or Control |
Description |
|---|---|
Category |
Click this link to access the View Spend by Category page. Use this page to view historical and future spend for the selected category. |
Show All/Enhanced |
Click this link to access the Spend By Category page. Use this page to view all the spend by category information. |
Access the Spend By Supplier pagelet.
This example illustrates the fields and controls on the Spend By Supplier pagelet. You can find definitions for the fields and controls later on this page.
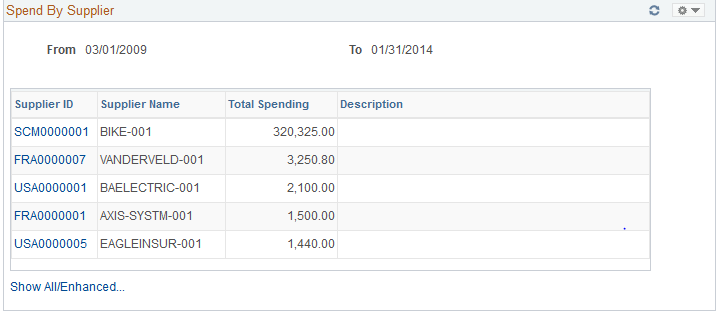
This pagelet will display all historic and future purchase order spend for the buyer by supplier. On the initial pagelet, the total spend will be summarized by supplier and will display in descending order based on total spend amount.
If you have selected the two column format for the dashboard, this pagelet is expanded and shows the Historical Spend and Future Spend amounts in addition to the total spend by supplier. The amount of history and future spend are dependent on the number of prior and future periods defined on the Buyer Setup - Dashboard page just like the Spend by Category pagelet.
If you selected the three column format for the dashboard, only the supplier, supplier name, and total spend amount are displayed. Click the Supplier link to view historical and future spend for the selected supplier.
Field or Control |
Description |
|---|---|
Supplier ID |
Click this link to access the Category Spend by Supplier page. Use this page to view historical and future spend for the selected supplier. |
Show All/Enhanced |
Click this link to access the Spend By Supplier page. Use this page to view all the spend by supplier information. |
Access the Total PO Spend By PO Date pagelet.
This example illustrates the fields and controls on the Total PO Spend By PO Date pagelet.
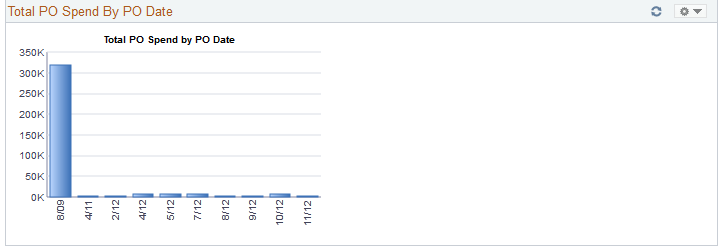
This pagelet displays the total purchase order spend in a graphical format for a specific buyer. Purchase order lines are bucketed into the calendar periods according to their purchase order date and total purchase order amount. The number of periods displayed is based on the period options selected in the Buyer definition for the dashboard. To view the numeric value spend and the total purchase orders for the period, use the cursor to hover over the selected bar graph.
Click a specific bar graph to access the Spend by PO Date page. Use this page to view and analyze all the details for the spend by purchase order date.
Access the Total Schedule Spend By Period pagelet.
This example illustrates the fields and controls on the Total Schedule Spend By Period pagelet.
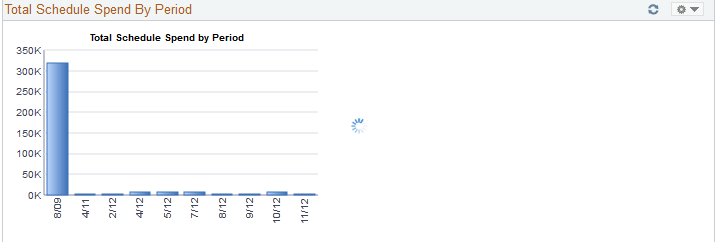
This pagelet displays the total schedule spend in a graphical format for a specific buyer. Purchase order schedule lines are bucketed into the calendar periods according to their scheduled due date. The number of periods displayed is based on the period options selected in the Buyer definition for the dashboard. To view the numeric value spend and the total schedule lines for the period, use the cursor to hover over the selected bar graph.
Click a specific bar graph to access the Schedule Spend by Period page. Use this page to view and analyze all the specific details for the schedule spend by period.
Access the Manager PO Contract Spend pagelet.
This example illustrates the fields and controls on the Manager PO Contract Spend pagelet.
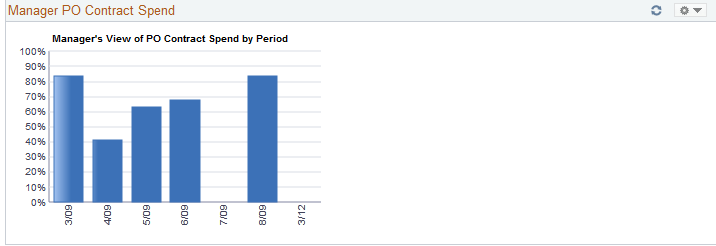
This pagelet is similar to the PO Contract Spend by Period pagelet, but it will consist of all the buyers spend history that report to this manager. The number of periods that display on this pagelet will be based on the parameters defined for this manager on the Buyer Setup - Dashboard page. To view the numeric value spend and the total schedule lines for the period, use the cursor to hover over the selected bar graph.
Click a specific bar graph to access the Manager PO Contract Spend page. Use this page to view and analyze all the details for the managers purchase order contact spend for those buyers reporting to the manager.
Access the Manager PO Spend By PO Date pagelet.
This example illustrates the fields and controls on the Manager PO Spend By PO Date pagelet.
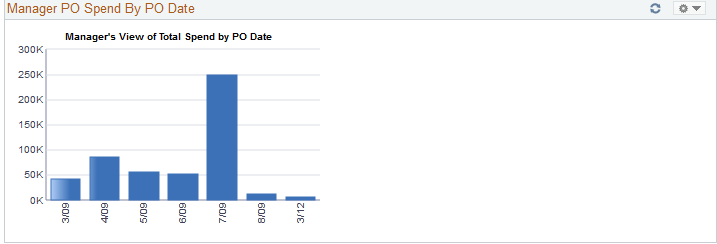
This pagelet is similar to the Total PO Spend by PO Date pagelet, but it will consist of all the buyers spend history that report to this manager. The number of periods that display on this pagelet will be based on the parameters defined for this manager on the Buyer Setup - Dashboard page. To view the numeric value percentage and the total purchase orders for the period, use the cursor to hover over the selected bar graph.
Click a specific bar graph to access the Manager PO Spend by PO Date page. Use this page to view and analyze all the details for the manager purchase order spend by purchase order date.
Access the Manager Spend by Category pagelet.
This example illustrates the fields and controls on the Manager Spend By Category pagelet. You can find definitions for the fields and controls later on this page.
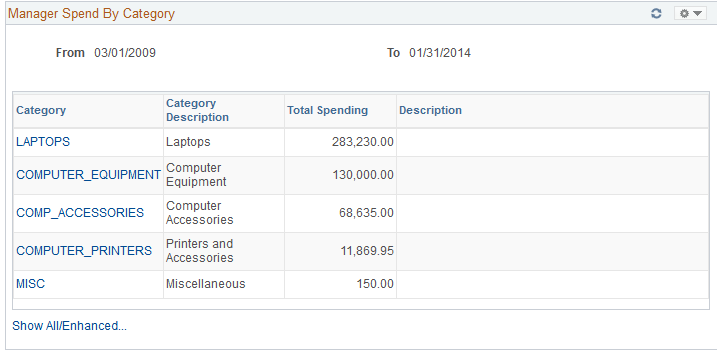
This pagelet is similar to the Spend by Category pagelet, but it will consist of all the buyers historic and future spend history that report to this manager. On the initial pagelet, the total spend for all buyers will be summarized by category and will display in descending order based on total spend amount. The period ranges that display on this pagelet will be based on the parameters defined for this manager on the Buyer Setup - Dashboard page.
Field or Control |
Description |
|---|---|
Category |
Click this link to access the Manager Spend by Category page. Use this page to view and analyze all the details for the manager total schedule spend by category for all of their buyers. |
Show All/Enhanced |
Click this link to access the Manager Spend By Category page. Use this page to view all the manager spend by category information. |
Access the Manager Spend by Supplier pagelet.
This example illustrates the fields and controls on the Manager Spend By Supplier Pagelet. You can find definitions for the fields and controls later on this page.

This pagelet is similar to the Spend by Supplier pagelet, but it will consist of all the buyers historic and future spend information that report to this manager. On the initial pagelet, the total spend for all buyers will be summarized by supplier and will display in descending order based on total spend amount. The period ranges that display on this pagelet will be based on the parameters defined for this manager on the Buyer Setup - Dashboard page.
Field or Control |
Description |
|---|---|
Supplier ID |
Click this link to access the Manager Spend by Supplier page. Use this page to view and analyze all the details for the manager total schedule by supplier for all of their buyers. |
Show All/Enhanced |
Click this link to access the Manager Spend By Supplier page. Use this page to view all the manager spend by supplier information. |
Access the Manager Total Schedule Spend pagelet.
This example illustrates the fields and controls on the Manager Total Schedule Spend pagelet.

This pagelet is similar to the Total Schedule Spend by Period, but it will consist of all buyers spend history that report to this manager. The number of periods that display on this pagelet will be based on the parameters defined for this manager on the Buyer Setup - Dashboard page. To view the numeric value spend and the total schedule lines for the period, use the cursor to hover over the selected bar graph.
Click a specific bar graph to access the Manager Total Schedule Spend page. Use this page to view and analyze all the details for the manager total schedule spend.
The PO Spend pagelet displays a Pivot Grid. The Pivot Grid uses the data created when the Update Spend History is run
For Information on Running the Spend History Process SeeUnderstanding the SRM Dashboard
Use the PO Spend Analysis As Of page to displays purchase order spends as of a specified date in a Pivot Grid.
Navigation:
This example illustrates the fields and controls on the PO Spend Analysis As Of page (1 of 4).
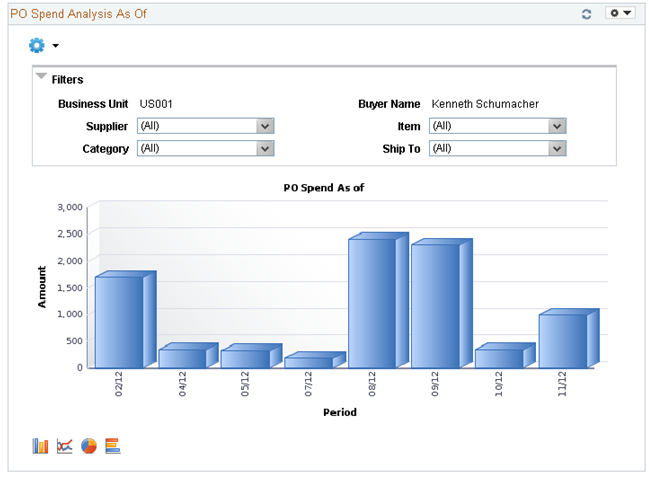
Users can click on a bar on the graph and click on the Detailed View to access the Pivot Grid Drilldown page and see a list of purchase order details that represent the graph.
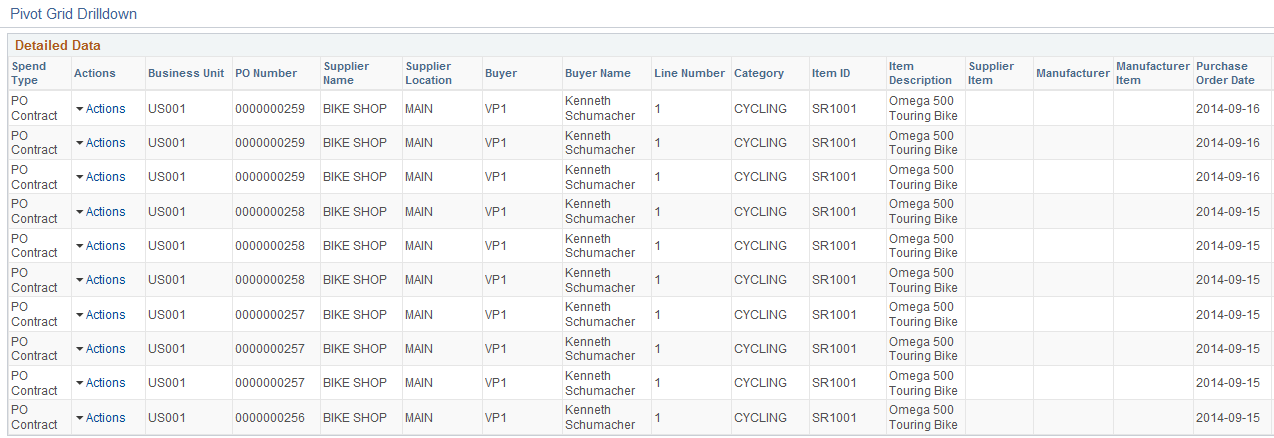
This example illustrates the fields and controls on the PO Spend Analysis As Of page(2 of 4).

From the Detailed View, a user can use the Actions drop down option to view the related actions for the purchase orders.
This example illustrates the fields and controls on the PO Spend Analysis As Of Page (3 of 4).
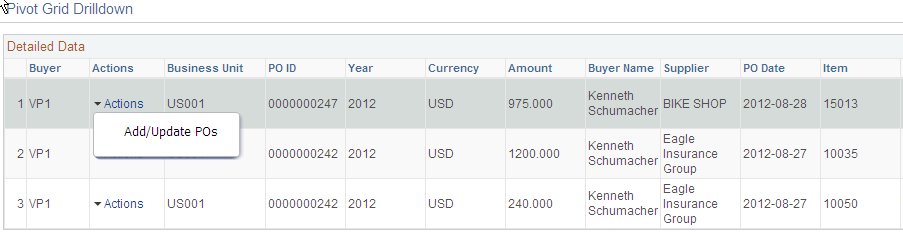
Users can click on the Actions to view the related actions for the PO. The related actions will take you to the Add/Update PO component.
Users also have the option to view the data by using the View Grid Page. You can click on the Options menu to access the View Grid Page.
The View Grid option enables you to view PO schedule lines based on the Prompt criteria and Data Source Filters in the Pivot Grid. The View Grid displays the following information:
Amount (Sum) – indicates (price * quantity) of selected PO schedule lines
Users have the option to set the From Date and To Date range using the Prompt Filter for the View Grid Page. Users can also narrow the pivot grid data based on these filters: Business Unit, Buyer Name, Supplier, Item, Ship To and category.
This example illustrates the fields and controls on the PO Spend Analysis As Of page(4 of 4).
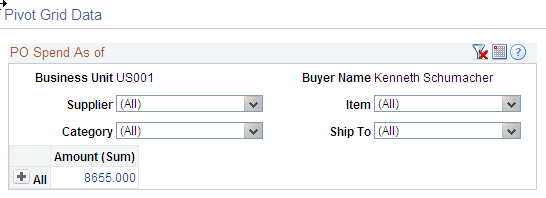
Users can click a link in the Amount (Sum) column to access the Pivot Grid Drilldown page.
For additional information about pivot grids, see: PeopleSoft Application Fundamentals, Using the WorkCenter for Financial and Supply Chain Applications.
See the product documentation for PeopleTools: Pivot Grid
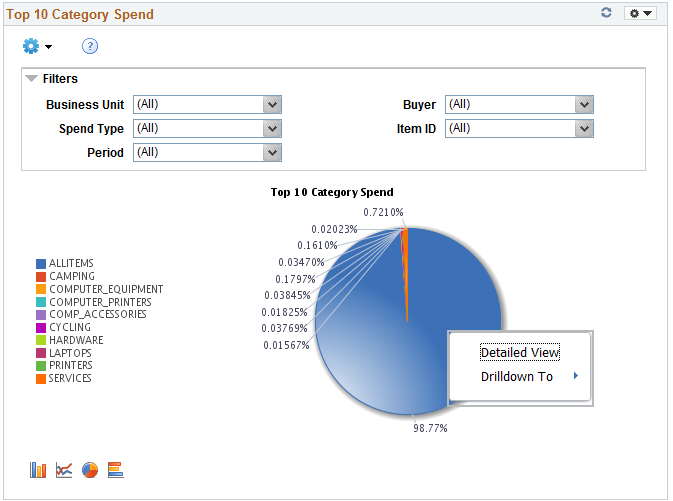
Access the Top 10 Category Spend pagelet.
This example illustrates the fields and controls on the Top 10 Category Spend.
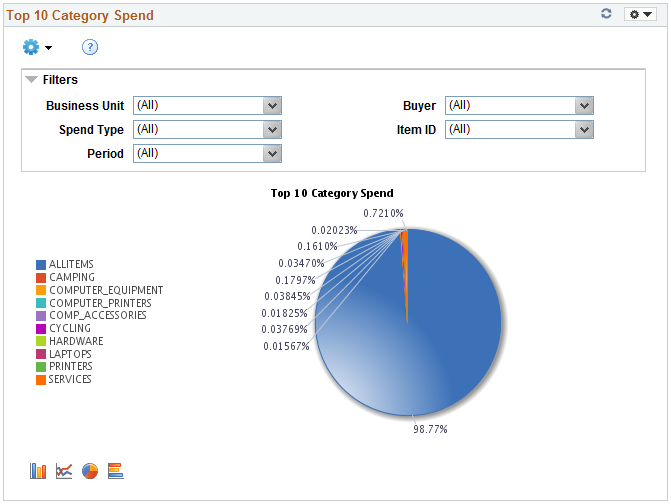
This pagelet displays the Top 10 categories based on PO spend in those categories. This includes both contract and non contract spend.
Users can click on the graph, and then click on Detailed View to access the Pivot Grid Drilldown page. The page will help the user to see a list of purchase order details that represent the graph.
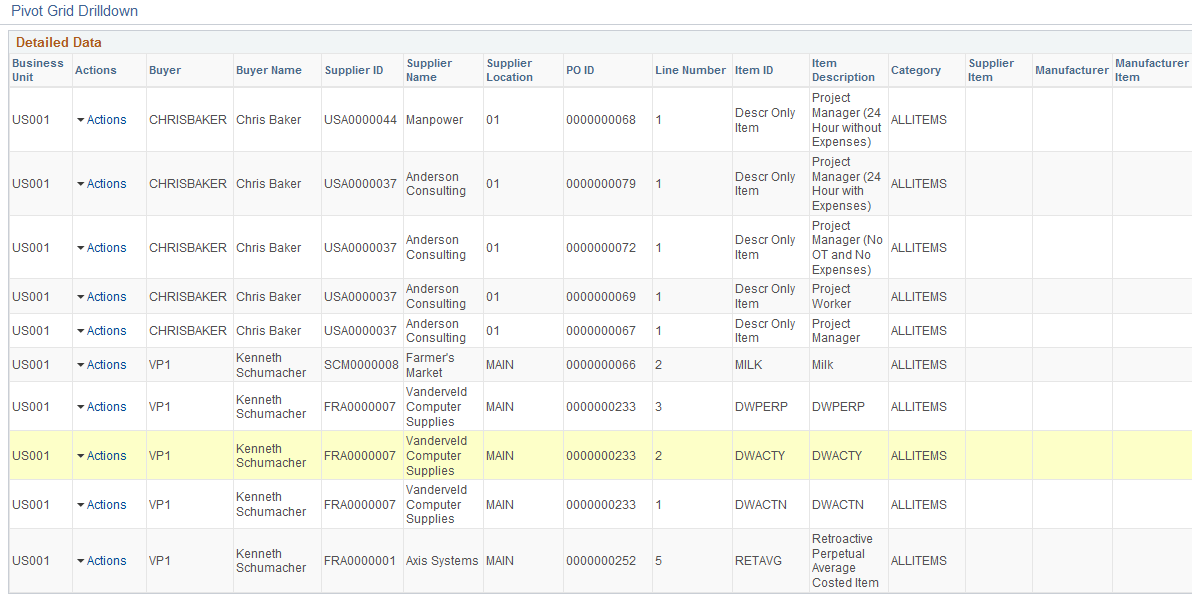
This example illustrates the fields and controls on the Top 10 Category Spend Detailed View.
This example illustrates the fields and controls on the Top 10 Category Spend Pivot Grid.
Access the Top 10 Non Contract Category pagelet.
This example illustrates the fields and controls on the Top 10 Non Contract Category Pagelet ( 1 of 2).
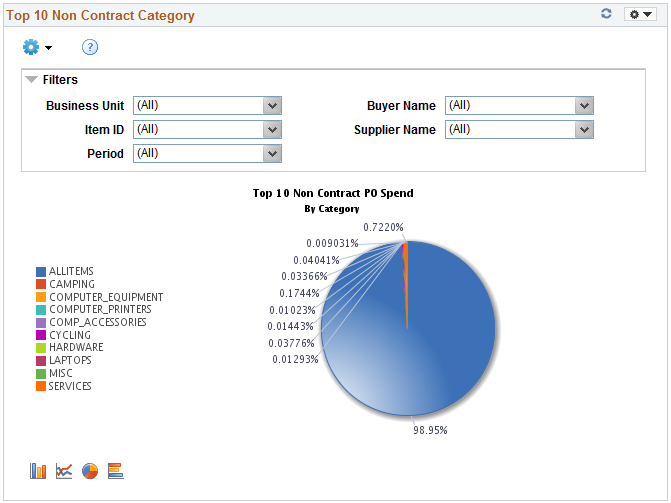
This pagelet displays the Top 10 categories based on PO spend in those categories. This pagelet includes only non contract spend.
Click on the graph for Detailed View of the data.
This example illustrates the fields and controls on the Top 10 Non Contract Category Pagelet (2 of 2).

Access the Procurement Obligations pagelet.
This example illustrates the fields and controls on the Procurement Obligations Pagelet (1 of 2).
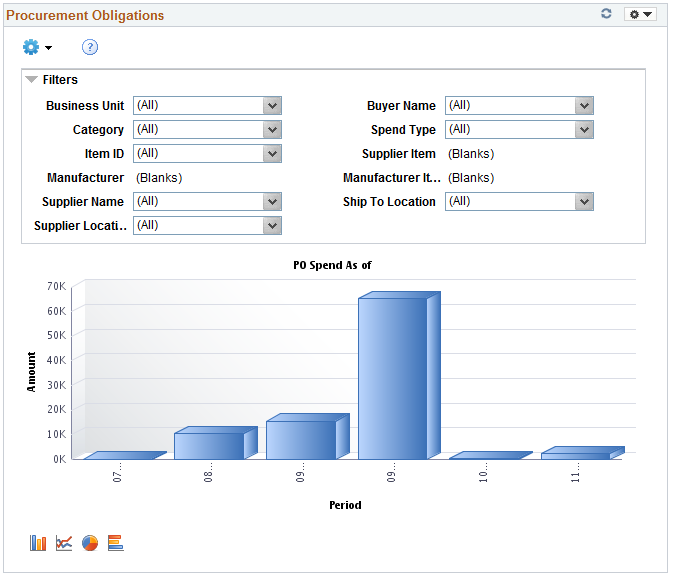
This pagelet displays both PO spend (both contract and non PO contract) over time.
Click on the graph for Detailed View of the data.
This example illustrates the fields and controls on the Procurement Obligations pagelet (2 of 2).
Access the Procurement Spend Analysis pagelet.
This example illustrates the fields and controls on the Procurement Spend Analysis pagelet (1 of 2).
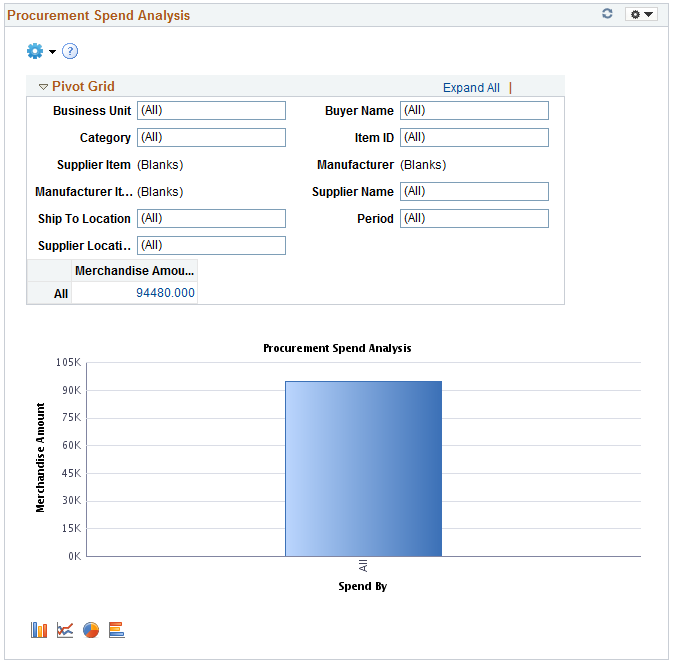
This pagelet displays the PO spend broken down by PO Contract and non PO Contract.
Click on the graph for Detailed View of the data.
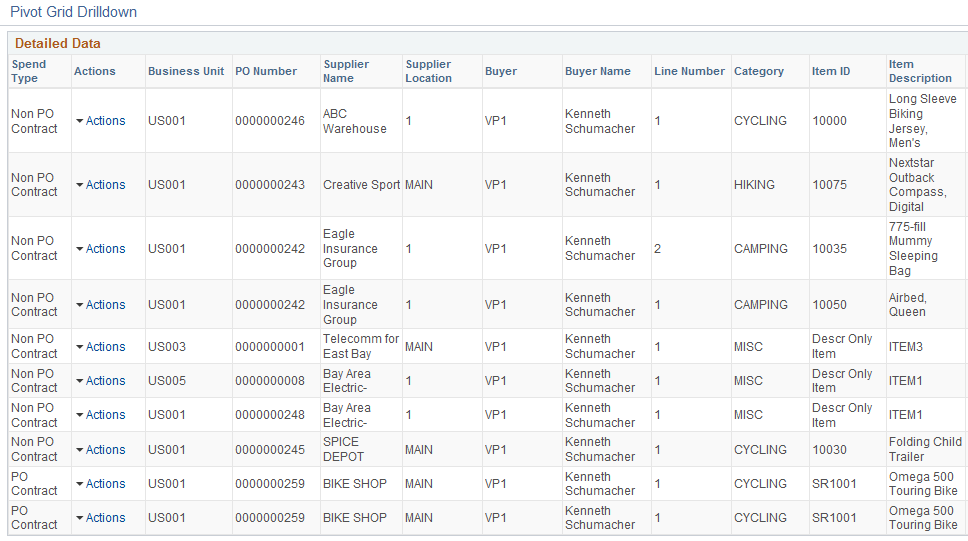
This example illustrates the fields and controls on the Procurement Spend Analysis pagelet (2 of 2).
Access the Top 10 Non Contract Item pagelet.
This example illustrates the fields and controls on the Top 10 Non Contract Item pagelet (1 of 2).
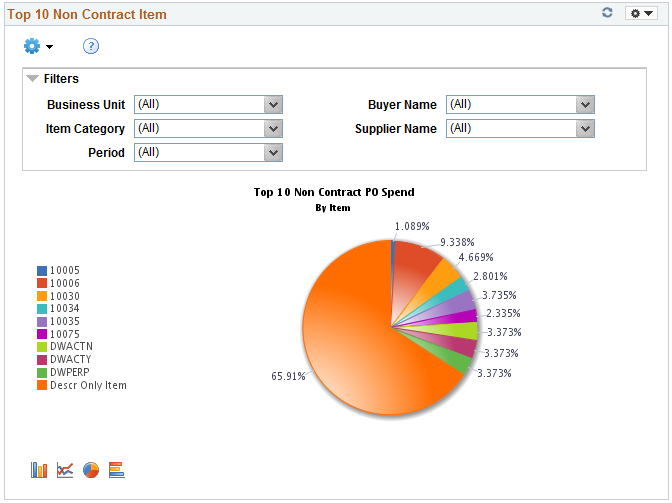
This pagelet displays the Top 10 items based on PO spend in those items. This pagelet includes only non contract spend.
Click on the graph for Detailed View of the data.
This example illustrates the fields and controls on the Top 10 Non Contract Item pagelet (2 of 2).
The Group Contract Summary pagelet displays a Pivot Grid in chart only mode.
Use the Group Contract Summary page to display the total PO spend amount for each Group Contract.
This example illustrates the fields and controls on the Group Contract Summary page (1 of 4).
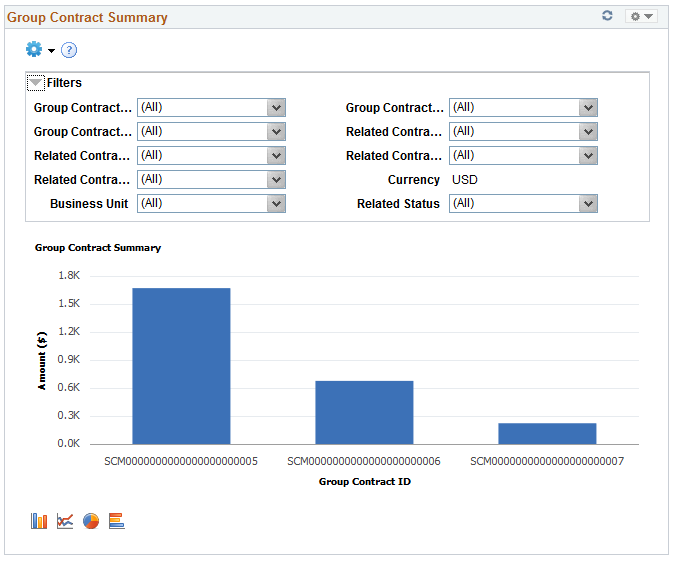
Users can select from a range of data using field prompts, filter data by selecting specific facets values.
Users can click on a bar on the graph and click on the Detailed View to access the Pivot Grid Drilldown page. The page will help the user to see the details that represent the graph.
This example illustrates the fields and controls on the Group Contract Summary page (2 of 4).
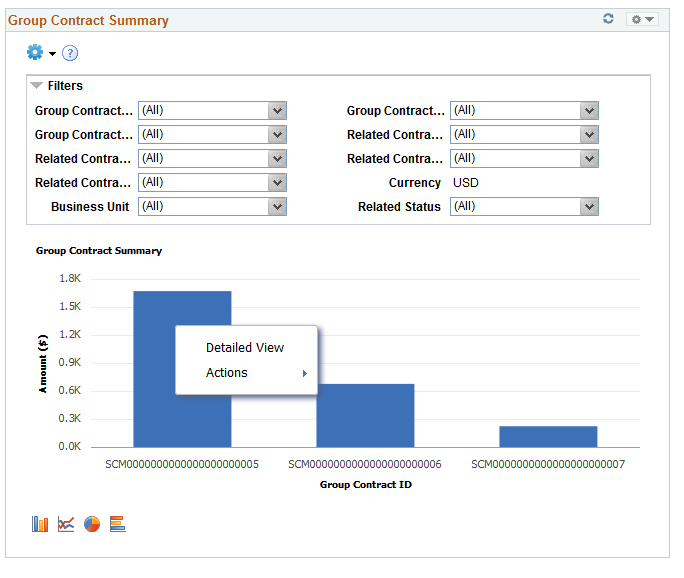
From the Detailed View, a user can use the Actions drop down option to view the related actions for the Group Contracts.
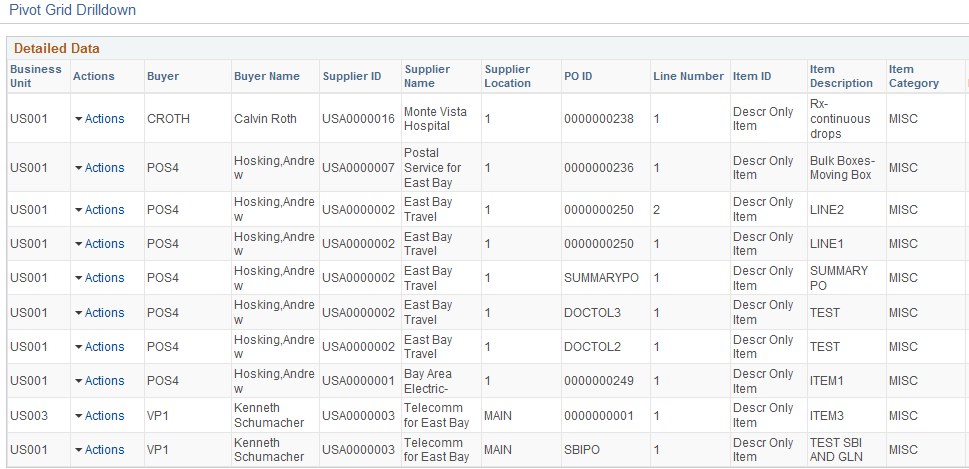
This example illustrates the fields and controls on the Group Contract Summary page (3 of 4). You can find definitions for the fields and controls later on this page.
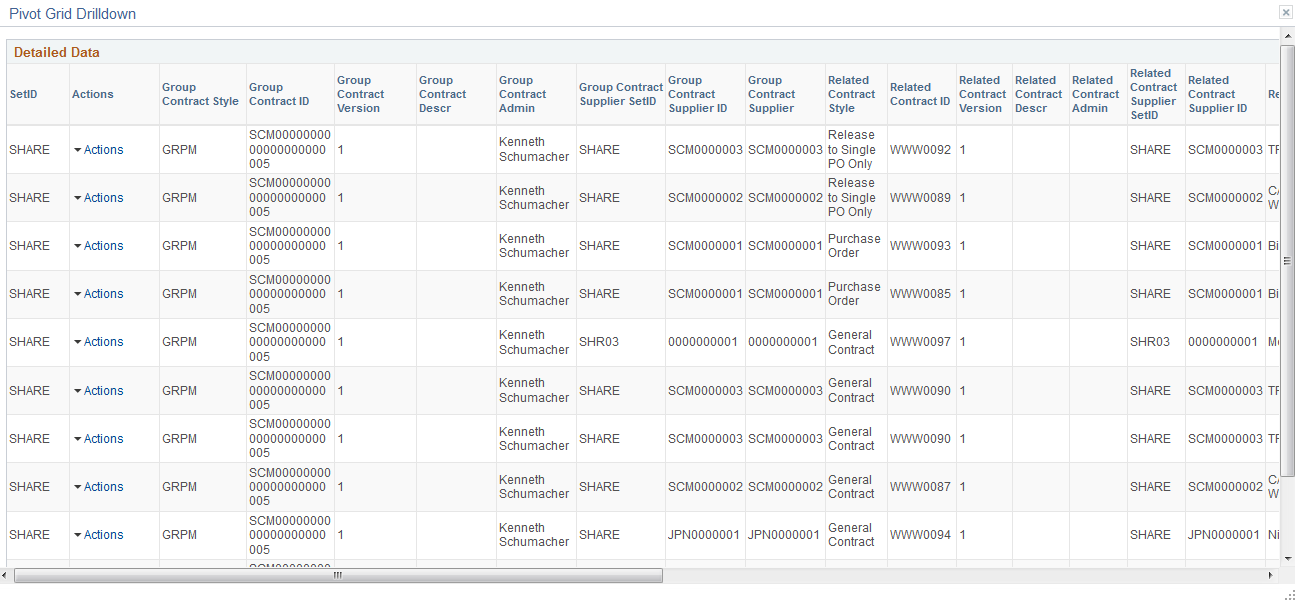
This example illustrates the fields and controls on the Group Contract Summary page (4 of 4). You can find definitions for the fields and controls later on this page.
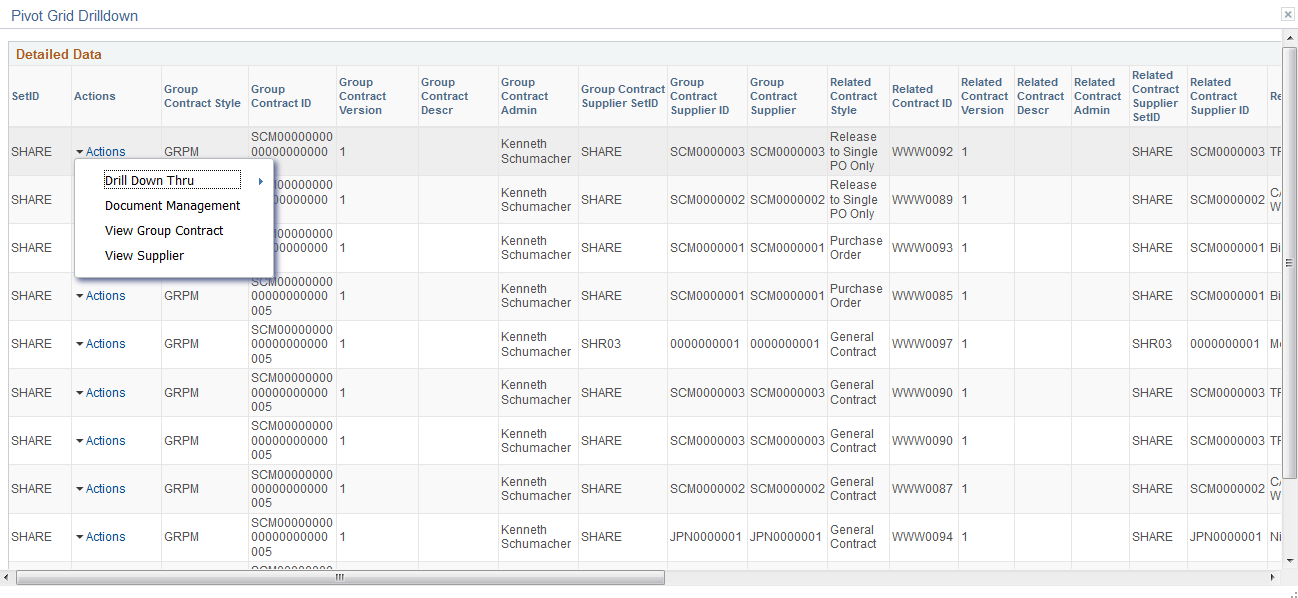
Users can click on the Drill down thru and Group Contract Detail , and the Group Contract Detail pagelet will appear in a new window. Related action will take the user to the Group Contract component to view additional information about the group contract.
The Action drop down also displays the following options:
Document Management. — Click to access the Document Management page for the selected contract.
View Group Contract — Displays the Group Contracts
View Supplier.- Click to access the Supplier Inquiry page for the selected procurement contract.
For Group Contract Detail seeGroup Contract Detail Page
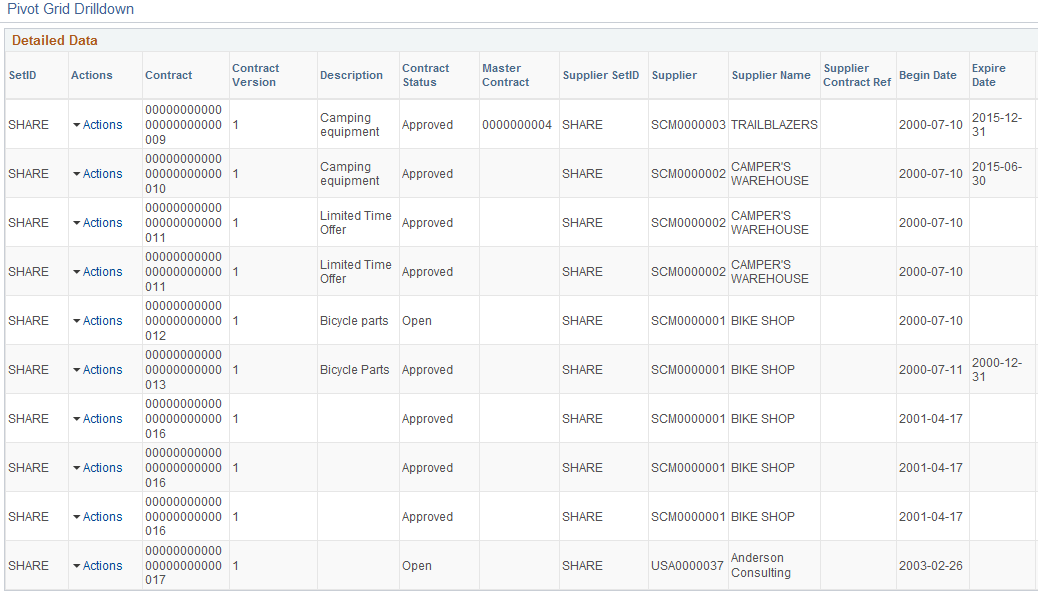
Access the Procurement Contract Spend pagelet.
This example illustrates the fields and controls on the Procurement Contract Spend pagelet (1 of 2).
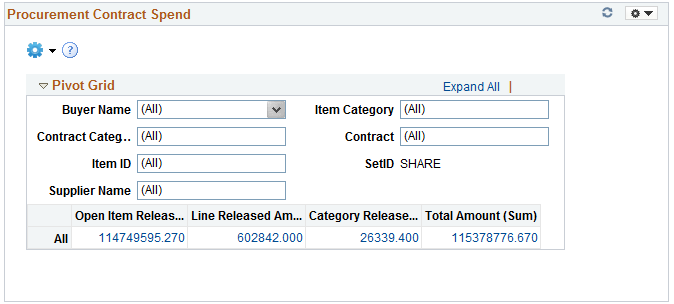
This pagelet displays contract release amounts from a contract perspective. Every active contract is included, but only released lines and categories within those contracts are included.
Click on a Contract Amount for Detailed View of the data.
This example illustrates the fields and controls on the Procurement Contract Spend pagelet (2 of 2).
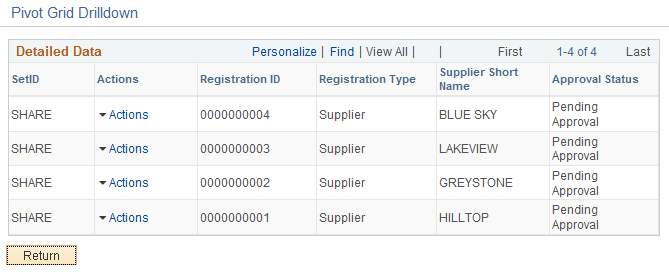
Access the Registration Status pagelet.
The Registration Status pagelet gives you a graphical representation of suppliers or bidders registered in the system.
This example illustrates the fields and controls on the Registration Status Pagelet.
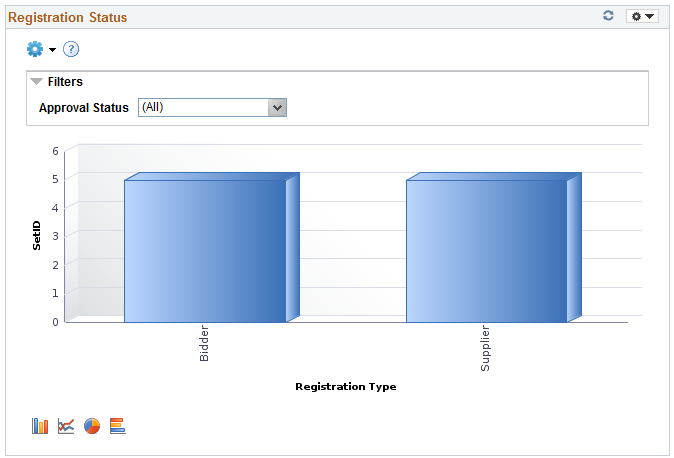
Click on the graph and then click Detailed View to view more details about the supplier. You can also drill down by Registration ID and Supplier Short Name.
From the Detailed View, click Registration Status under the Actions column to navigate to the Manage Request Approval page for more information about the supplier.
This example illustrates the fields and controls on the Registration Status.
Access the Product Categories pagelet.
The Product Categories pagelet displays the Product categories selected during the registration process.
This example illustrates the fields and controls on the Product Categories Pagelet.
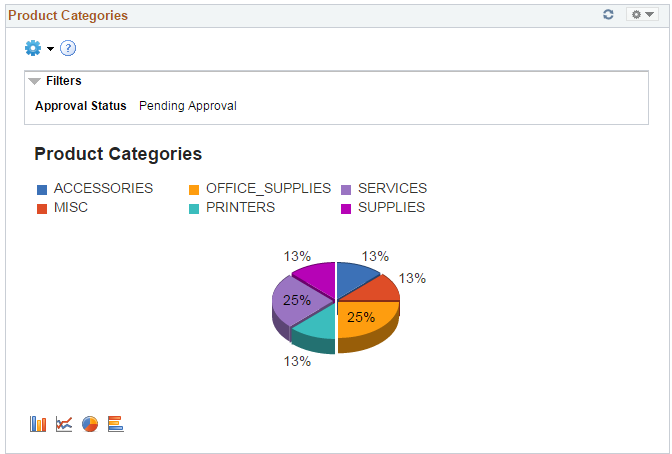
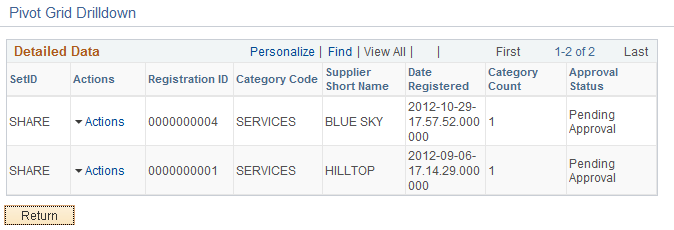
Click on the graph and then click Detailed View to view more details about the product category. You can also drill down by Supplier, SetID, Date Registered, Registration ID, and Supplier Short Name.
From the Detailed View, click Onboarding Status under the Actions column to navigate to the Manage Request Approval page for more information.
This example illustrates the fields and controls on the Product Categories.
Access the Federal Reporting pagelet.
The Federal Reporting pagelet displays the classification information selected during the registration process.
This example illustrates the fields and controls on the Federal Reporting.
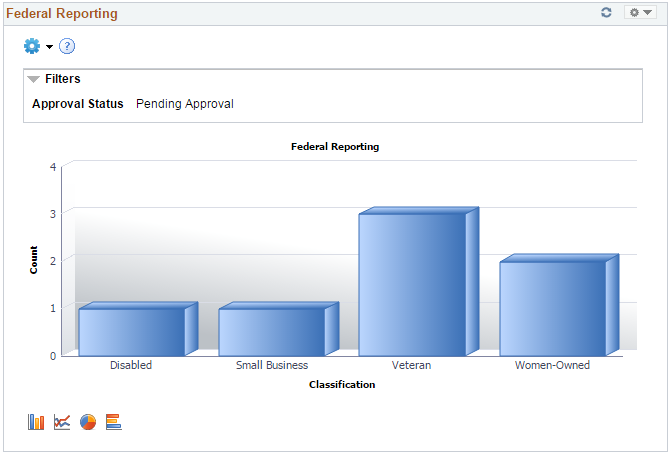
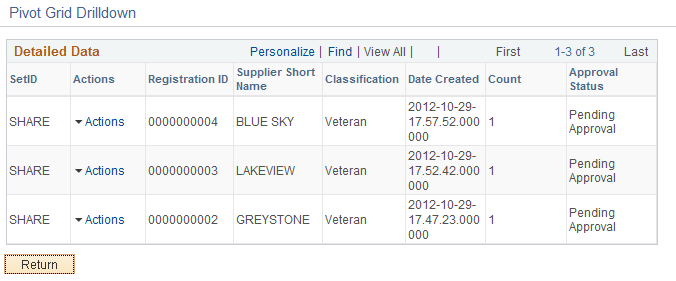
Click on the graph and then click Detailed View to view more details about the registration. You can also drill down by Bidder, SetID, Registration ID, and Supplier Short Name.
From the Detailed View, click Onboarding Status under the Actions column to navigate to the Manage Request Approval page for more information.
This example illustrates the fields and controls on the Federal Reporting Pivot Grid.
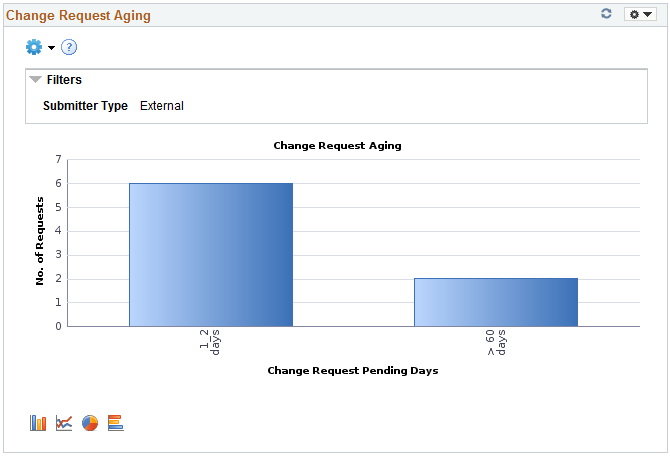
The Change Request Aging pagelet displays a pivot grid which displays the aging breakout of the change requests in pending status.
This example illustrates the fields and controls on the Change Request Aging Chart.
Click on the graph and then click Detailed View to view all the change request transactions that represent the chart. You can also drill down by Submit Date, Requestor, and Short Supplier Name.
This example illustrates the fields and controls on the Change Request Aging Grid.
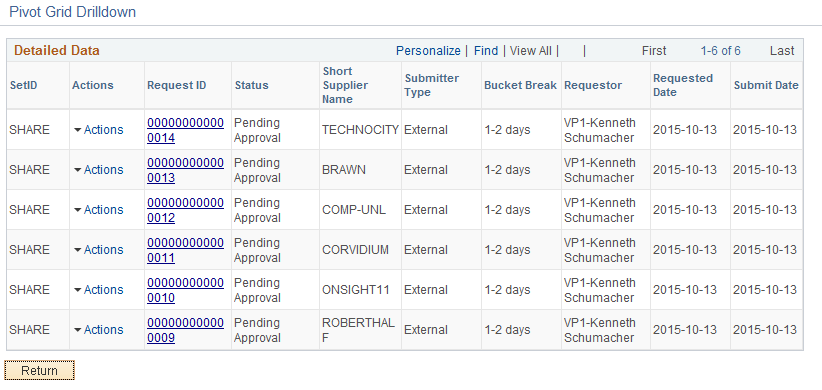
From the Detailed View, the View Approval Information option is available under the Actions column for those transactions that are not approved. Click View Approval Information to navigate to the Manage Request Approval page and view more details about the transaction. The Request ID column has a link to the View History page for the transaction.
The Prompt page for the pivot grid includes a time range selection based on the last updated date.
The Charting Options for the pivot grid includes chart filter selection options for Bucket Break, Requestor, Short Supplier Name, Submit Date, and Submitter Type.
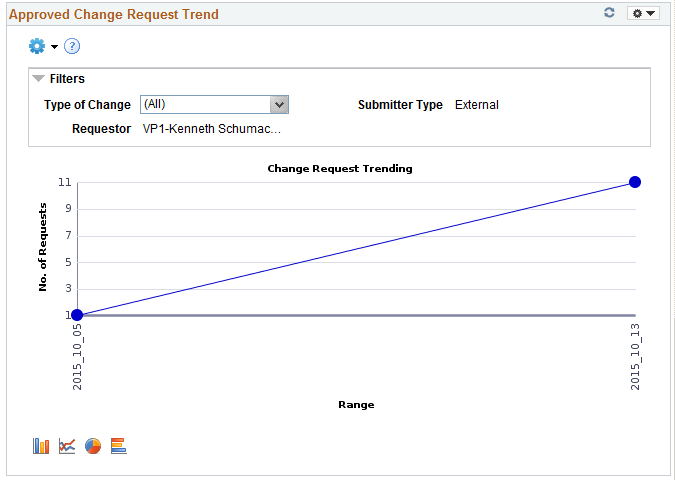
The Approved Change Request Trend pagelet displays change request information across a time period. Only approved transactions are included in the change request trending data.
Trends are available by day, week, month, or quarter. By default, the chart displays all the changes. Users can filter to view either supplier or employee-submitted requests.
This example illustrates the fields and controls on the Approved Change Request Trend Chart.
When you click on a point on the line of the graph, the pivot grid displays detailed information. Click the Request ID link to navigate to the View History page and view more details about the transaction.
This example illustrates the fields and controls on the Approved Change Request Trend Grid.
The Prompt page for the pivot grid includes a time range selection (based on last updated date), and a trend interval. The default option for Trend interval is set as Daily.
The Charting Options for the pivot grid includes chart filter selection options for Date Range, Requestor, Set ID, Short Supplier Name, Submit Date, Submitter Type, and Type of Change.
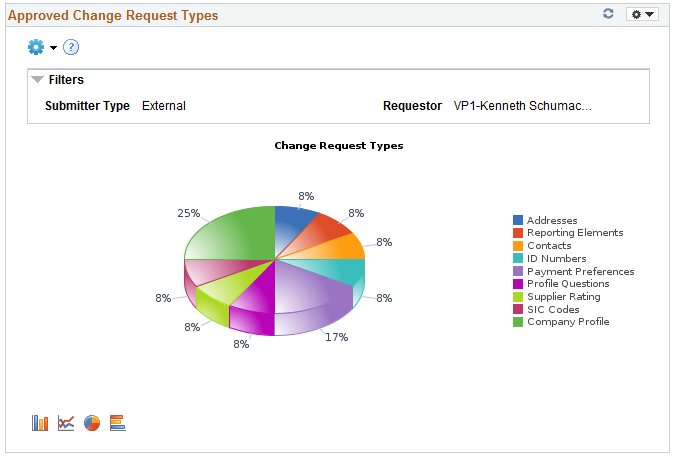
The Approved Change Request Types pagelet displays approved requests and represented by groups.
When a single change requests includes multiple types of changes, each change type will be counted separately. For example, if a change request includes a change to address and a change to contacts, the changes will be reflected in both the change types.
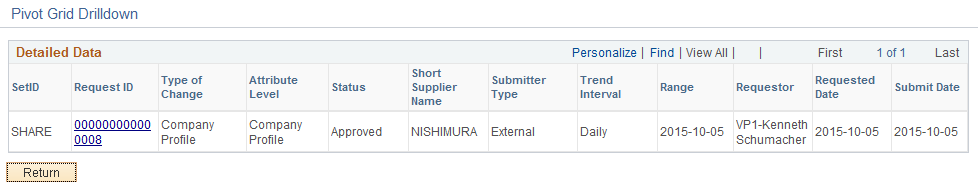
This example illustrates the fields and controls on the Approved Change Request Types Chart.
Click on the graph, and then click Detailed View to view all the change request transactions that represent the chart. You can also drill down by Submit date, Set ID, Short Supplier Name.
This example illustrates the fields and controls on the Approved Change Request Types Pivot Grid.
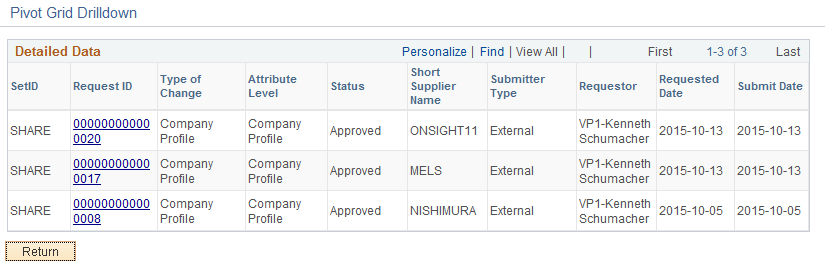
From the Detailed View, click the Request ID link to navigate to the View History page and view more information about the transaction.
The Prompt page for the pivot grid includes a time range selection based on the last updated date.
The Charting Options for the pivot grid includes chart filter selection options of Requestor, Set ID, Short Supplier Name, Submit Date, Submitter Type, and Type of Change.
For additional information about pivot grids, see: PeopleSoft Application Fundamentals, Using the WorkCenter for Financial and Supply Chain Applications.
See the product documentation for PeopleTools: Pivot Grid