Defining Supply Category Analytics
This topic provides an overview of supply category analytics and discusses how to define supply category analytics.
|
Page Name |
Definition Name |
Usage |
|---|---|---|
|
RS_OCP_POOL_SELECT |
Select pools from which to include data for supply category analytics. Define the start date, number of months to display, and data sorting options. |
|
|
RS_OCP_POOL_SEARCH |
Search for pools to add to the supply category analytic. |
|
|
RS_OCP_ANALYTIC |
View the supply category analytics. |
|
|
RS_OCP_ANALYTIC_DTL |
View detail supply category analytic data. |
|
|
PGM_MRS_SCHED |
View the supply details in the master resource schedule. |
One of the key tools for an IT organization is the ability to view supply category capacity, allocation, and availability of resources by time period at the organizational and resource pool level. It is also important to be able to view project assignments as well as task assignments on the resource usage analytic.
Pool managers can quickly and easily view the availability of the resources in their pool for a given time period. The supply category analytic can be generated for a maximum of six months.
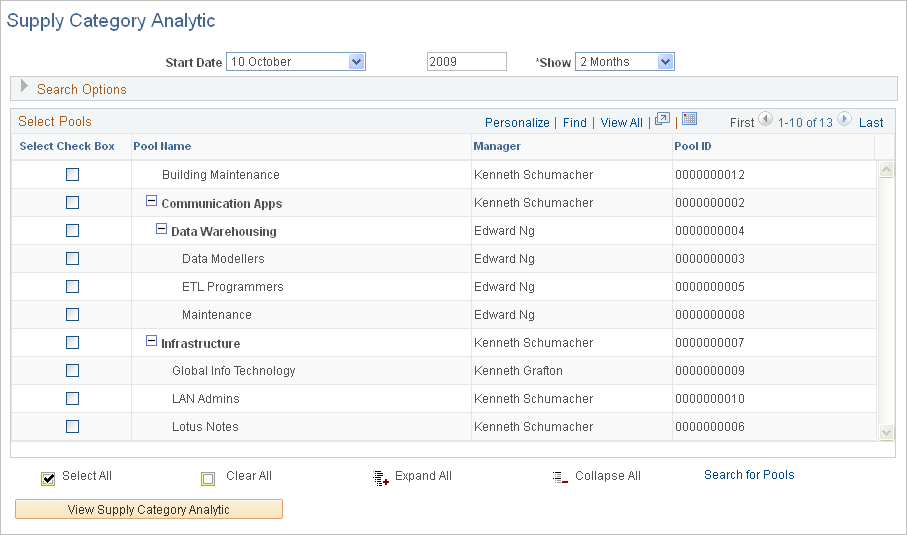
Use the Supply Category Analytic (parameters) page (RS_OCP_POOL_SELECT) to select pools from which to include data for supply category analytics.
Define the start date, number of months to display, and data sorting options.
Navigation:
This example illustrates the fields and controls on the Supply Category Analytic parameters page. You can find definitions for the fields and controls later on this page.
Field or Control |
Description |
|---|---|
Start Date |
Enter the month and year from which the system will generate and display the supply category analytic. |
Show |
Enter the time frame for which system will generate the analytic, from 1 Month to 6 Months. |
Search Options |
Expand this group box and select attributes to specify how the analytic data is grouped and displayed, using the Sort By and Then By fields to specify a supply category. You can select a primary and a secondary attribute to generate and view the data using the Group By and View In options. |
Select Pools |
Select the corresponding check boxes for each pool name for which the system will generate the analytic. All active resource pools in the system appear in this group box. If you select a parent pool, the system automatically selects its children as part of the analytic scope. You can select child pools independent of the parent pool. Only the pools that are selected on this page are in the scope for the supply category analytic. |
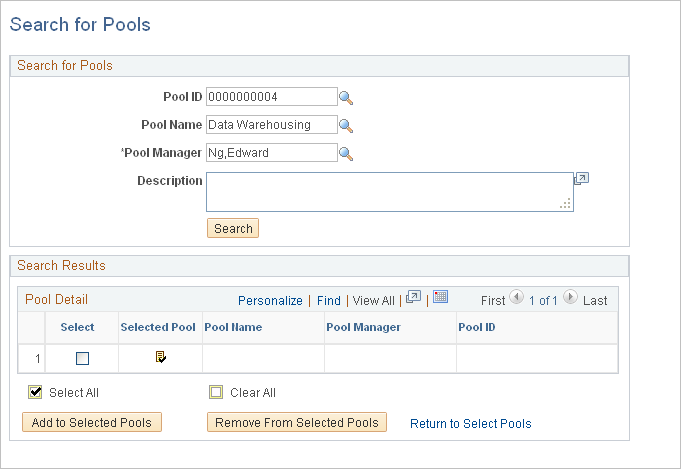
Use the Search for Pools page (RS_OCP_POOL_SEARCH) to search for pools to add to the supply category analytic.
Navigation:
Click the Search for Pools link on the Supply Category Analytic parameters page.
This example illustrates the fields and controls on the Search for Pools page. You can find definitions for the fields and controls later on this page.
Field or Control |
Description |
|---|---|
Search for Pools |
Search for pools by pool name, manager, ID and description to find and select pools to add to the supply category analytic. The search results appear in the Search Results group box. The list of pools in the Search Results group box is not hierarchical. |
Select |
Select the check box for each pool in the search results that you want to add to the supply category analytic scope. |
|
The Selected Pool icon indicates that the corresponding pool is selected on the Supply Category Analytic parameters page. |
Add to Selected Pools |
Click to add the selected pools to the Supply Category Analytic parameters page with the check box selected. If you select a parent pool, the system automatically selects the child pools. |
Remove From Selected Pools |
Select rows that have the Selected Pool icon, and click Remove From Selected Pools to remove the selected pools from the Supply Category Analytic parameters page. |
Return to Select Pools |
Click to return to the Supply Category Analytic parameters page. |

Use the Supply Category Analytic page (RS_OCP_ANALYTIC) to view the supply category analytics.
Navigation:
Click the View Supply Category Analytic button on the Supply Category Analytic parameters page.
This example illustrates the fields and controls on the Supply Category Analytic page. You can find definitions for the fields and controls later on this page.
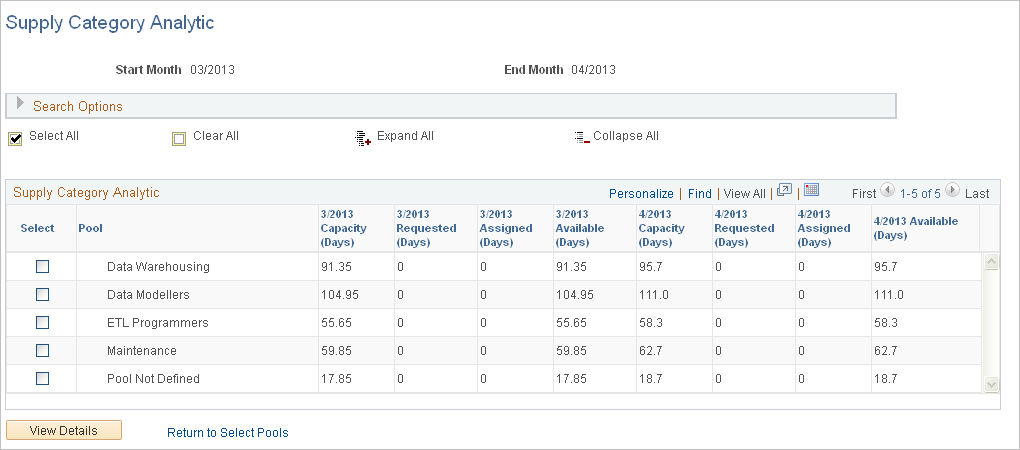
Select the rows for which you want to drill down to view details.
If you sort by Region then by Project Role, when you select a region, the system selects all roles that belong to that region.
Field or Control |
Description |
|---|---|
<description> |
The title of the second column in the Supply Category Analytic group box is based on the values that you select for the Sort By and Then By sort options. |
Capacity |
Displays the resource capacity based on the selected sort and group options. For example, if you select a Sort By option of Region, a Then By option of Project Role, and a Group By option of Weekly, this column displays the capacity of each role in the region for each calendar week for the time frame between the start month and the end month. The Start Month and the View In unit also appear in the column heading. |
Requested |
Displays the requested days or hours based on the selected sort and group options. For example, if you select a Sort By option of Region, a Then By option of Project Role, and a Group By option of Weekly, this column displays the requested days or hours of each role in the region for each calendar week for the time frame between the start month and the end month. |
Assigned |
Displays the assigned days or hours based on the selected sort and group options. For example, if you select a Sort By option of Region, a Then By option of Project Role, and a Group By option of Weekly, this column displays the assigned days or hours of each role in the region for each calendar week for the time frame between the start month and the end month. |
Available |
Displays the difference between capacity and assigned days or hours based on the selected sort and group options. For example, if you select a Sort By option of Region, a Then By option of Project Role, and a Group By option of Weekly, this column displays the difference between capacity and assigned days or hours of each role in the region for each calendar week for the time frame between the start month and the end month. |
View Details |
Click to view the details for selected resources, which make up the capacity for a supply category. |
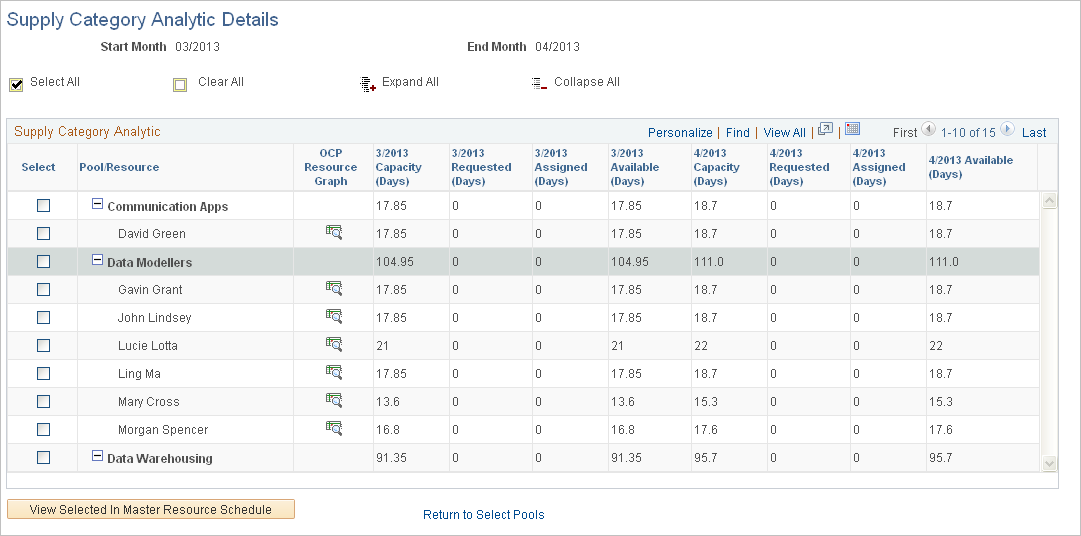
Use the Supply Category Analytic Details page (RS_OCP_ANALYTIC_DTL) to view detail supply category analytic data.
Navigation:
Click the View Details button on the Supply Category Analytic page.
This example illustrates the fields and controls on the Supply Category Analytic Details page. You can find definitions for the fields and controls later on this page.
Field or Control |
Description |
|---|---|
|
Select the resources to include in the resource scope of the master resource schedule, and click View Selected In Master Resource Schedule to view the schedule of the selected resources. |
|
Click to access the Operational Capacity Analytic chart for the corresponding resource. |
View Selected In Master Resource Schedule |
Click to view the master resource schedule for the selected resources. |


Use the Master Resource Schedule page (PGM_MRS_SCHED) to view the supply details in the master resource schedule.
Navigation:
Click the View Selected In Master Resource Schedule button on the Supply Category Analytic Details page.
This example illustrates the fields and controls on the Master Resource Schedule page.
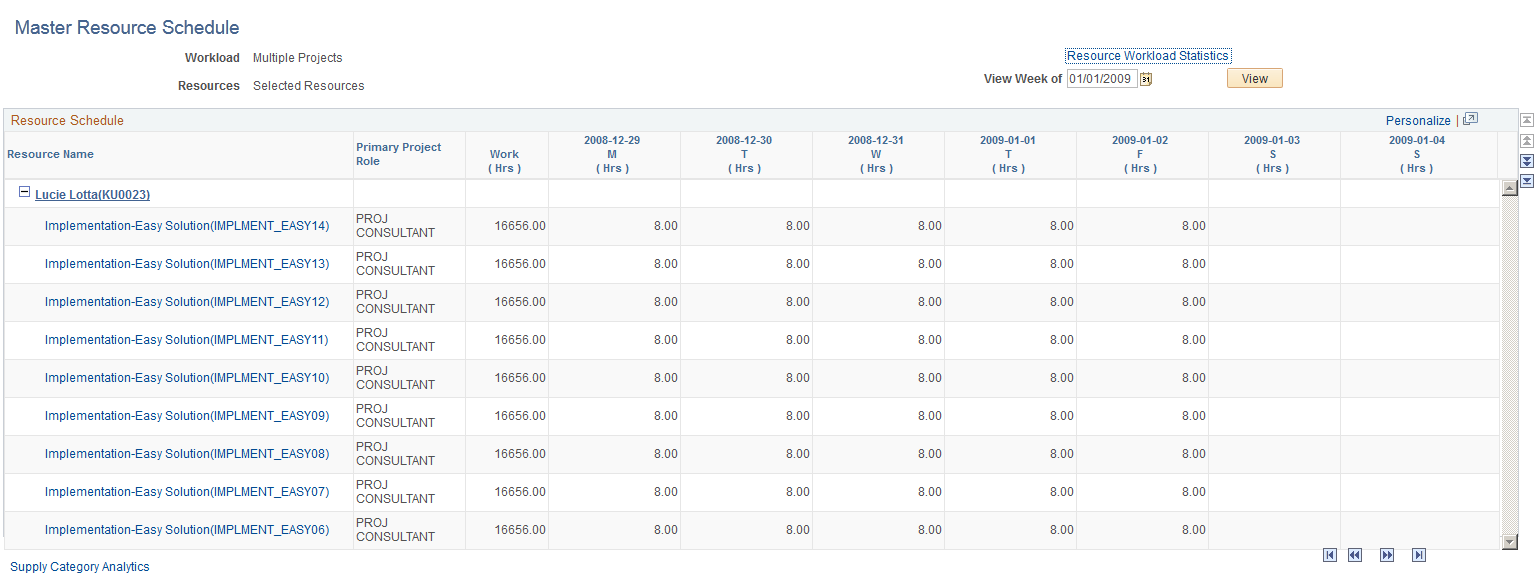
The master resource schedule is discussed in the PeopleSoft Program Management 9.2.
As resources are added or moved to different pools, or requested or assigned to assignments, you must maintain up-to-date data in the Supply Category Analytics Cache table. To do this, select the Refresh Supply Category Analytics Cache option on the Cache Administration - Miscellaneous page and run the process.
Note: When you access the Master Resource Schedule page from the Supply Category Analytic Details page, the Master Resource Schedule may show more work for a resource than the resource's number of assigned days that appears on the Supply Category Analytic Details page. This is because the Master Resource Schedule includes any work where the resource is in a Considered status for the project.