Creating Supply Forecast Models
This topic provides overviews of the supply forecast model and resources and capacity calculations, and discusses how to create Supply Forecast models.
|
Page Name |
Definition Name |
Usage |
|---|---|---|
|
RS_FR_SUP_SEL_POOL |
Add a new supply forecast and select the pools to add to the supply forecast. |
|
|
RS_FR_POOL_SRCH |
Search for pools by pool name, pool manager, or pool ID to be added to the supply forecast. |
|
|
RS_FR_SUP_SUMMARY |
View the summarized information for a supply forecast. The page contains links to all the other supply forecast functions. After you select the pools that you want to include in the supply forecast, you can view the calculated capacity for all the resources (generic and named resources) that are in the selected resource pools. The data is summarized first by pool and then by role. |
|
|
RS_FR_SUP_DTL |
View the supply details for all of the pools or one particular pool in the supply forecast. |
|
|
RS_FR_SUP_MOD_SUP |
Add or subtract the actual supply in the forecast to, for example, model different scenarios for a given calculated resource pool role row. |
|
|
RS_FR_SUP_ADD_SUP |
Add additional supply to a forecast. The system validates the dates you enter to ensure that the start date is not greater than the end date and that the date range does not exceed 24 months. When adding a new value, you can manually enter the supply forecast ID or the system can generate it. |
|
|
RS_FR_SUP_UTIL |
Change the utilization percentage for a forecast. |
|
|
RS_FR_SUP_MOD |
View details of modifications made to supply forecasts. |
|
|
RS_SUP_ACE_PAGE |
Analyze supply forecast data by supply categories and months. |
|
|
RS_SUP_CHARTS |
View graphical summarized capacity information by supply category. |
|
|
RS_FR_COPY |
Create copies of existing forecasts with same date range as the original forecast. Use this page to copy supply or demand. |
Supply consists of human resources that are available to do work. A supply forecast is an aggregated projection of all labor resource capacity based on resource pool headcount forecasts and utilization. A supply forecast model provides an organization with a way to gain an accurate, concise picture of its forecasted resource capacity over a period of time.
After resources are grouped in resource pools, pool managers can define a capacity percent for each resource (named or generic) in their pool and account for future capacity in those resource pools. This information is combined with the preset, region-based utilization percentage to create a supply forecast that calculates the total capacity for each resource pool. Three other supply categories (role, region, and personnel status) further segregate the data.
The system also calculates the capacity of each resource (named and generic) within each of the selected pools for the selected date range. The data is presented in a summarized format and initially displayed by pool and role (within each pool). You have the option to view the data by other supply categories as well as in graphical format. In addition, you can view the resource information using PeopleSoft Analytic Calculation Engine interactive analysis.
The maximum range for supply forecasting is 24 months.
Note: All data in supply forecasts, demand forecasts, and consolidated scenarios are point-in-time. This means that if additional resource pools or demand data change or become available on the transactional side, it does not affect any existing forecasts or scenarios—unless you specifically choose to add them afterwards. In other words, forecasts are created based on the picture of the supply and demand as of the date the forecast was created. If pools and capacity are added a week later, for example, that information does not appear in the supply forecast. You can manually add the supply or new resource pools to the forecast or create a new forecast to capture the latest supply data.
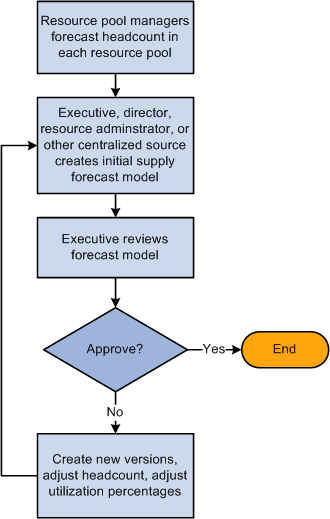
This flowchart shows the supply forecast model process:
You use the Supply Forecast component (RS_FR_SUPPLY) to create, view, and modify supply forecasts.
This section discusses:
Resources without roles.
Resource capacity calculations.
Resources Without Roles
Because role is not a required supply category for a resource, it is possible that the forecast will encounter resources that do not have a role specified. If the forecast encounters any resources with a blank Role field, the system displays the capacity for these resources with a label of Undefined Role. For example, this table lists the resources within Pool A:
|
Name |
Role |
Capacity |
|---|---|---|
|
Michael Fontes |
DBA |
100 days |
|
Serena Clemens |
DBA |
120 days |
|
Kelly Orihood |
QA |
100 days |
|
Justine Yee |
50 days |
|
|
Christopher Brown |
75 days |
The capacity breakdown is:
DBA: 220 days
QA: 100 days
Undefined Role: 125 days
Resource Capacity Calculations
The system calculates capacity in either hours or days. Organizations decide at the installation level if they will display and calculate capacity in hours or days. Capacity is calculated by selecting each resource that is part of the selected pools for the time period that the forecast is being created. The system looks up the capacity percentage that was set in that pool for each resource. The capacity is multiplied by the number of days or hours in the forecast period. Finally, a utilization percentage (based on the resource's region) is applied. Therefore:
The following scenarios explain how capacity is calculated. This table presents the information that is used in the subsequent scenarios:
|
Parameter |
Value |
|---|---|
|
Supply forecast period |
June, 2004 - May, 2005 (12 months) |
|
Display capacity in |
Days (installation setting) |
|
Number of hours in a day |
8 (installation setting) |
|
Number of days in a month |
20 (installation setting) |
|
One full-time resource |
20 (Days per month = one full-time resource) |
|
Utilization percentage for USA |
85 percent |
Scenario 1: Resource is in one pool with the same pool capacity percentage for the entire period.
|
Parameter |
Value |
|---|---|
|
Resource name |
Generic |
|
Role |
DBA |
|
Pool capacity percentage |
100 |
|
Region |
USA |
Scenario 2: Resource is in one pool with one pool capacity percentage for one full month, and another pool capacity percentage for the rest of the period.
|
Parameter |
Value |
|---|---|
|
Resource name |
Alysha Kibble |
|
Role |
QA Lead |
|
Pool capacity percentage |
50 (6/1/04 - 6/30/04) 100 (7/1/04 - no end date) |
|
Region |
USA |
Total capacity for the forecast period is 195.5 days.
Scenario 3: Resource is in one pool with one pool capacity percentage for a partial month, and another pool capacity percentage spanning multiple months.
|
Parameter |
Value |
|---|---|
|
Resource name |
Corinne Brown |
|
Role |
Project Manager |
|
Pool capacity percentage |
50 (6/1/04 - 7/21/04) 100 (7/22/04 - no end date) |
|
Region |
USA |
This scenario is one of the more complicated situations that may be present. The dates are broken down monthly (or by fractions of months when the capacity changes mid-month):
Total capacity for the forecast period is 189.7 days.
Supply full-time resource takes into account all the regions found in the supply forecast. For example, if the number of days is 6000, the region utilization percent is 80 (since each region can have a different percent each one would have to be included in the calculations), the days per month for a full-time resource is 20, and the number of months in the scenario date range is 12, the calculation is:
Note: Full-time resources are calculated differently between the Supply Summary page and the Supply Details page.
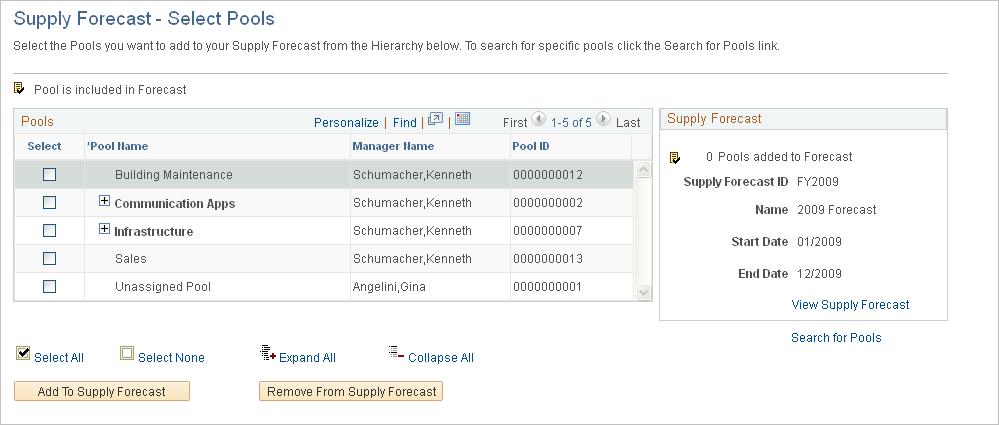
Use the Supply Forecast - Select Pools page (RS_FR_SUP_SEL_POOL) to add a new supply forecast and select the pools to add to the supply forecast.
Navigation:
Click the Continue Selecting Pools link in an existing supply forecast.
This example illustrates the fields and controls on the Supply Forecast - Select Pools page. You can find definitions for the fields and controls later on this page.
Field or Control |
Description |
|---|---|
Select |
Select this check box to designate that a pool is selected for the forecast. When you select a pool that has child pools, all the child pools should be selected as well. You can clear a parent pool without clearing the associated child pools. |
Pool Name |
Displays the description of the available pools from which to select. |
Manager Name |
Displays the name of the pool manager. |
Add To Supply Forecast |
Click this button to add the selected pools to the supply forecast. |
Remove From Supply Forecast |
Click this button to remove the selected pools from the supply forecast. |
Search for Pools |
Click this link to access the Search for Pools page where you can provide pool name, pool manager name, and pool ID criteria to limit the search and selection of specific pools. |
View Supply Forecast |
Click this link to view the summarized information for a supply forecast. |
|
The Selected Pool icon appears after you select a resource pool and click the Add To Supply Forecast button to add the pool to the supply forecast. |

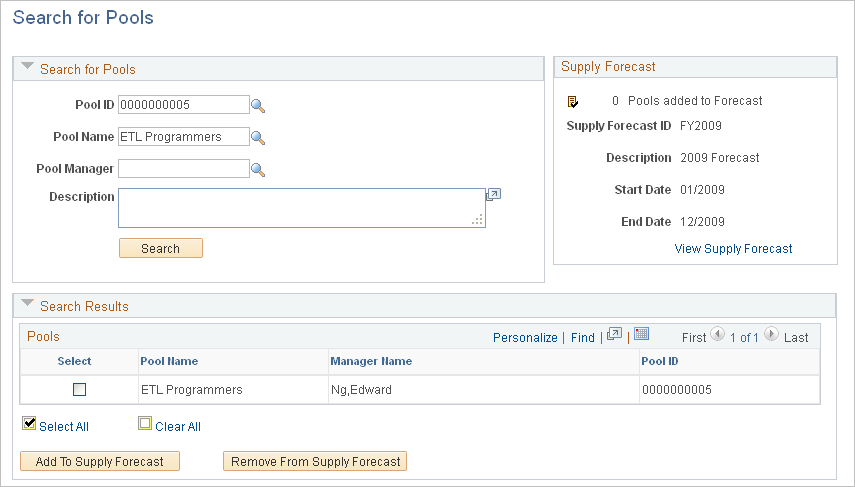
Use the Search for Pools page (RS_FR_POOL_SRCH) to search for pools by pool name, pool manager, or pool ID to be added to the supply forecast.
Navigation:
Click the Search for Pools link on the Supply Forecast - Select Pools page.
This example illustrates the fields and controls on the Search for Pools page. You can find definitions for the fields and controls later on this page.
Field or Control |
Description |
|---|---|
Select |
After you enter search criteria in the Search for Pools group box and view results in the Search Results group box, select the pools that you want to add to the forecast. |
Add To Supply Forecast |
Click this button to add the selected pools to the forecast. When you click this button, the Selected Pool icon appears next to the pool name. Click the Return to Select Pools link to return to the Supply Forecast - Select Pools page. |
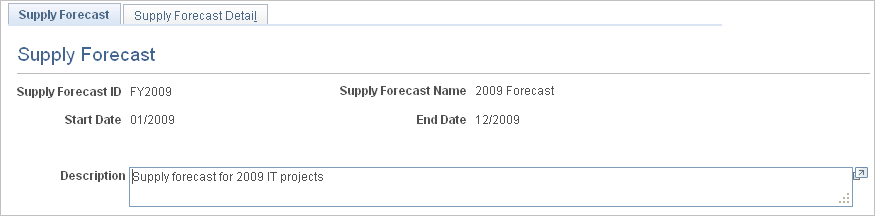
Use the Supply Forecast page (RS_FR_SUP_SUMMARY) to view the summarized information for a supply forecast.
The page contains links to all the other supply forecast functions. After you select the pools that you want to include in the supply forecast, you can view the calculated capacity for all the resources (generic and named resources) that are in the selected resource pools. The data is summarized first by pool and then by role.
Navigation:
Click the View Supply Forecast link on the Supply Forecast - Select pools page.
This example illustrates the fields and controls on the Supply Forecast page (1 of 2). You can find definitions for the fields and controls later on this page.
This example illustrates the fields and controls on the Supply Forecast page (2 of 2). You can find definitions for the fields and controls later on this page.
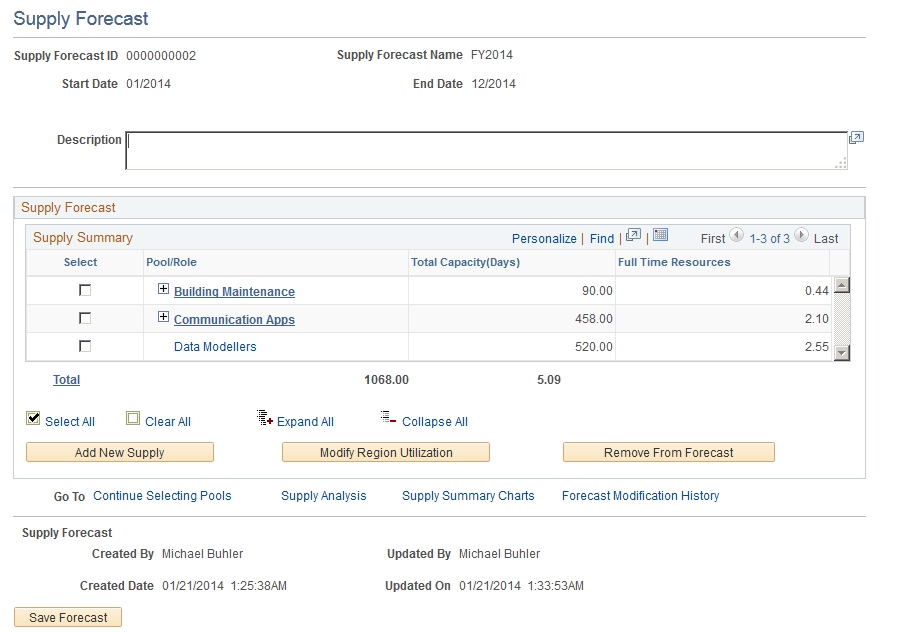
Field or Control |
Description |
|---|---|
Description |
Enter a description for this supply forecast. |
Pool/Role |
Displays the pool name and associated roles for the pool. Click a pool link in this column to view all the calculated capacity in detail for that role within the specific pool. You can remove an entire pool from the supply forecast by selecting the adjacent check box and clicking the Remove From Forecast button. |
Total Capacity(Hours) or Total Capacity(Days) |
Based on your installation choice, this column displays the total calculated resource capacity in the pool for the date range specified for the supply forecast displays in hours or days. The data is summarized first by pool and then by role. |
Full Time Resources |
Displays the total number of full-time resources in the pool for the date range specified for the forecast. The common denominator for the calculation is the number of months included in the forecast. |
Total |
Displays the total capacity and full-time resources. Click this link to view supply details for all the pools in the supply forecast. |
Add New Supply |
Click to access the Add New Supply To Forecast page and select a date range within the forecast periods, pool, role, personnel status, region, and amount of capacity that you want to add to the supply forecast capacity. |
Modify Region Utilization |
Click to access the Modify Region Utilization page and adjust the region utilization percentage for the current supply forecast. |
Remove From Forecast |
Click to remove selected pool data from the forecast. |
Continue Selecting Pools |
Click to access the Supply Forecast - Select Pools page and refine the pool selection for this forecast. |
Supply Analysis |
Click to access the Supply Analysis page to view and analyze supply forecast data by the four supply categories with monthly views. |
Supply Summary Charts |
Click to access the View Supply Forecast Charts page and view charts based on the supply categories. |
Forecast Modification History |
Click to access the Supply Forecast Modification History page and view each modification to the actual supply in the forecast. |
Use the Supply Forecast Detail page (RS_FR_SUP_DTL) to view the supply details for all of the pools or one particular pool in the supply forecast.
Navigation:
Click the View Supply Forecast link on the Supply Forecast - Select Pools page.
Click the Total link on the Supply Forecast page.
Click a pool name in the Supply Summary grid on the Supply Forecast page.
This example illustrates the fields and controls on the Supply Forecast Detail page. You can find definitions for the fields and controls later on this page.
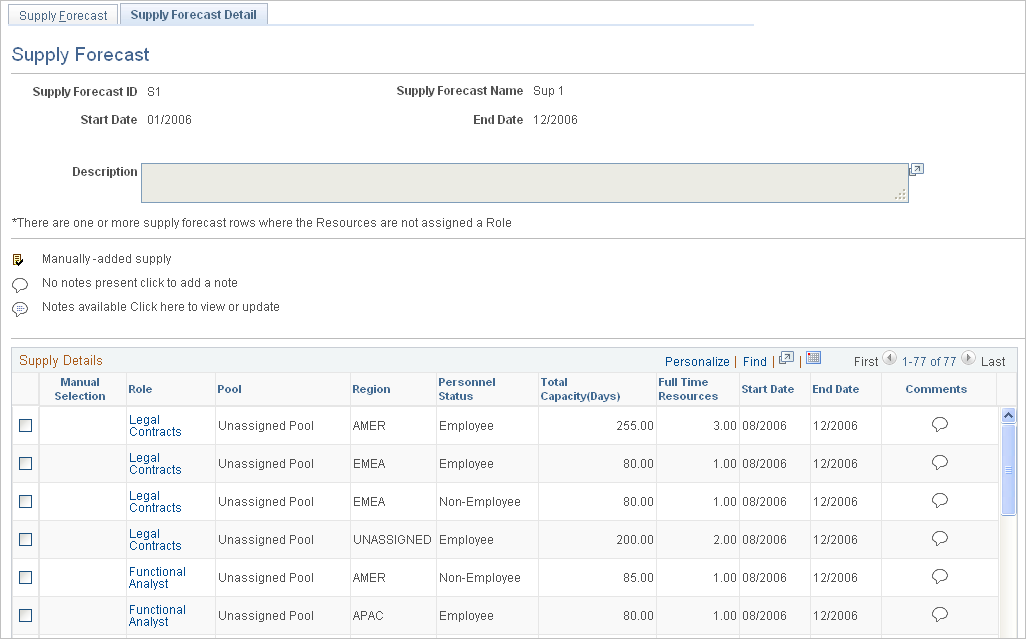
Field or Control |
Description |
|---|---|
Description |
Enter a description for this supply forecast. |
|
Indicates that the row was added to the forecast by using the Add New Supply page. |
|
Click this icon to enter comments about the supply row. If the icon contains lines, comments already exist for the row. If the icon does not contain lines, no comments exist for the row. |

 and
and 
Supply Details
Field or Control |
Description |
|---|---|
Role, Pool, Region, and Personnel Status |
These are the supply categories for the resource capacity that appears on the row. Click the role to modify the capacity that appears in the row. |
Total Capacity (Hours) or Total Capacity (Days) |
Displays the resource capacity for the row. The value is based on the unit of measure—either days or hours—selected during installation. |
Full Time Resources |
Displays the calculation of full-time resources for each row. The system calculates full-time resources based on the start and end dates on each row in the Supply Details grid. You can add a new row of supply that is within the forecast date range but that does not cover the entire range. It's important to note that the calculation is based on the date range specified in that row. |
Start Date and End Date |
Displays the start and end date for the supply forecast. The system uses these dates to calculate capacity and full-time resources. All rows that are calculated from the resource pools must be the same date range as the forecast period. You can add new supply and specify date ranges within the forecast period. The capacity and full-time resources that the system calculates for the added rows are only based on the dates you entered on the Add New Supply page. |
Use the Modify Supply in Forecast page (RS_FR_SUP_MOD_SUP) to add or subtract the actual supply in the forecast to, for example, model different scenarios for a given calculated resource pool role row.
Navigation:
Click a link in the Role column on the Supply Forecast Detail page.
This example illustrates the fields and controls on the Modify Supply in Forecast page. You can find definitions for the fields and controls later on this page.
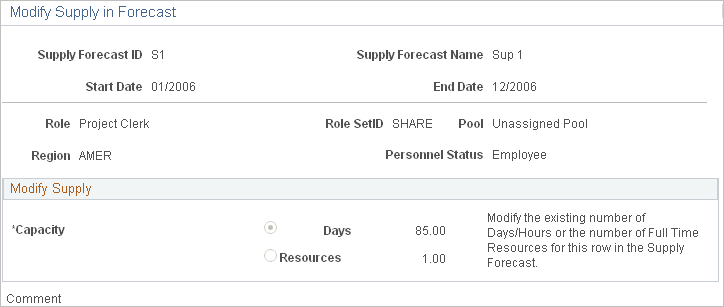
The page displays supply categories for the selected row—role, region, pool, and personnel status. You cannot change the supply categories of an existing row that was calculated from a resource pool.
Field or Control |
Description |
|---|---|
Capacity |
Select capacity Days or Hours, based on the unit of measure installation setting for capacity planning), or Resources. The capacity values appear that exist for the row. The values can be positive or negative numbers. Enter a value in one of the boxes. The system calculates the corresponding value (capacity in days or hours, or full-time resources) in the Supply Details grid after you click OK. The new calculation does not appear on the Modify Supply in Forecast page until you reenter that page from the Supply Forecast Detail page. |
Note: Changes made to either the Days or Resources fields are not saved unless the respective option is selected.
Use the Add New Supply To Forecast page (RS_FR_SUP_ADD_SUP) to add additional supply to a forecast.
Navigation:
Click the Add New Supply button on the Supply Forecast page.
This example illustrates the fields and controls on the Add New Supply to Forecast page. You can find definitions for the fields and controls later on this page.
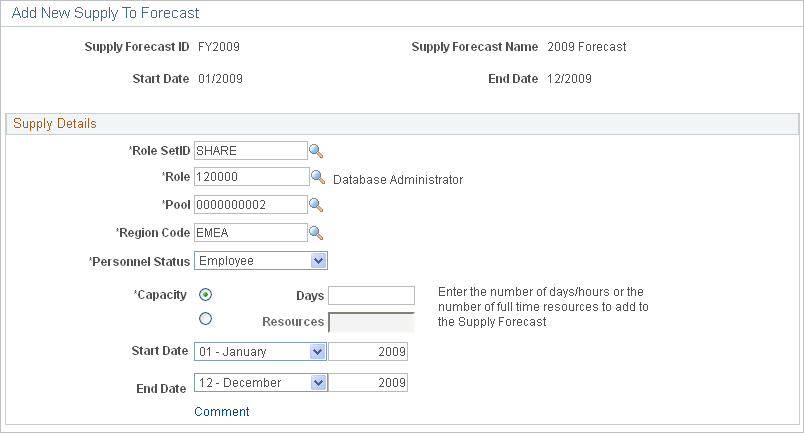
Note: You can enter the same supply categories as an existing row, including the same date ranges.
Field or Control |
Description |
|---|---|
Role SetID and Role |
Enter a SetID and any valid role. You can enter roles that are not yet in the forecast. |
Pool |
Enter a pool ID. If you later remove a pool from the forecast, any new supply rows that you added for that pool are removed from the forecast as well. |
Region Code |
Enter any valid region. You can enter regions that are not yet in the forecast. |
Personnel Status |
Select Employee or Non-Employee. |
Capacity |
Select Hours or Days, based on the installation settings, and enter the number of hours or days to add to the supply forecast. Alternatively, select Resources and enter the number of full-time resources to add to the supply forecast. |
Start Date and End Date |
Enter the date range over which you want to add this supply in the model. The dates must be within or equal to the supply forecast date ranges. The forecast start and end dates appear by default. |
Comment |
Click this link to add comments about this new supply. |
Use the Modify Region Utilization page (RS_FR_SUP_UTIL) to change the utilization percentage for a forecast.
Navigation:
Click the Modify Region Utilization button on the Supply Forecast page.
This example illustrates the fields and controls on the Modify Region Utilization page. You can find definitions for the fields and controls later on this page.
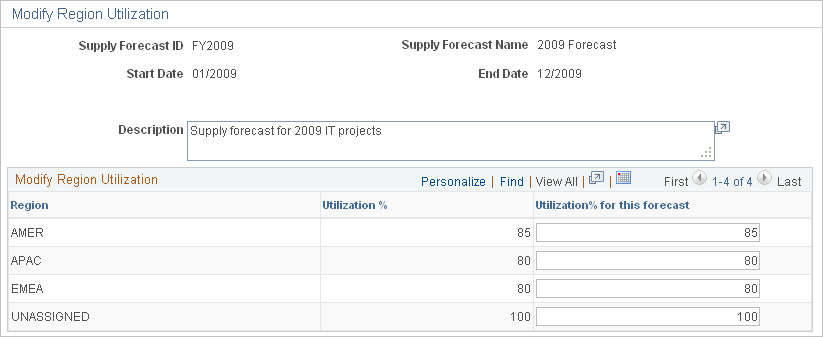
Note: The utilization values only apply to the particular forecast and do not override the system region utilization percent.
Field or Control |
Description |
|---|---|
Description |
Enter a description of the modifications. |
Region and Utilization % (utilization percent) |
Displays all the regions that are set up in the system and the utilization percent for the forecast. |
Utilization % for this forecast |
Enter a different utilization percent. The default value is equal to the Utilization % value. The system uses the value you enter to recalculate the supply in the current supply forecast. The value that you enter here remains with this forecast whenever you access it. All supply will be based on the value that you specify in this field. |
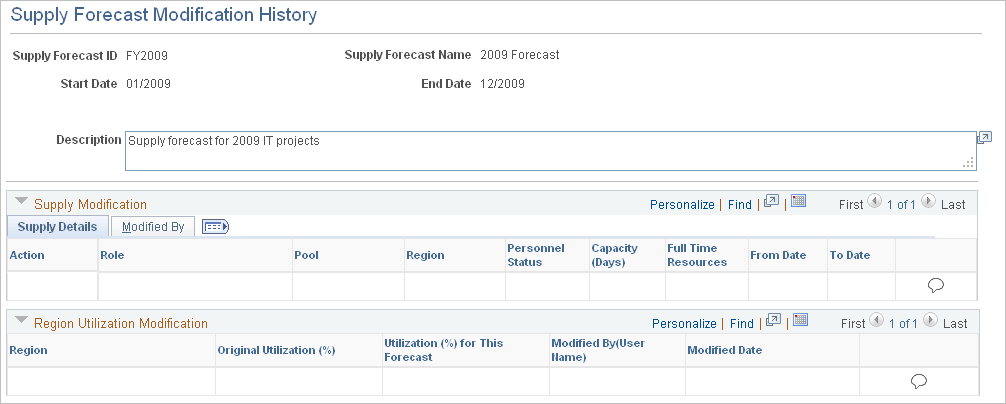
Use the Supply Forecast Modification History page (RS_FR_SUP_MOD) to view details of modifications made to supply forecasts.
Navigation:
Click the Forecast Modification History link on the Supply Forecast page.
This example illustrates the fields and controls on the Supply Forecast Modification History page. You can find definitions for the fields and controls later on this page.
Field or Control |
Description |
|---|---|
Action |
Possible actions are: Add: Indicates that you added a supply using the Add New Supply To Forecast page. Update: Indicates that you added or removed an existing supply row that originally came from resource pools. Delete: Indicates that you selected a row clicked the Remove from Forecast button. |
Capacity (Hours) or Capacity (Days) and Full Time Resource |
Displays the difference between the original supply details value and what you changed in the Add New Supply To Forecast or Supply Forecast Modification pages. For example, you update an existing row that was calculated based on the resource pools, and not by adding new supply row. You change the total capacity from 500 days to 250 days, and consequently the full-time resources change from 3 to 1.5. The action is Update, the capacity (hours) value in the Supply Forecast Modification History is −250, and the full-time resource value is −1.5. |
Use the Supply Analysis page (RS_SUP_ACE_PAGE) to analyze supply forecast data by supply categories and months.
Navigation:
Click the Supply Analysis link on the Supply Forecast page or Supply Forecast Detail page.
This example illustrates the fields and controls on the Supply Analysis page.
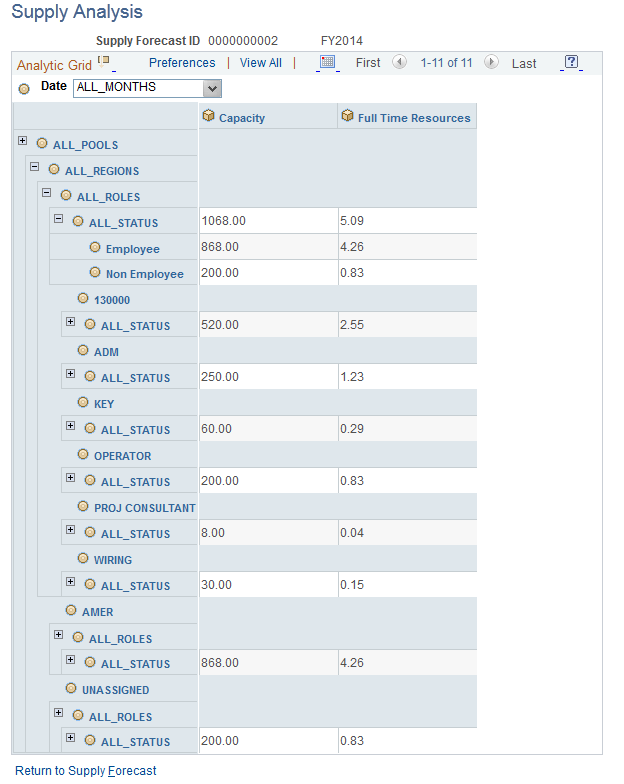
Manipulate the data based on dimensions, including Project Role, Pool, Region Code, and Personnel Status. For example, drag and drop the ALL_ROLES project role dimension to change the supply analysis view.
You can also see all months, rolled up together or individually, that are part of the forecast.
You can apportion by supply categories to change the total capacity and full-time resource dimensions.
See PeopleTools : PeopleSoft Analytic Calculation Engine, "Understanding PeopleSoft Analytic Calculation Engine."
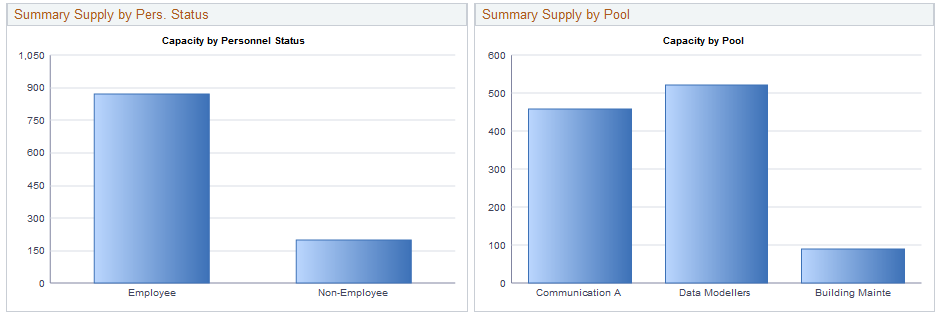
Use the View Supply Forecast Charts page (RS_SUP_CHARTS) to view graphical summarized capacity information by supply category.
Navigation:
Click the Supply Summary Charts link on the Supply Forecast page or Supply Forecast Detail page.
This example illustrates the fields and controls on the View Supply Forecast Charts page (1 of 2). You can find definitions for the fields and controls later on this page.
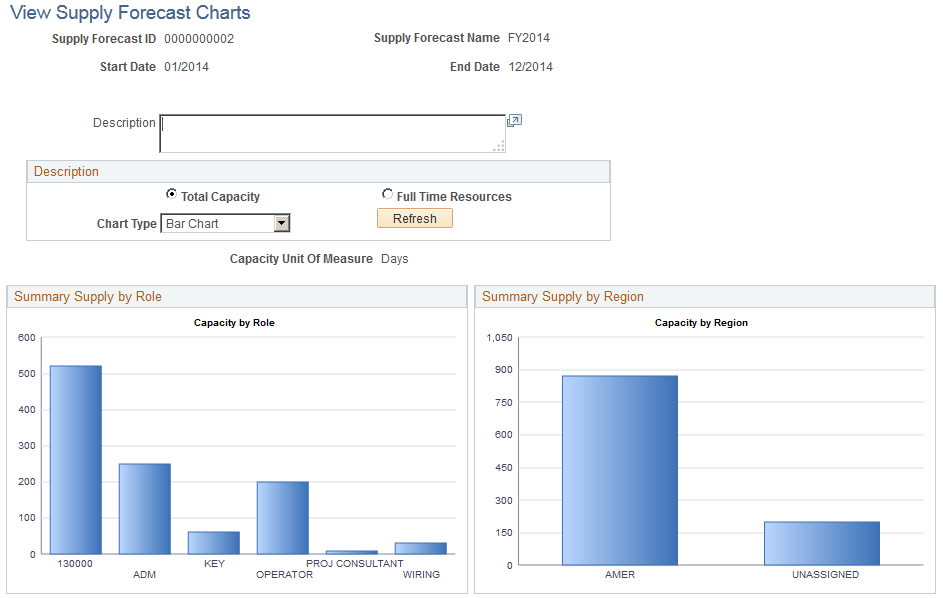
This example illustrates the fields and controls on the View Supply Forecast Charts page (2 of 2). You can find definitions for the fields and controls later on this page.
Field or Control |
Description |
|---|---|
Total Capacity and Full Time Resources |
View the supply information by selecting Total Capacity (in the capacity planning installation level unit of measure of hours or days), or Full Time Resources. |
Chart Type |
Select to view a bar or pie chart. |
Refresh |
Click to update the charts after you select different chart options. |
Use the Copy Forecast page (RS_FR_COPY) to create copies of existing forecasts with same date range as the original forecast.
Use this page to copy supply or demand.
Navigation:
Click the Copy Forecast link in the Supply Forecast group box or the Demand Forecast group box.
This example illustrates the fields and controls on the Copy Forecast page. You can find definitions for the fields and controls later on this page.
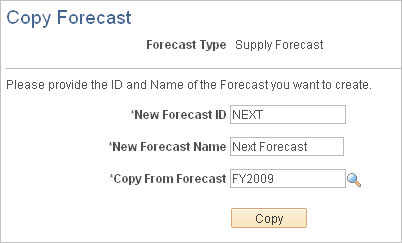
Field or Control |
Description |
|---|---|
Forecast Type |
Displays the forecast type that you select from the Strategic Capacity Planning Home page. If you select Copy Supply Forecast from the home page, the value is Supply. If you select Copy Demand Forecast from the home page, the value is Demand. Note: You can create copies of existing supply forecasts. The newly created copy has the same date range as the original. The main purpose is to enable you to create multiple supply forecasts quickly for the same period to model multiple supply scenarios. For example, one forecast might be for increasing contractor supply, another for moving some supply offshore, and another for modeling zero supply change. |
New Forecast ID |
Enter the ID for the new supply or demand forecast. The forecast ID can be auto-numbered or assigned manually. If you assign the forecast ID manually, enter up to 15 characters. Auto-numbered forecast IDs are 10 characters long. |
New Forecast Name |
Enter the name of the new forecast. |
Copy from Forecast |
Select the forecast that you want to copy. |
Copy |
Click to access the Supply Forecast page or Demand Forecast Summary page. The system populates the new forecast ID and forecast name on the page. You do not need to click the Save Forecast button, as the forecast is already saved as a result of the Copy Forecast Application Engine process (RS_COPY_FRST). |