Setting Up and Using Project Valuation
To set up project valuation, use the Project Valuation Template component (PC_VALN_TEMPLATE).
|
Page Name |
Definition Name |
Usage |
|---|---|---|
|
PC_VALN_TEMPLATE |
Set up project valuation templates for business units. |
|
|
PC_PRJ_ANALYTICS |
Evaluate project summary-level information. View project-level summaries based on user-specified criteria for transaction groupings and project overview information. |
|
|
PC_ACT_ANALYTICS |
View a breakdown by activity of the transaction group criteria from the project valuation template. |
Use the Valuation Template page (PC_VALN_TEMPLATE) to set up project valuation templates for business units.
Navigation:
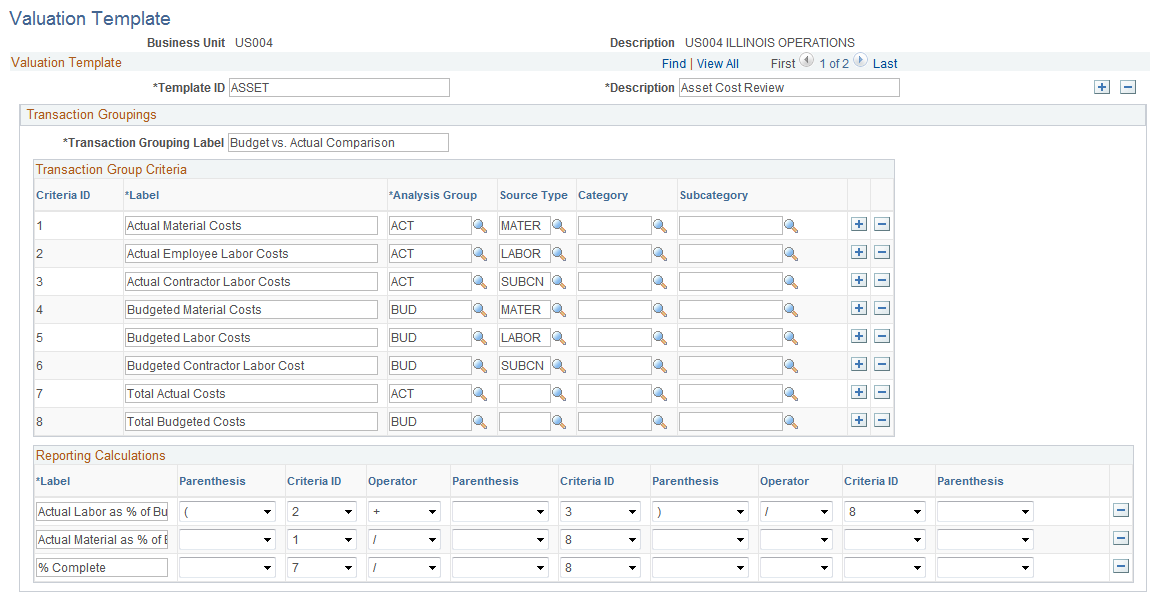
This example illustrates the fields and controls on the Valuation Template page (1 of 2). You can find definitions for the fields and controls later on this page.
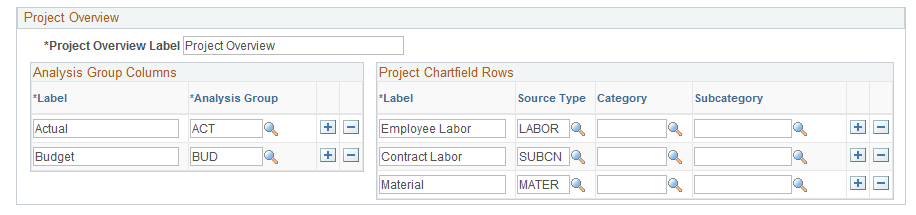
This example illustrates the fields and controls on the Valuation Template page (2 of 2). You can find definitions for the fields and controls later on this page.
This page contains all of the valuation templates for the business unit. Use the links and icons in the scroll area navigation bar to scroll through the templates or view all templates. Click the plus symbol (+) in the scroll area to add a new template, and click the minus symbol (-) to delete a template.
Field or Control |
Description |
|---|---|
Template ID |
Enter a unique ID for the valuation template. |
Description |
Enter a description that will help users identify this template. |
Transaction Group Criteria
Enter up to ten transaction group criteria rows that the system summarizes for specific projects and displays on the Project Valuation page.
Field or Control |
Description |
|---|---|
Transaction Grouping Label |
Enter a label that describes the transaction groups that you set up on this page, such as Budget vs. Actual Comparisons. The label appears as the transaction group box label on the Project Valuation page for specific projects. |
Criteria ID |
Displays the order in which transaction summary rows appear on the Project Valuation page. Note: You cannot rearrange the sequence of criteria IDs to change the order of rows that appear on the Project Valuation page. To change the order of transaction summary rows, create a new template and enter the rows in the order that you want them to appear when you view the summary data on the Project Valuation page. |
Label |
Enter a label that describes the unique combination of analysis group, source type, category, and subcategory values in the corresponding transaction group row. Each label appears as a transaction summary row label on the Project Valuation page. |
Analysis Group, Source Type, Category, and Subcategory |
Enter a value in one or more fields for the system to use as the basis for summarizing transactions on the Project Valuation page. |
Reporting Calculations
Enter up to three formulas that the system uses to calculate results and display them on the Project Valuation page for a specific project. To define the formulas, you can add, subtract, multiply, or divide the transaction summaries that you set up in the Transaction Group Criteria grid. For example, you can calculate a budget percent variance amount as (budgeted cost amount − actual cost amount / budgeted cost amount).
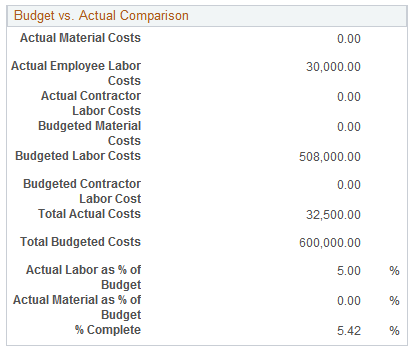
If a formula contains a division, the system multiplies the results by 100 and displays the results in a percentage format. For example, if a calculation row results in a value of 0.25, the system displays the results as 25.00%.
The results of the reporting calculation rows appear below the transaction group summary rows on the Project Valuation page for a project.
Field or Control |
Description |
|---|---|
Label |
Enter a label, such as Actual Labor as % of Budget, that describes the formula that you enter in the corresponding reporting calculation row. Each label appears on the Project Valuation page with the results of the reporting calculation row. |
Parenthesis |
Enter a parenthesis as required to specify the sequence of calculations in the reporting calculations row. |
Criteria ID |
Enter the criteria ID for the row number of the transaction group to include in the formula. You can include up to three transaction groups in the formula. |
Operator |
Enter the operator symbol to add (+), subtract (−), multiply (*), or divide (/) the amount of the transaction group that you enter to the left of the Operator field, by the amount in the transaction group that you enter in the field to the right of the Operator field. |
Example of Transaction Group Summary and Formula Results
This is an example of transaction group results on the Project Valuation page that are based on the sample data that is illustrated on the Valuation Template page:
This example illustrates the fields and controls on the Example of transaction group results on the Project Valuation page. You can find definitions for the fields and controls later on this page.
Project Overview
Enter analysis groups that the system summarizes and for which it divides the amounts by source, category, and subcategory. For example, you can combine the labor source type with the consulting category, label it as the Consulting Labor summary, and view the summary amounts for specified analysis groups on the Project Valuation page. You can enter up to three analysis groups and four ChartField combinations.
Field or Control |
Description |
|---|---|
Project Overview Label |
Enter a label that appears as the project overview group box label in the Project Valuation page. |
Analysis Group Columns - Label |
Enter a column label for each analysis group that you select to appear in the Project Valuation page. |
Analysis Group Columns - Analysis Group |
Enter analysis groups that appear as columns in the project overview group box on the Project Valuation page. The system summarizes specified project-related ChartField amounts for the analysis groups that you enter in this field. |
Project Chartfield Rows - Label |
Enter a row label for each ChartField that you select to appear in the Project Valuation page. |
Project Chartfield Rows - Source Type, Category, and Subcategory |
Enter a value for one or more project-related ChartFields that the system uses to summarize analysis group amounts for this transaction group row on the Project Valuation page. |
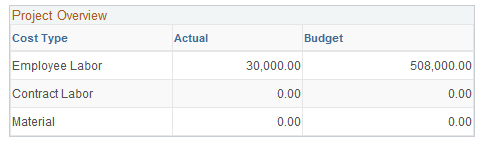
Example of Project Overview Results
This example of a project overview on the Project Valuation page is based on the sample data that is illustrated on the Valuation Template page:
This example illustrates the fields and controls on the Example of project overview results on the Project Valuation page. You can find definitions for the fields and controls later on this page.
Use the Project Valuation page (PC_PRJ_ANALYTICS) to evaluate project summary-level information.
View project-level summaries based on user-specified criteria for transaction groupings and project overview information.
Navigation:
. Click the Project Valuation link on the Project Definitions - General Information page.
. Click the Drill to Project Valuation icon on the Amounts tab of the My Projects page.
Click the project ID link in the Top Projects operational summary portal pagelet that is available in the PeopleSoft ESA Portal Pack.
Note: To find an existing project valuation when multiple valuation templates are defined for the business unit, enter the template ID in the Project Valuation component search page to narrow the list of project valuations from which to choose.
This example illustrates the fields and controls on the Project Valuation page. You can find definitions for the fields and controls later on this page.
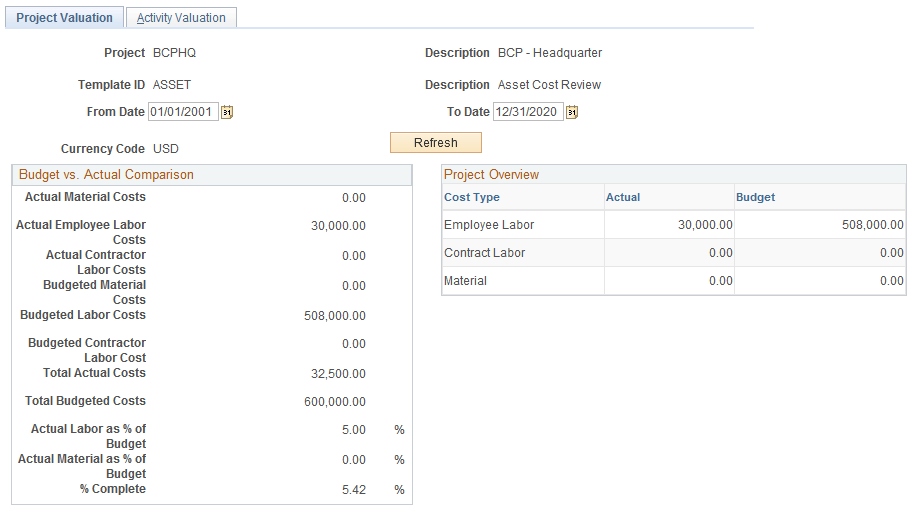
Select the business unit, project ID, and template ID.
Note: The system automatically calls the Project Valuation Calculation Application Engine process (PC_VALN_CALC) to calculate project and activity summary information.
The Project Valuation page appears with the selected project and template in the header. The default values for the From Date and To Date fields are based on your user preferences. If both dates are blank, the system returns all data that meets the search criteria. You can choose a different date range and the data on the project and activity valuation pages changes to display data only for the date range selected.
The valuation report uses the Project Transactions Summary table. Transactions in this table are grouped by month and posted using the first date of the current month. For example, a transaction with an accounting date and transaction date of November 14, 2005 appears in the Project Transactions Summary table with a date of November 1, 2005. If you want to include any transactions for a particular month in the valuation report, your selection criteria must include the first day of that month. For example, to retrieve results from transactions with dates that range from November 10, 2005 to November 20, 2005, you must select a from date of November 1, 2005.
The currency code is based on the currency defined for the project business unit. Transactional data is based on the Project Transactions Summary table.
Use the Activity Valuation page (PC_ACT_ANALYTICS) to view a breakdown by activity of the transaction group criteria from the project valuation template.
Navigation:
Select the Activity Valuation tab on the Project Valuation page.
This example illustrates the fields and controls on the Activity Valuation page. You can find definitions for the fields and controls later on this page.
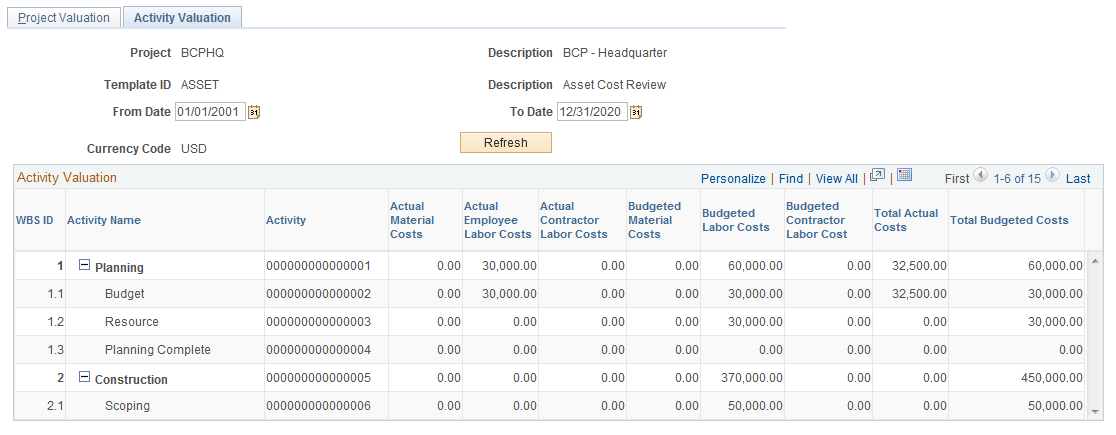
Use this page to view a breakdown by activity based on the transaction group criteria from the Project Valuation template.
If the project contains summary activities, click the plus symbol (+) to expand summary activities and view activity detail.