Setting Up and Analyzing Project Profitability
|
Page Name |
Definition Name |
Usage |
|---|---|---|
|
INSTALLATION_PC |
Set up default analysis groups. The actual cost, actual revenue, forecast cost, and forecast revenue analysis groups are assigned to a project when the project is created. They determine how to calculate actual and forecast profitability. Users can override these values on the Project Costing Definition page. |
|
|
PROJECT_GEN_01 |
Define the profitability analysis groups for a project. |
|
|
PC_EA_ACT_PROFIT |
Analyze actual profitability. Use this page to compare the profit levels of selected projects for two periods. |
|
|
PC_EA_PROFIT_DTL |
Analyze profitability details. Use this page to compare the budget, actual, revenue, and profit level of the selected project. |
|
|
Project Profitability Details - Activity Details Page |
PC_EA_PROFIT_DTL_SEC |
Analyze the profit details for each activity within a project. Use this page to compare the budget, actual, revenue, and profit level of activities within the selected project. To access this page, click the description link of the project for the activities on the Project Profitability Details page. |
|
PC_EA_TOP_PROFIT |
Analyze the top ten profitable projects. Use this page to display the top 10 projects that have the highest profit margin percent. |
Field or Control |
Description |
|---|---|
Business Unit |
Select a PeopleSoft Projects business unit. Results are limited to a single business unit and all amounts are displayed in the base currency of the business unit. |
My Projects |
Select to limit the result to those projects that are on the user's My Projects list. |
Cost |
Displays the sum of all transactions for which the analysis type is in the actual cost analysis group, which is determined on the Project Costing Definition page. |
Revenue |
Displays the sum of all transactions for which the analysis type is in the actual revenue analysis group, which is determined on the Project Costing Definition page. Results from two periods are displayed side by side. |
Margin |
Displays the amount of actual revenue – actual cost. |
Margin Percent |
Displays the amount of (actual margin / actual revenue) x 100. |
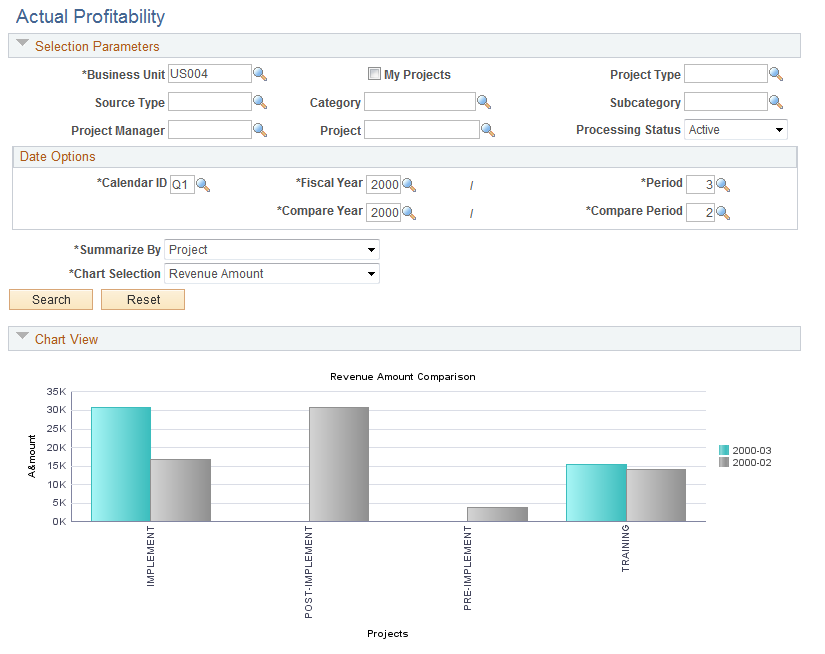
Use the Actual Profitability page (PC_EA_ACT_PROFIT) to analyze actual profitability and compare the profit levels of selected projects for two periods.
Navigation:
This example illustrates the fields and controls on the Actual Profitability page (1 of 2). You can find definitions for the fields and controls later on this page.
This example illustrates the fields and controls on the Actual Profitability page (2 of 2). You can find definitions for the fields and controls later on this page.
Use the Actual Profitability page to compare the profit levels of selected projects for two periods. Comparisons can be based on selection parameters. The page is divided into three collapsible sections:
Selection parameters that enable the user to reduce the amount of data that is displayed.
Chart view that enables the user to compare profit levels for two periods in a chart format.
Grid view that enables the user to compare profit levels for two periods in a grid format.
Specification Parameters
Field or Control |
Description |
|---|---|
Fiscal Year |
Select the first of the two years to be compared. |
Period |
Select the first of the two periods, within the year selected in the Fiscal Year field, to be compared. |
Compare Year |
Select the second of the two years to be compared. |
Compare Period |
Select the second of the two periods, within the year selected in the Compare Year field, to be compared. |
Summarize by |
Select how you want the data to be summarized when using the grid view. Options include Project, Project Type, and Source Type. |
Chart Selection |
Select how you want the chart to be displayed when using the chart view. Options include Margin Bar Chart, Revenue Bar Chart, and Cost Bar Chart. |
Chart View
This view displays the results in a chart format and is based on the selection in the Chart Selection field. This section is collapsible.
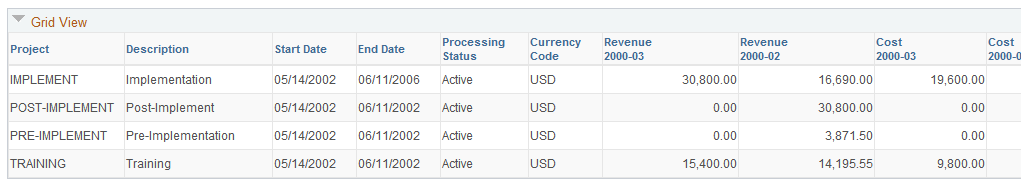
Grid View
This view displays the results in a table format and is summarized based on the selection in the Summarize by field. This section is collapsible.
Field or Control |
Description |
|---|---|
Start Date and End Date |
Displays the start date and the end date of the project. These columns are displayed only if you are summarizing by project. |
Use the Project Profitability Details page (PC_EA_PROFIT_DTL) to analyze profitability details and compare the budget, actual, revenue, and profit level of the selected project.
Navigation:
This example illustrates the fields and controls on the Project Profitability Details page. You can find definitions for the fields and controls later on this page.
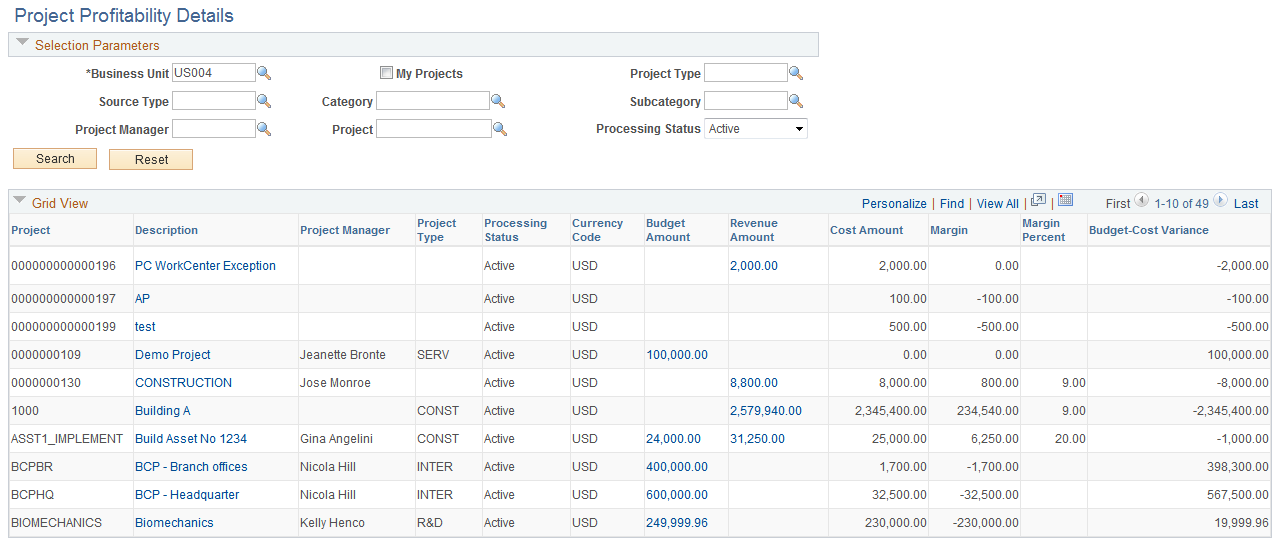
Use this page to compare the profit level of a project to the budget.
Field or Control |
Description |
|---|---|
Description |
Displays the project description. Click the description link to view activity details. |
Budget Amount |
Displays the total amount of the finalized budget. Click the amount link to access the Budget Detail page. |
Revenue Amount |
Click to access the Manager Transaction Review page. |
Budget–Cost Variance |
Displays the amount of the budget minus the actual cost for the project. |
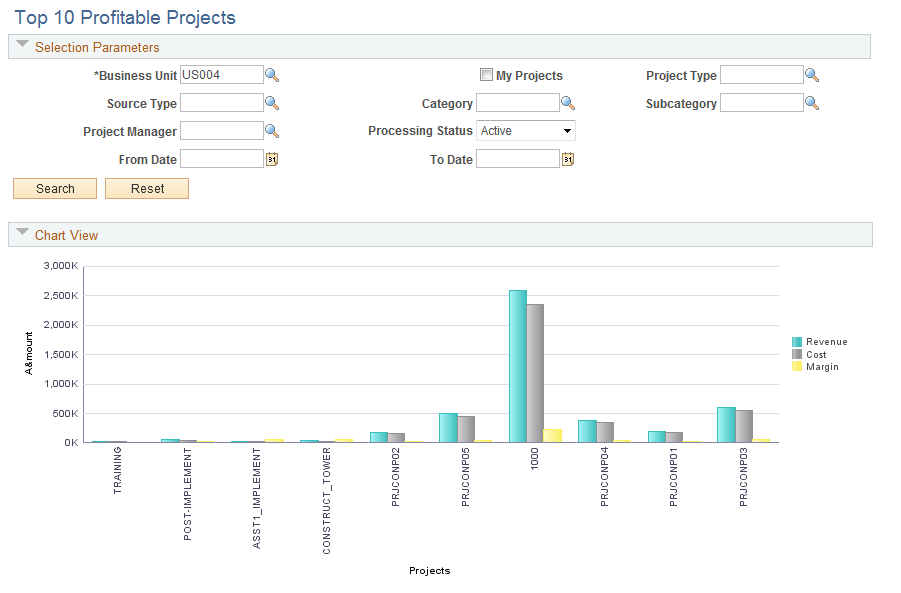
Use the Top 10 Profitable Projects page (PC_EA_TOP_PROFIT) to analyze the top ten profitable projects that have the highest profit margin percent.
Navigation:
This example illustrates the fields and controls on the Top 10 Profitable Projects page (1 of 2). You can find definitions for the fields and controls later on this page.
This example illustrates the fields and controls on the Top 10 Profitable Projects page (2 of 2). You can find definitions for the fields and controls later on this page.
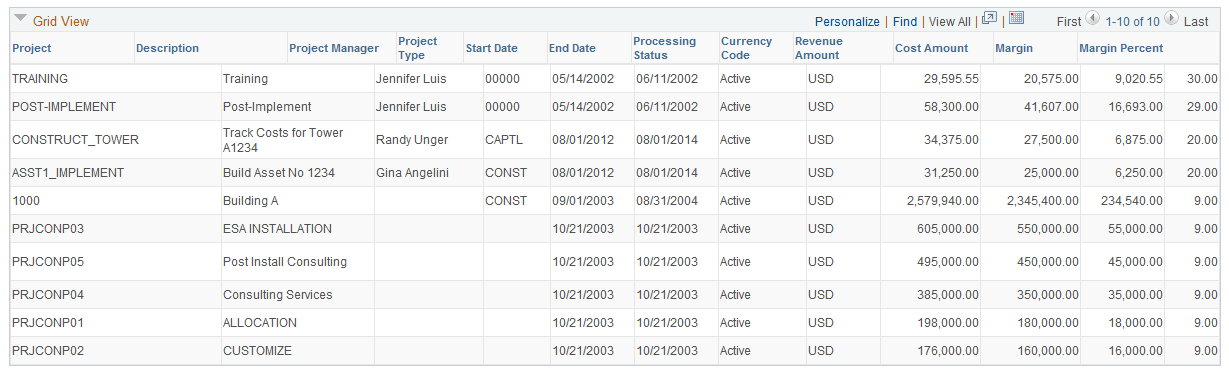
Use this page to display the top 10 projects that have the highest profit margin percent.
Use the chart view to display the results in a chart format. This section is collapsible.
Use the grid view to display the results in a table format. This section is collapsible.