Viewing Forecast to Complete Information
This topic discusses how to view forecast to complete information and personalize the Forecast to Complete pagelet.
|
Page Name |
Definition Name |
Usage |
|---|---|---|
|
PC_PE_ETC_VARIANCE |
View the forecast to complete date variance for a maximum of five projects with the greatest variance. |
|
|
PC_PE_ETC_PRS |
Define default display information for the Forecast to Complete pagelet. |
Use the Forecast to Complete pagelet (PC_PE_ETC_VARIANCE) to view the forecast to complete date variance for a maximum of five projects with the greatest variance.
Navigation:
Click the Personalize Content link on the PeopleSoft Home page.
Select Forecast to Complete.
The pagelet displays a bar graph of a maximum of five projects with the greatest variance. Click the Show All / Enhanced link to access the Forecast to Complete Variance page, which contains more details about date and time variance.
Use the Personalize Forecast to Complete page (PC_PE_ETC_PRS) to define default display information for the Forecast to Complete pagelet.
Navigation:
Click the Forecast to Complete Variance link on the ESA Portal Pack Pagelet Default Administration page.
Click the Customize Forecast to Complete icon on the Forecast to Complete pagelet.
This example illustrates the fields and controls on the Personalize Forecast to Complete page.
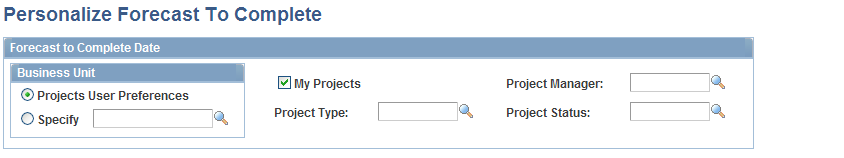
Specify parameters to filter the projects that you want to appear on the Forecast to Complete pagelet.