Viewing Aging Summary Information
This topic discusses how to view aging summary information and personalize the aging summary pagelet.
|
Page Name |
Definition Name |
Usage |
|---|---|---|
|
AR_PE_AGING_PAGE |
View a bar graph that shows the total aging amount in up to five aging categories. |
|
|
AR_PE_AGSUM_PRS |
Define default display information for the Aging Summary pagelet. |
Use the Aging Summary pagelet (AR_PE_AGING_PAGE) to view a bar graph that shows the total aging amount in up to five aging categories.
Navigation:
Click the Personalize Content link on the PeopleSoft Home page.
Select Aging Summary.
This pagelet uses a bar graph to display the total aging amount by aging category. The system filters the data based on the parameters on the Aging Summary Personalization page.
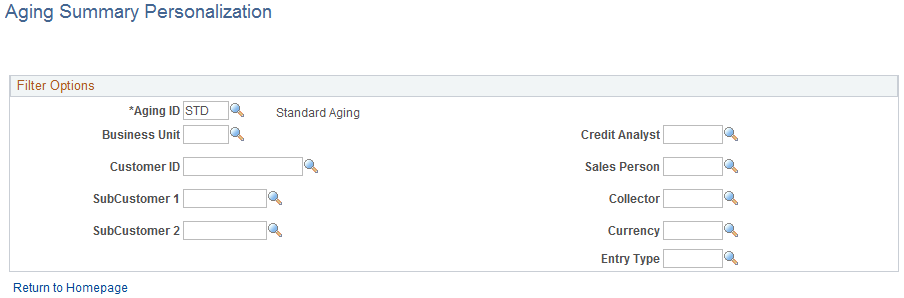
Use the Aging Summary Personalization page (AR_PE_AGSUM_PRS) to define default display information for the Aging Summary pagelet.
Navigation:
Click the Customize Aging Summary icon on the Aging Summary pagelet.
This example illustrates the fields and controls on the Aging Summary Personalization page. You can find definitions for the fields and controls later on this page.
Field or Control |
Description |
|---|---|
Aging ID |
Select an aging category to display items that are part of the age range specified by the aging ID. |
Entry Type |
Select an entry type to display the items for an entry type in a category. |
Note: When you change any personalization options, you must run the Update Pagelet Statistics process for the pagelet to display the correct data.