Using the PeopleSoft Fluid Comprehensive Customer View
This topic describes how to use the PeopleSoft Fluid Comprehensive Customer View for analysis and comparison of customer data.
You can customize the Fluid Comprehensive Customer View using these methods:
Fluid Configurable Analysis Framework.
PeopleSoft’s Fluid Configurable Analysis Framework (CAF) enables administrators to use a common framework to design end-user pages and determine what factors (data) to display for an entity.
For more information, see Using Configurable Analysis Framework
Actions list.
Use the Actions list to specify page characteristics, set date filters, and manage metric lists
My Personalization page.
Use the My Personalization page to define user-level display options.
Choose Metrics page.
Use the Choose Metrics page to specify the metrics to display in the analysis or comparison views.
Customers Selection page.
Use the Customers Selection page to search for and select customers to filter results.
Note: These options are common to both the Comparison and Analysis views.
Actions List
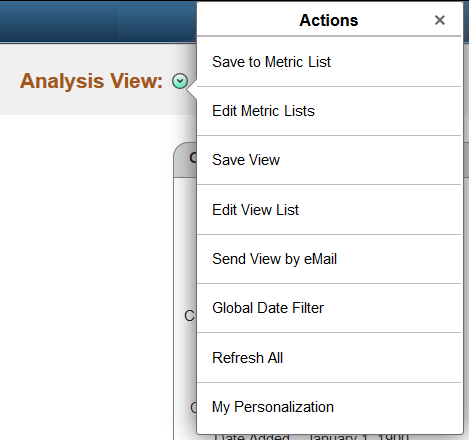
Use the Actions list to specify page characteristics, such as the number of top transactions to display, set date filters, and manage metric lists. You can also manage user access to lists and page views.
Actions list options
Term |
Definition |
|---|---|
Save to Metric List |
Use this option to save the current metric list to a custom list. This list will appear within the Metric List tab of the Choose Metrics page. |
Edit Metric Lists |
Use this option to add or remove metrics from a metric list, make a list public, active, or inactive, and delete lists. |
Save View |
Use this option to save the current view. A saved view contains:
|
Edit View List |
Use this option to delete or make public the views created by the current user. |
Send View by Email |
Use this option to send an email notification including a link to the current view as well as a description of the data shown in the view. A view includes:
|
Global Date Filter |
Use this option to enter From and To dates used to filter data displayed in the current view. When you change this parameter, the Fluid Comprehensive Customer View page immediately refreshes the data to reflect the change. The filter is applied to all metrics except top metrics (customer top contracts, top items, and so on). Note: To prevent slow loading of metric data, PeopleSoft recommends you do not exceed 3 months in your global date search. |
Refresh All |
Use this option to refresh the current view with current customer data. |
My Personalization |
Use this option to define user-level display options. |
My Personalization Page
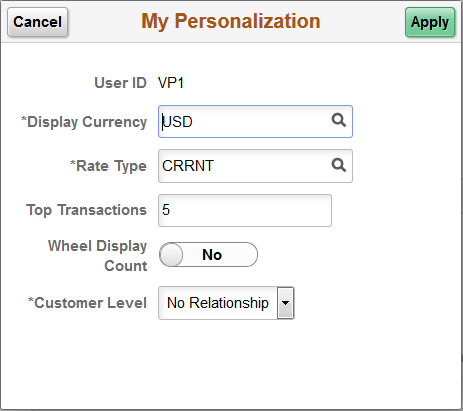
Use the My Personalization page (C360_PRFS_DFLT_FL) to define user-level display options.
Navigation:
This example illustrates the fields and controls on the My Personalization page.
Term |
Definition |
|---|---|
Display Currency |
Select the currency code you want to use for the metrics. |
Rate Type |
Select the currency rate you want to use for the metrics. |
Top Transactions |
Enter the number of transactions you would like displayed for each top metric in the current view. For example, if you enter ‘5,’ the Customer Top Contracts metric displays only five lines of contract information. Note: In Analysis view the top metric displays the individual transactions. In Comparison view the top metric only displays the total and the quantity of top transactions. |
Wheel Display Count |
Toggle this option to Yes to display the counts in parentheses for transactions on the Transaction Wheel. |
Customer Level |
Specify the customer hierarchy type by selecting one of these options:
When you select an option, data for all customers within the hierarchy displays. If you do not select an option, only the data for the selected customer displays. |
When you change any of these parameters, the Fluid Comprehensive Customer View page immediately refreshes the data to reflect the change.
Choose Metrics Page
Use the Choose Metrics page (CAFNUI_FCTCMP_SCF) to specify the customer analysis pagelets (metrics) to display in the Analysis or Comparison views.
Navigation:
This example illustrates the fields and controls on the Choose Metrics page.
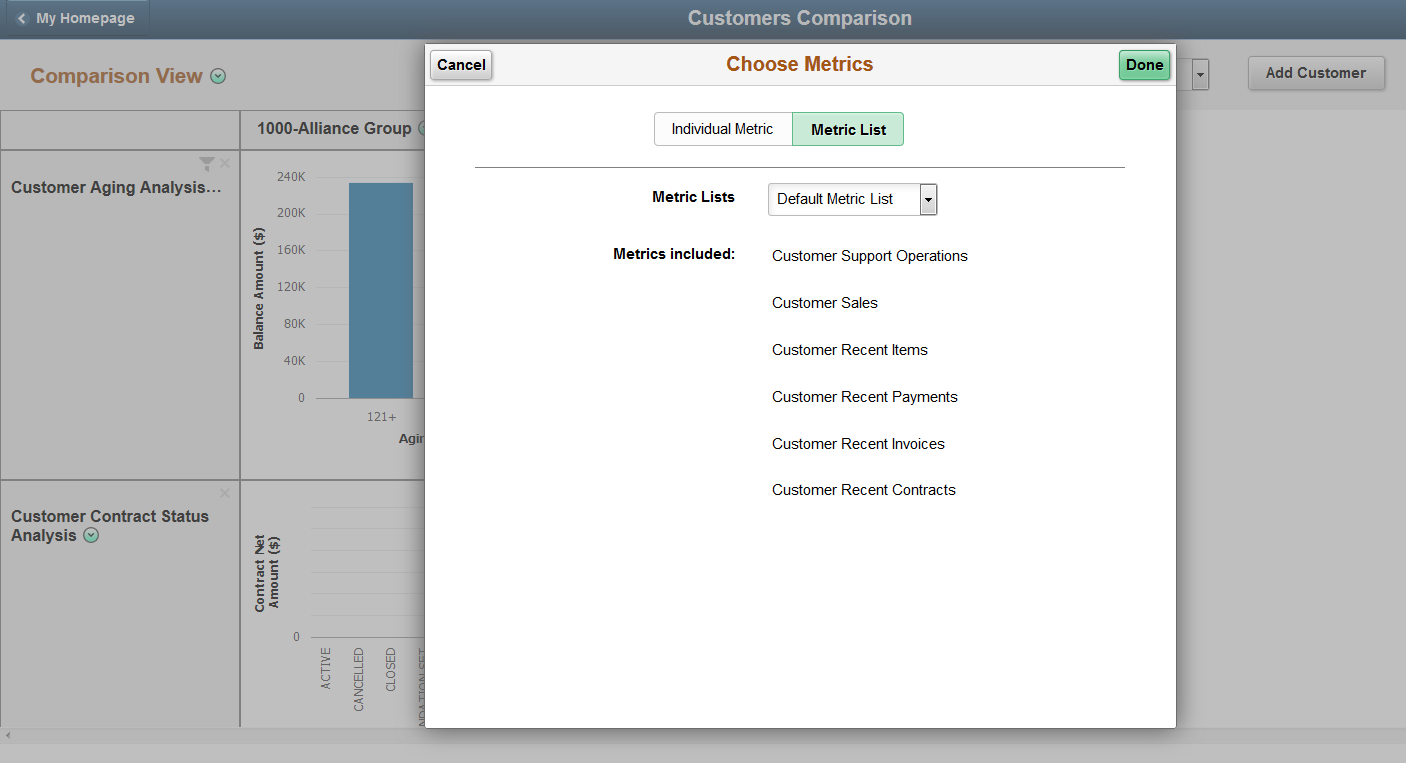
The Choose Metrics page provides two tabs, Individual Metric and Metric List.
Use the Individual Metric tab to select individual metrics from a list of total available metrics.
Use the Metric List tab to select predefined groups of metrics. Choose from these available options:
Customer Balances Metrics
Customer Information Metrics
Default Metric List
Information and Totals
Pivot Grid Metrics
Recent Metrics
Top Metrics
In addition, any metric list you created using the Save to Metric List option displays here.
For more information about the customer analysis pagelets accessed using the Choose Metrics page, see Working with Fluid Comprehensive Customer View Pagelets.
Customers Selection Page
Use the Customers Selection page (CAFNUI_SRCHPAGE_FL ) to search for and select customers to filter results.
Navigation:
Click the Add Customer button when in Comparison view.
Click the Change Customer button when in Analysis view.
This example illustrates the fields and controls on the Customers Selection page.
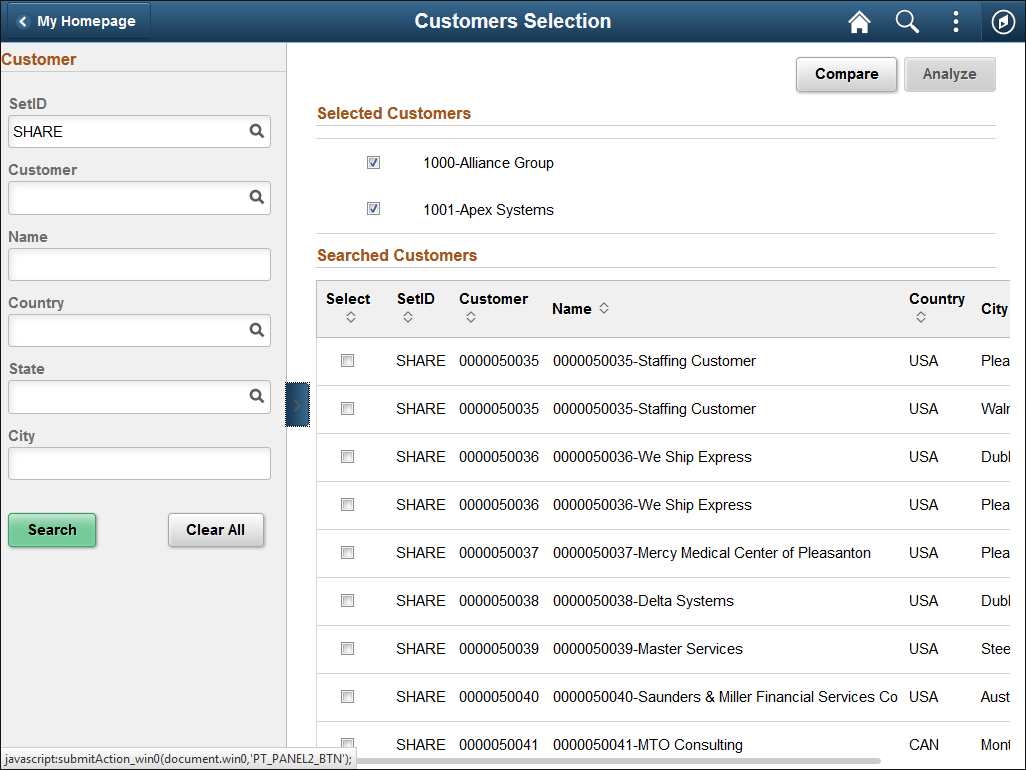
Use the Customer panel on the left side of the page to enter suitable filter criteria and search for relevant customers. Click Search.
In the Searched Customers grid, select the customer or customers you wish to use in Comparison or Analysis view. Customers you select appear in the Selected Customers grid.
Click Compare to access the Comparison view of the Comprehensive Customer View page. Click Analyze to access the Analyze view of the Comprehensive Customer View page. If you select two or more customers from the Searched Customers grid, the Analyze button is unavailable.
This section discusses actions common to both Analysis and Comparison views of the Fluid Comprehensive Customer View.
Metric Actions
You can access different metric actions for each metric.
Click the Metric Related Actions button to perform the following actions:
<metric name> Filter: used to access the Edit Filter Values page, where you can select and apply different filter options to the metric.
Show Filter Values: used to access the Show Filter Values page, where you can view the filter values you applied to the metric.
A filter icon indicates when the data was filtered.
Note: The filter criteria changed at Metrics Actions are saved. When a filter ID is used by more metrics, if you change it for one metric, this change will be reflected at the other metrics that use it.
View Details
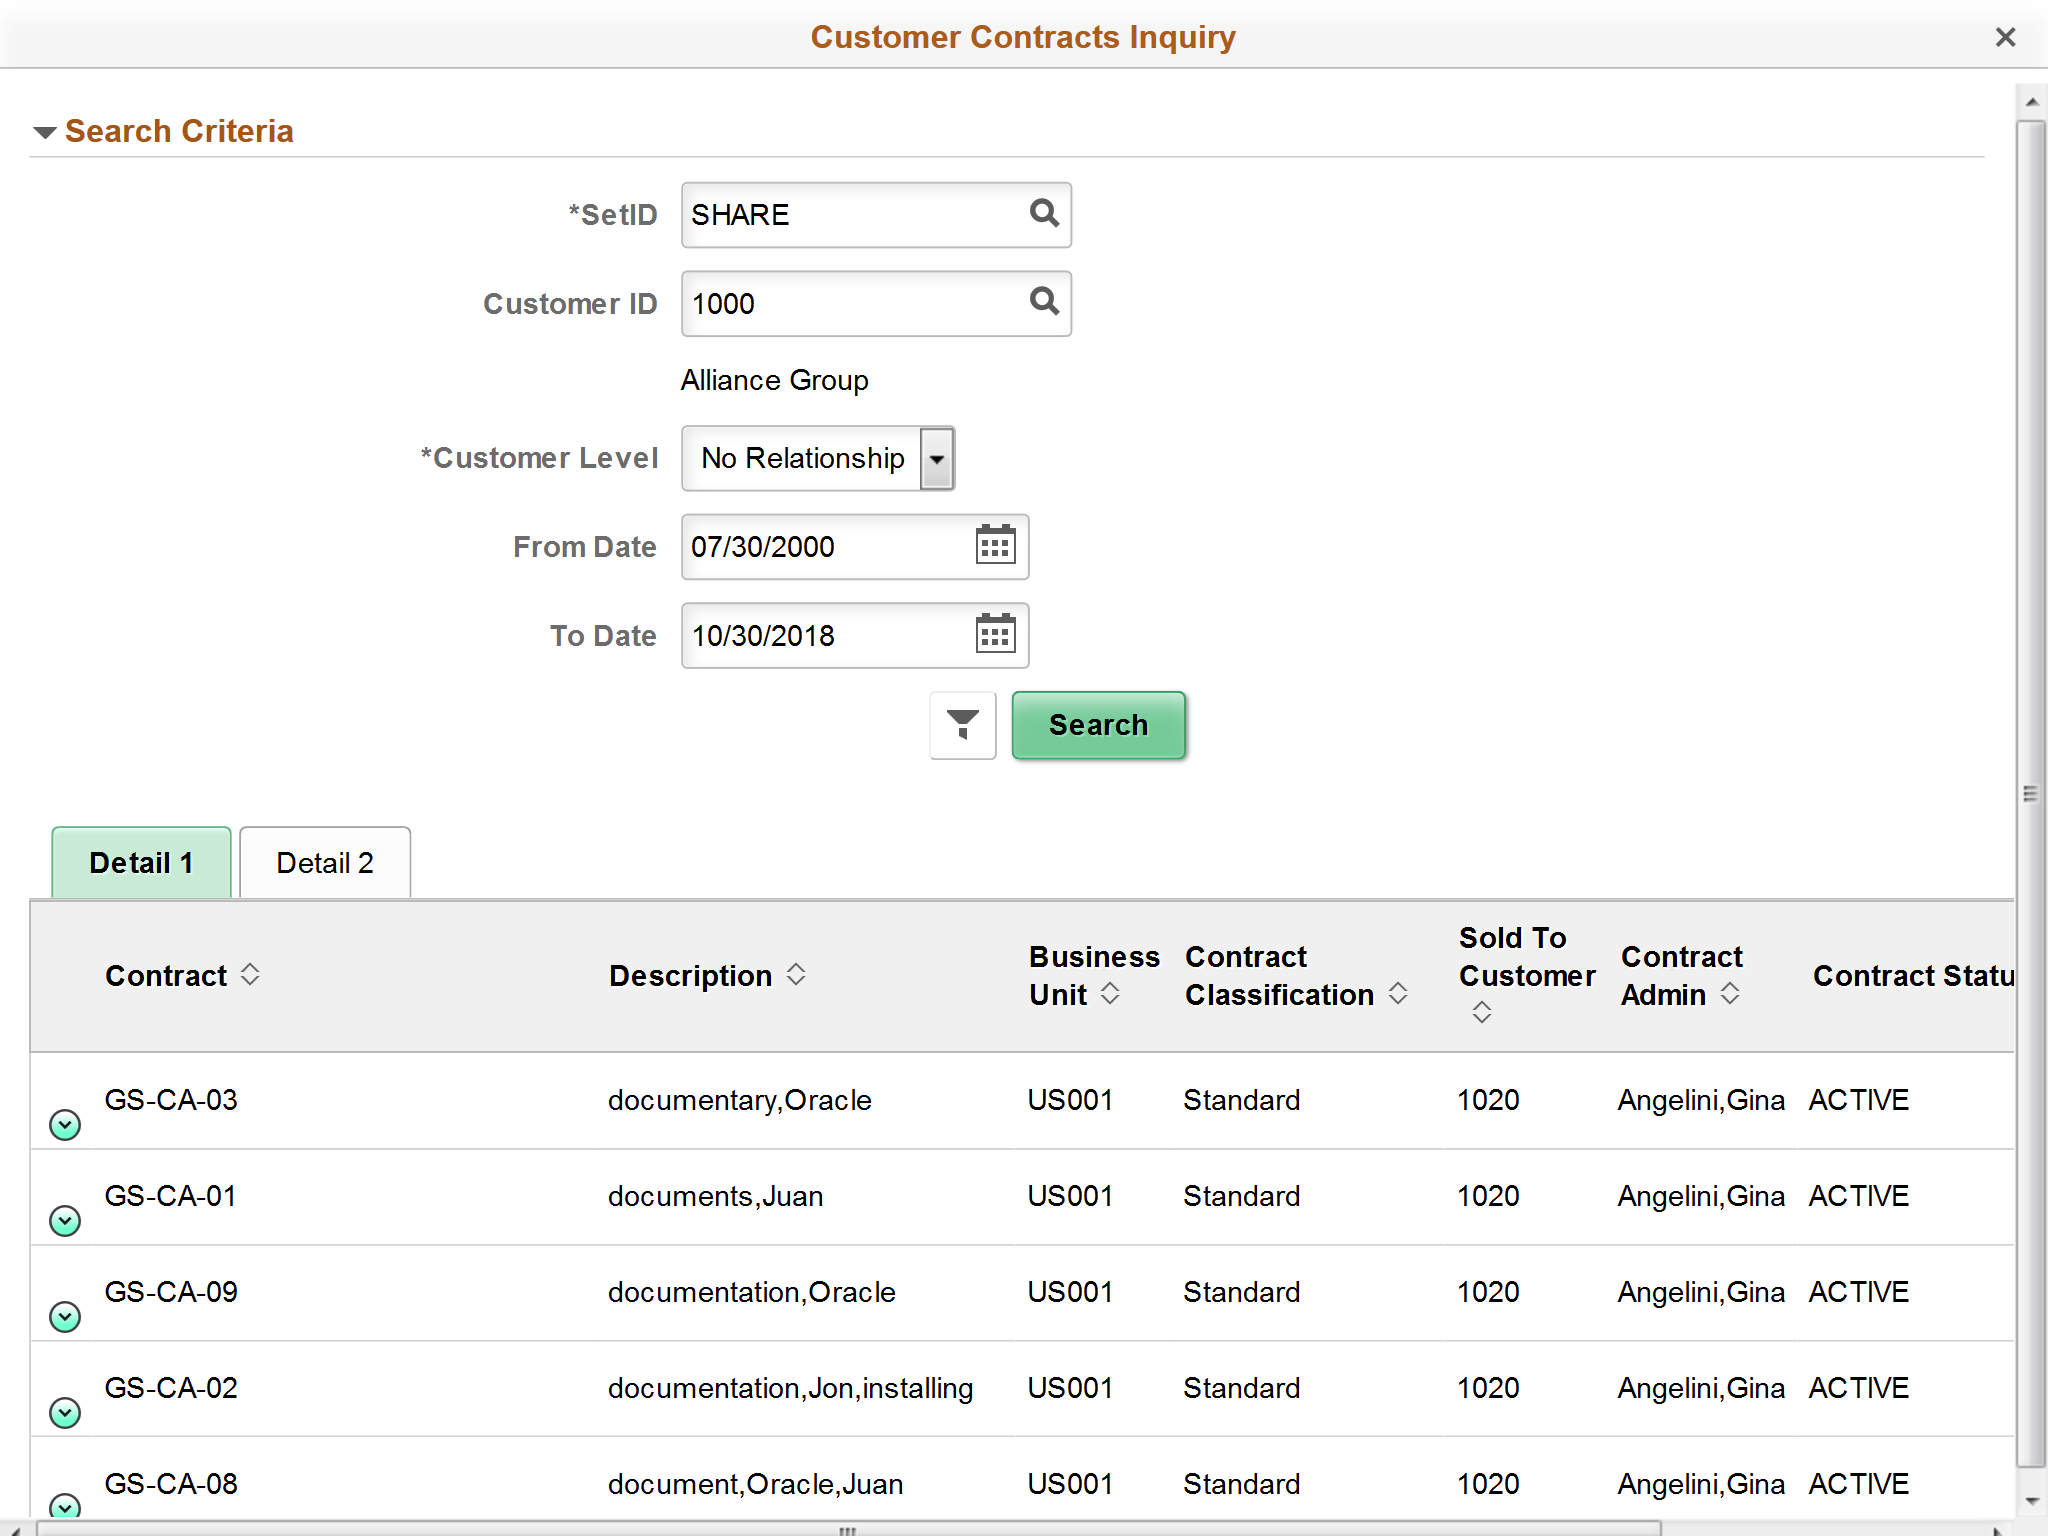
For each metric, click the View Details link to access the <metric name> Inquiry page and view additional details for the metric. You can also modify search criteria.
Customer Contracts Inquiry page
Some customer analysis pagelets in the Fluid Comprehensive Customer View use pivot grids, which enable you to display data in different views by performing operations such as pivoting and filtering. This enables you to interpret data in a variety of ways. Pivots grids are based on PS Queries and can display results in a grid format, a chart format, or both.
Pivot grids in the Fluid Comprehensive Customer View
You can click anywhere on the pivot grid to access the Pivot Grid Detail page and select different dimensions, graph and filtering options, and so forth.
Pivot Grid Detail page
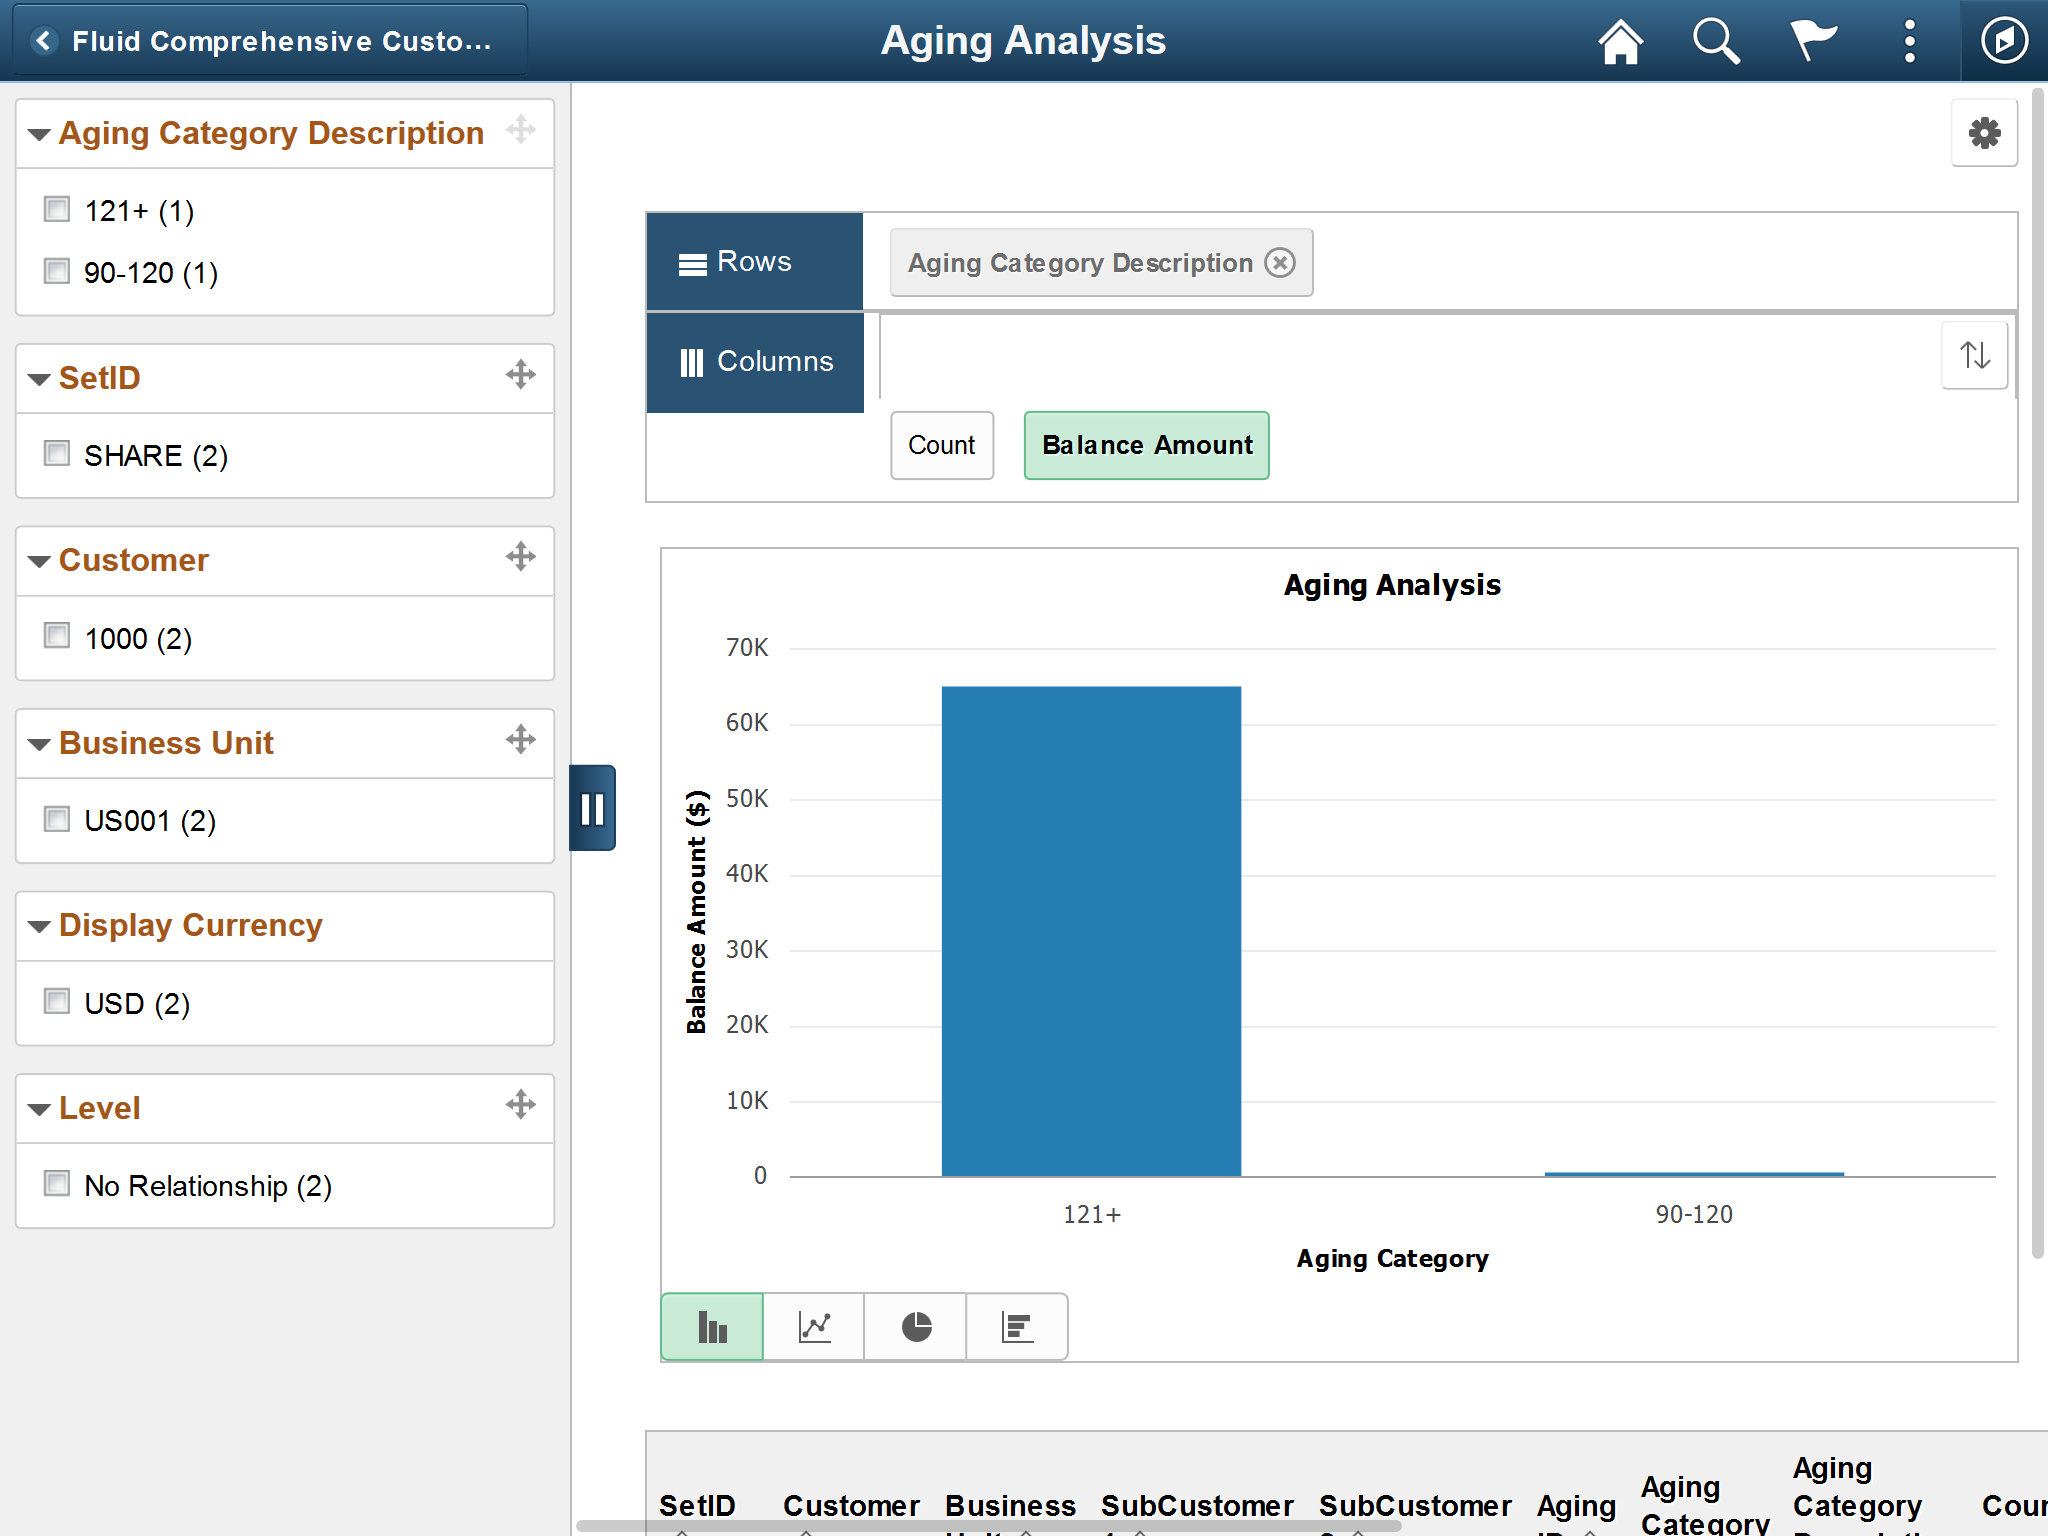
The left panel of the editing page enables you to modify the prompts and filters. Users can select from a range of data using field prompts, filter data by selecting specific facets values, and analyze pivot data by dragging and dropping facets into the Pivot Grid Columns and Rows.
Each pivot grid has its own set of prompts—such as SetID, Business Unit, and so forth—that you can modify to display data in the graph.
You can also choose the type of graph—including bar, line, and pie charts—to display your data.
Click the bars in a graph, pie slices, or the display amount value links in the pivot grid or table to view details or drill down by various dimensions.
The Options Menu (cog icon) provides these pivot grid controls:
View Grid
Update Filters
Chart Options
Export Data
Threshold Options
Save
Save As
Sort Option
Add to Homepage
Note: When you return to the Comprehensive Customer View, filters you applied during editing will not be reflected on the page.
For more information about fields and controls in pivot grids, see the product documentation for PeopleTools: Pivot Grid.
Use the Comprehensive Customer View page - Analysis View (CAFNUI_360_FL) to view data related to a single customer.
Navigation:
This example illustrates the fields and controls on the Comprehensive Customer View page - Analysis View.
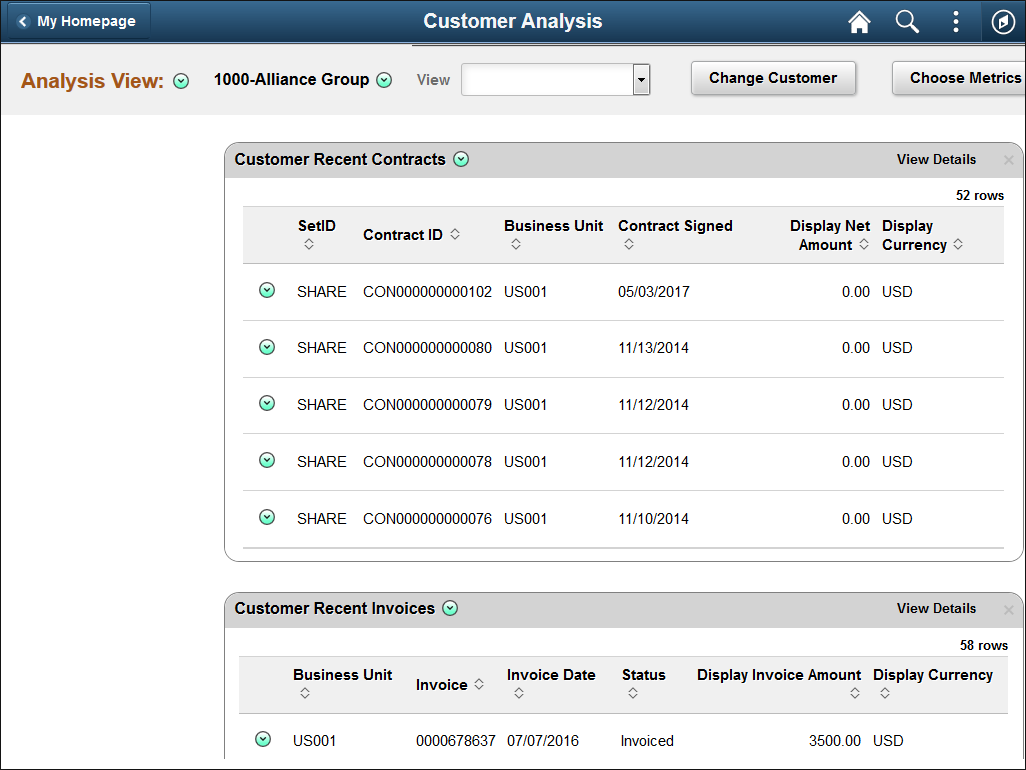
In Analysis view, each metric and its corresponding data display in individual grids.
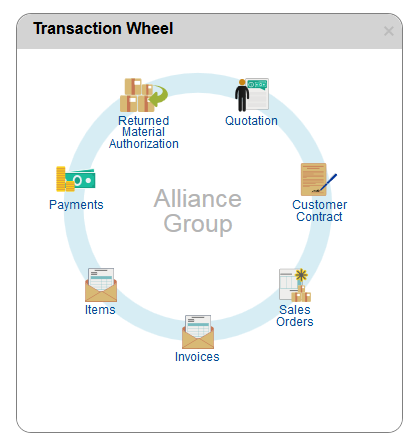
Transaction Wheel
The Transaction Wheel is available in the Analysis view. In the Transaction Wheel you can access up to seven types of transactions associated with a particular customer. You can click any icon to access the respective transaction search component, where you can filter transactions, and review transaction status and document status. All inquiry pages open in a new window.
Access to the transaction inquiry pages depends on the user role. If a user is not authorized to access certain components, a message denying them access appears.
The Transaction Wheel is accessible in the analysis mode and includes these transactions:
Quotations
Customer Contracts
Sales Orders
Invoices
Items
Payments
Returned Material Authorizations
Fluid Transaction Wheel
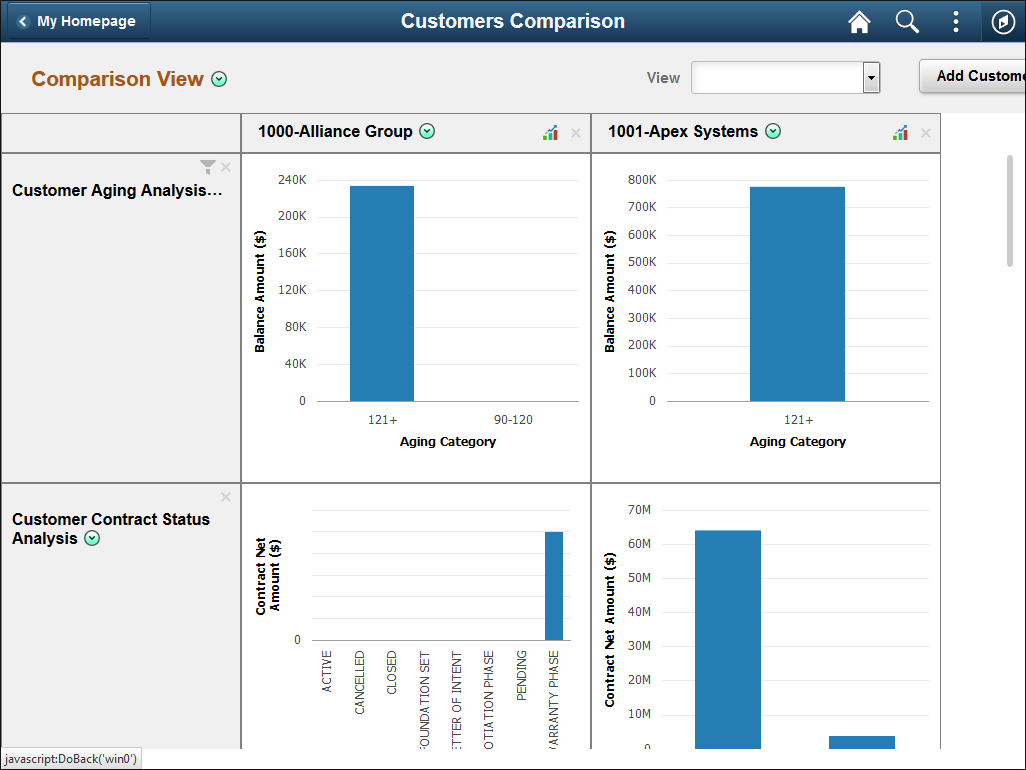
Use the Comprehensive Customer View page - Comparison View (CAFNUI_DISPLAY_FL) to compare data for two or more customers.
Navigation:
This example illustrates the fields and controls on the Comprehensive Customer View page - Comparison View.
In Comparison view, customers and their related data appear in tabular format. Customers appear in the header row at the top of the table. Metric data appear as rows. Customer and metric data will vary depending on the customers selected and metrics specified for analysis. Customer Related Actions are available only in Comparison view.
Customer Related Actions
On the customer header row, click the Customer Related Actions button to perform the following actions:
Flag this Customer: used to indicate the customer is flagged.
Collection Workbench: used to access the Collections Workbench, where you can view detailed customer collection data for the customer, as well as related contracts.
Customer Attachments: used to access the Attachments page, where you can view attachments related to the customer.
Customer Hierarchy: used to access the Customer Hierarchy page, where you can review customer hierarchy information for the customer.
Customer Information: used to access the Customer Information - General Info page, where you can review the customer name, address, level information, and associated roles.
Customer Message: used to access the Messages page, where you can identify and manage messages for the customer.
Click the Analysis Mode icon to access the Comprehensive Customer View page - Comparison View for a customer and view detailed information for each metric.