Consolidating Group Member Assets
This topic provides an overview of consolidation of group member assets and discusses how to run the Group Asset Consolidation process (AMGRPCON).
|
Page Name |
Definition Name |
Usage |
|---|---|---|
|
AMGRPCON_RQST |
Run the process that consolidates cost information for group member assets. The process summarizes cost information of group members at the group level, based on the ChartFields that you specify on the Business Unit/Book Definition page. Run this process before calculating depreciation for group assets. |
|
|
Group Member Open Transaction Detail Page |
AMGRPCON_DET_SEC |
Review open transactions for group members. See Consolidate Page |
PeopleSoft Asset Management provides the Group Asset Consolidation process, which consolidates (or summarizes) group member asset cost information at the group level, based on ChartFields that you specify. Once the process has been run, cost and depreciation information for all group members is stored at the group level. The process summarizes asset addition (ADD) and asset adjustment (ADJ) transactions. Other transactions such as transfers, retirements, and reinstatements are copied to the group asset level without consolidation because the system calculates reserve at the group member level. However, after you run depreciation for these transactions, they are consolidated at the group level the next time that you run the Group Asset Consolidation process.
The Group Asset Consolidation process uses the transaction period in which the ADD or ADJ transaction occurs, except when you use the actual-day depreciation convention. In that case, the process uses the actual transaction date. The period of the in-service date is also a factor when consolidating ADD transactions.
You must run the Group Asset Consolidation process before you depreciate group assets. When you next run the process to summarize new group member additions and adjustments, the process consolidates the new transactions with the previously summarized transactions for greater table efficiency.
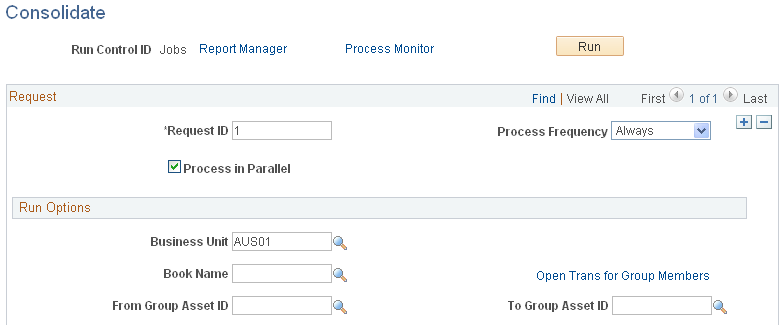
Use the Consolidate page (AMGRPCON_RQST) to Run the process that consolidates cost information for group member assets.
The process summarizes cost information of group members at the group level, based on the ChartFields that you specify on the Business Unit/Book Definition page. Run this process before calculating depreciation for group assets.
Navigation:
This example illustrates the fields and controls on the Consolidate page. You can find definitions for the fields and controls later on this page.
Note: Accumulated depreciation for group member assets is loaded at the member asset level, and the Group Asset Consolidation (AMGRPCON) process consolidates at a group level.
Consolidation Example for Asset Additions
This example shows how group member cost information is consolidated for asset additions. In this example, Project and Category represent the ChartFields selected for summarization. The example is based on a monthly depreciation calendar.
This table shows the cost records for nine member assets that belong to one group asset before you run the Group Asset Consolidation process:
|
Asset |
Trans Date |
Acct Date |
In Svc Date |
Depr Conv |
Oper Unit |
Dept |
Project |
Cate- gory |
Cost Type |
Cost |
Group Asset |
|---|---|---|---|---|---|---|---|---|---|---|---|
|
1 |
Jan 1, 2XX3 |
Jan 1, 2XX3 |
Jan 1, 2XX3 |
AM |
PL01 |
32000 |
1 |
AUTO |
C |
1,000 |
GR1 |
|
2 |
Jan 5, 2XX3 |
Jan 31, 2XX3 |
Jan 15, 2XX3 |
AM |
PL05 |
53000 |
1 |
AUTO |
NA |
2,000 |
GR1 |
|
3 |
Jan 31, 2XX3 |
Jan 31, 2XX3 |
Jan 1, 2XX3 |
AM |
NA |
53000 |
1 |
AUTO |
M |
1,300 |
GR1 |
|
4 |
Jan 20, 2XX3 |
Jan 20, 2XX3 |
Jan 15, 2XX3 |
AM |
PL06 |
10200 |
2 |
AUTO |
C |
2,300 |
GR1 |
|
5 |
Jan 25, 2XX3 |
Jan 31, 2XX3 |
Jan 20, 2XX3 |
AM |
NA |
NA |
2 |
AUTO |
NA |
4,300 |
GR1 |
|
6 |
Jan 31, 2XX3 |
Jan 31, 2XX3 |
Jan 20, 2XX3 |
FM |
PL07 |
29321 |
2 |
AUTO |
NA |
6,290 |
GR1 |
|
7 |
Dec 31, 2XX2 |
Jan 6, 2XX3 |
Jan 1, 2XX3 |
AM |
PL01 |
32000 |
1 |
AUTO |
C |
3,400 |
GR1 |
|
8 |
Jan 15, 2XX3 |
Jan 15, 2XX3 |
Dec 15, 2XX2 |
FM |
PL01 |
32000 |
1 |
AUTO |
C |
3,400 |
GR1 |
|
9 |
Jan 31, 2XX3 |
Jan 31, 2XX3 |
Dec 31, 2XX2 |
FM |
PL01 |
53000 |
1 |
AUTO |
C |
1,230 |
GR1 |
This table shows how the Group Asset Consolidation process consolidates the nine group member cost rows into five group asset cost rows:
|
Group ID |
Trans Date |
Acct Date |
In Svc Date |
Depr Conv |
Project |
Category |
Cost |
|---|---|---|---|---|---|---|---|
|
GR1 |
Jan 1, 2XX3 |
Jan 31, 2XX3 |
Jan 1, 2XX3 |
AM |
1 |
AUTO |
4,300 |
|
GR1 |
Jan 1, 2XX3 |
Jan 31, 2XX3 |
Jan, 1 2XX3 |
AM |
2 |
AUTO |
6,600 |
|
GR1 |
Jan 1, 2XX3 |
Jan 31, 2XX3 |
Jan 1, 2XX3 |
FM |
2 |
AUTO |
6,290 |
|
GR1 |
Dec 1, 2XX2 |
Jan 31, 2XX3 |
Jan 1, 2XX3 |
AM |
1 |
AUTO |
3,400 |
|
GR1 |
Jan 1, 2XX3 |
Jan 31, 2XX3 |
Dec 1, 2XX2 |
FM |
1 |
AUTO |
4,630 |
The cost rows are consolidated in this way:
Group row 1 summarizes group member rows 1, 2, and 3.
Group row 2 summarizes group member rows 4 and 5.
Group row 3 summarizes group member row 6.
Group row 4 summarizes group member row 7.
Group row 5 summarizes group member rows 8 and 9.
Each of the group cost rows is then depreciated separately. In addition, the begin depreciation date for each asset is updated in this way:
|
Asset ID (Group Members) |
Updated Begin Depreciation Date |
|---|---|
|
1 |
January 1, 2XX3 |
|
2 |
January 1, 2XX3 |
|
3 |
January 1, 2XX3 |
|
4 |
January 1, 2XX3 |
|
5 |
January 1, 2XX3 |
|
6 |
February 1, 2XX3 |
|
7 |
January 1, 2XX3 |
|
8 |
January 1, 2XX3 |
|
9 |
January 1, 2XX3 |
Consolidation Summary Levels
The consolidation summary levels are:
Business unit.
Book.
Group asset ID.
Depreciation convention.
Transaction period (except when the actual-day convention is used; in that case, the actual transaction date is used instead of the period).
Period of accounting date.
Period of in-service date (ADD transactions only).
Category ChartField (required).
General ledger ChartFields and cost type (optional, depending on the settings on the Business Unit/Book Definition page).
Consolidation Example for Asset Adjustments
This example shows how group member cost information is consolidated for asset adjustments. In this example, Project ID and Category represent the ChartFields selected for summarization.
This table shows the cost records for nine member assets that belong to one group asset before you run the Group Asset Consolidation process:
|
Asset ID |
Trans Date |
Acct Date |
Depr Conv |
Oper Unit |
Dept |
Project |
Cate- gory |
Cost Type |
Cost |
Group Asset |
|---|---|---|---|---|---|---|---|---|---|---|
|
1 |
Mar 1, 2XX3 |
May 1, 2XX3 |
AM |
PL01 |
32000 |
1 |
AUTO |
C |
200 |
GR1 |
|
2 |
Mar 12, 2XX3 |
May 12, 2XX3 |
AM |
PL05 |
53000 |
1 |
AUTO |
NA |
120 |
GR1 |
|
3 |
Mar 15, 2XX3 |
May 31, 2XX3 |
AM |
NA |
53000 |
1 |
AUTO |
M |
250 |
GR1 |
|
4 |
Mar 31, 2XX3 |
May 12, 2XX3 |
AM |
PL06 |
10200 |
2 |
AUTO |
C |
90 |
GR1 |
|
5 |
Mar 20, 2XX3 |
May 30, 2XX3 |
AM |
NA |
11000 |
2 |
AUTO |
NA |
120 |
GR1 |
|
6 |
Apr 30, 2XX3 |
May 15, 2XX3 |
AM |
PL07 |
29321 |
2 |
AUTO |
NA |
75 |
GR1 |
|
7 |
Apr 30, 2XX3 |
Jun 1, 2XX3 |
AM |
PL01 |
32000 |
1 |
AUTO |
C |
200 |
GR1 |
|
8 |
May 15, 2XX3 |
Jun 14, 2XX3 |
AM |
PL01 |
32000 |
1 |
AUTO |
C |
430 |
GR1 |
|
9 |
May 31, 2XX3 |
Jun 30, 2XX3 |
AM |
PL01 |
53000 |
1 |
AUTO |
C |
892 |
GR1 |
This table shows how the Group Asset Consolidation process consolidates nine group member cost rows into five group asset cost rows:
|
Group ID |
Trans Date |
Acct Date |
DeprConv |
Project ID |
Category |
Cost |
|---|---|---|---|---|---|---|
|
GRP1 |
Mar 1, 2XX3 |
May 31, 2XX3 |
AM |
1 |
AUTO |
570 |
|
GRP1 |
Mar 1, 2XX3 |
May 31, 2XX3 |
AM |
2 |
AUTO |
210 |
|
GRP1 |
Apr 1, 2XX3 |
May 31, 2XX3 |
AM |
2 |
AUTO |
75 |
|
GRP1 |
Apr 1, 2XX3 |
Jun 30, 2XX3 |
AM |
1 |
AUTO |
200 |
|
GRP1 |
May 1, 2XX3 |
Jun 30, 2XX3 |
AM |
1 |
AUTO |
1,322 |
The cost rows are consolidated in this way:
Group row 1 summarizes group member rows 1, 2, and 3.
Group row 2 summarizes group member rows 4 and 5.
Group row 3 summarizes group member row 6.
Group row 4 summarizes group member row 7.
Group row 5 summarizes group member rows 8 and 9.